Tech Topic | August 2017 Hearing Review
Since the advent of digital hearing aids, and at least since 2004,1 there have been both clinical and engineering concerns about the ability of modern digital hearing aids to handle the higher-level elements of music without distortion. The long-term average speech spectrum (LTASS), regardless of language, has all of its energy below 85 dB SPL, and, as such, can be thought of as a relatively low-level input to a hearing aid. In contrast, even quiet recorded music can have peaks in excess of 100 dB SPL, and live music can have sustained periods in excess of 110 dB SPL.
Up until relatively recently, hearing aids just could not handle most forms of music without appreciable distortion. The distortion is related to what has colloquially been called the “front end” of a poorly configured analog-to-digital (A/D) converter. Traditionally, many “front ends” have not been able to handle inputs in excess of 90-95 dB SPL, and while that is sufficient for speech, it is not sufficient for music (visit www.chasin.ca/distorted_music).2
The maximum levels that can be transduced by the “front end” is, in part, related to the 16-bit architecture that, until quite recently, has been ubiquitous in the hearing aid industry. While the input dynamic range associated with a 16-bit technology is limited to the 90-95 dB range, the hearing aid industry has been rather ingenious in their approaches to getting around this limitation.
Of the many technical innovations found in the hearing aid industry, these can be classified as either: 1) Reducing the input to the A/D converter and then digitally re-establishing the signal, or 2) Increasing the level that the A/D can optimally operate in. A frequently-used metaphor is either ducking under a low-hanging bridge or doorway, or increasing the level of the bridge or doorway. High levels of music (or a hard-of-hearing person’s own voice) will be distorted if the doorway is too low.
Recently there have been some technical innovations by some manufacturers that involve both reducing the input (such as with a compressor before the A/D converter) and also post 16-bit architecture. This article reports on one such combination of technologies. Increasing the effective number of bits in the hearing aid architecture to 19 or 20 bits has allowed inputs in excess of 110 dB SPL to be digitized without appreciable distortion.

Table 1. Table 1: The asterisk (*) indicated the music pieces that were judged to be statistically significantly (a = 0.05 level) better showing that musicians preferred (based on clarity and naturalness) the “autowave on” function over the “autowave off” function.
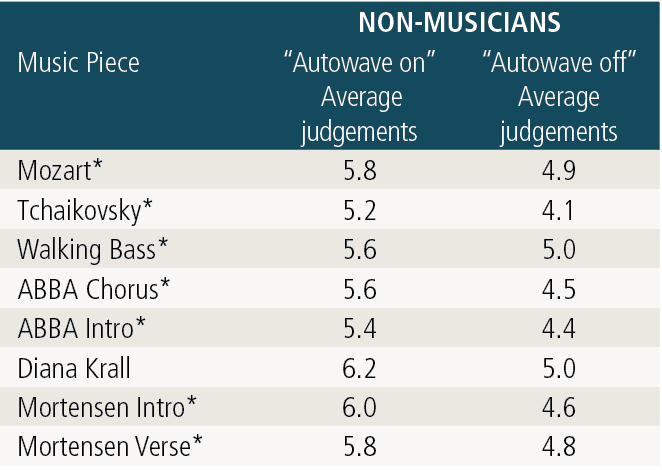
Table 2. The asterisk (*) indicates the music pieces that were judged to be statistically significantly (a = 0.05 level) better, showing that non-musicians preferred (based on clarity and naturalness) the “autowave on” function over the “autowave off” function.
Test Methods
One such technology involves an improved IC architecture that functions effectively with a 20-bit input dynamic range (allowing undistorted pure-tone inputs of 113 dB SPL) which is, in part, also related to an input compressor prior to the A/D converter. This combination of innovations, available in the Oticon Opn, has been assessed formally using 10 non-musicians and 10 musicians who were all experienced hearing aid users.
These two groups of participants—experienced non-musician hearing aid users and experienced musician hearing aid users—were fitted with either “old” technology or “new” technology hearing aids in a randomized fashion. The hearing aid fittings were optimized for their hearing losses and verified using real ear measurements. Neither the subjects nor the person doing the hearing aid fittings knew whether the technology was “old” or “new.” The “old” technology possessed neither the pre-A/D converter compressor nor the post 16-bit architecture, whereas the “new” technology incorporated both of these innovations.
Each subject wore the hearing aids for one week at which point they were seen again and fit with either the “old” or “new” technologies and, again, randomly assigned to each group of subjects. This continued for 4 weeks, at the end of which each subject had worn the “old” technology for 2 weeks and the “new” technology for 2 weeks, in a random order. At the end of each week, subjects completed a computerized version of the Device-Oriented Subjective Outcome (DOSO) scale.3 As noted by Cox et al, “…compared with wearer-oriented outcomes, device-oriented outcomes were more independent of personality variables” [p 727].
The DOSO scale compares two devices —from the week just completed and with the week just prior—with the first week being compared with the subjects’ own hearing aids. These “difference” measures were performed within each subject such that variability was minimized. Each subject therefore completed 4 DOSO scales: two for the “old” technology and two for the “new” technology.
The 40-item DOSO scale provides measures on 6 subscales: Speech cues, Listening effort, Quiet, Pleasant, Convenience, and Use. The final 3 questions in the DOSO pertain to patterns of Use, and these were left out since this was a controlled experiment and this subscale would not have shown differences. Although assessed, the Convenience subscale did not provide additional information, since these were all experienced hearing aid users.
Results
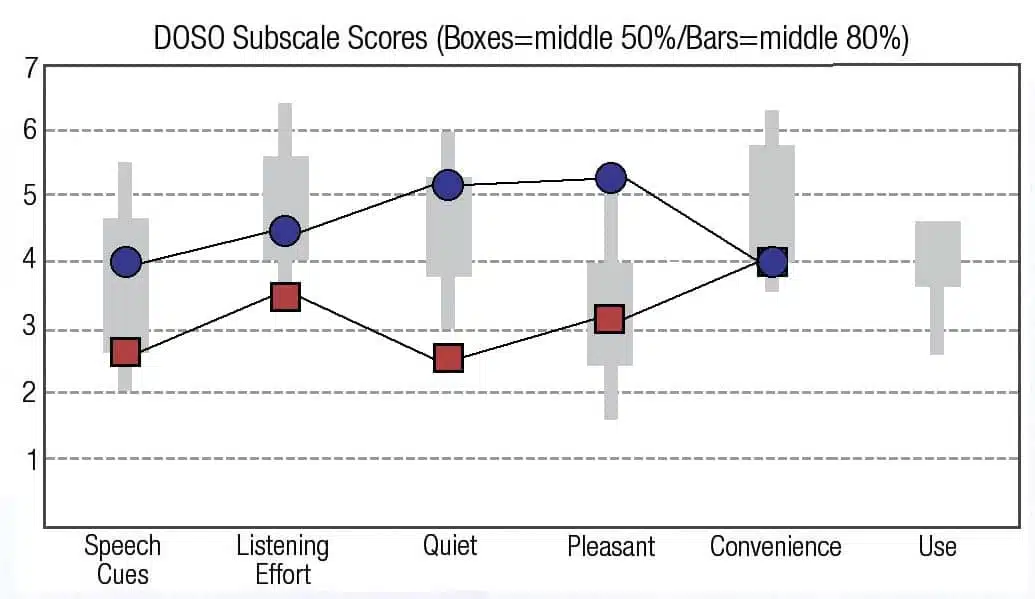
The results for the 37-item DOSO scale, showing the results for the first 5 subscales are shown in Figure 1a for the 10 musicians and Figure 1b for the 10 non-musicians. In all cases, for the first 4 sub-scales, the “old” technology (red squares) scored a significantly lower percentile range than the “new” technology (blue circles). Each data point represented the average of 40 DOSO subscales (10 subjects x 4 weeks). The boxes for each subscale shows the range for the 50 percentile, and the bars the DOSO scale normative data for the 80 percentile.
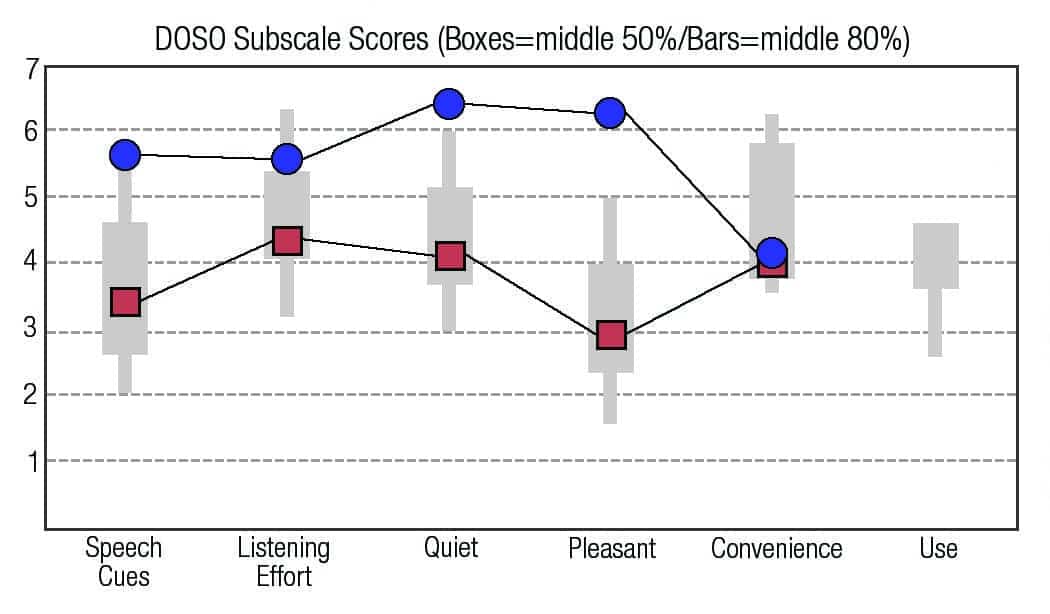
Figure 1a. Averages for the 10 musicians using the “old” (red squares) and the “new” Oticon Opn (blue circles) technologies of the on the DOSO subscales.

Figure 1b. Averages for the 10 non-musicians using the “old” (red squares) and the “new” Oticon Opn (blue circles) technologies on the DOSO subscales.
At some point during the 4 to 5 week span of the assessment, each subject was asked to rate recorded music through hearing aids with the pre A/D converter input compressor turned off (“autowave off”) or turned on (“autowave on”). Eight pairs of musical samples were played to each of the 20 study participants. Each of the samples were randomized as “autowave on” or “autowave off.” Subjects were asked to rate each of the samples for naturalness and clarity, according to a 7-point scale.4,5 There were no statistically significant differences between the naturalness judgement and the clarity judgement, so both judgements were averaged for each subject.
The music songs were recorded with a 100 dB SPL input level (with the limit of most hearing aid microphones being on the order of 115-119 dB SPL depending on the supplier of the hearing aid microphones). Spectral analysis performed on the music samples indicated that the “autowave on” function allowed 16-18 dB higher sound levels than with the “autowave off” function. The music samples were normalized in order to be able to compare the sound quality for the subjects.
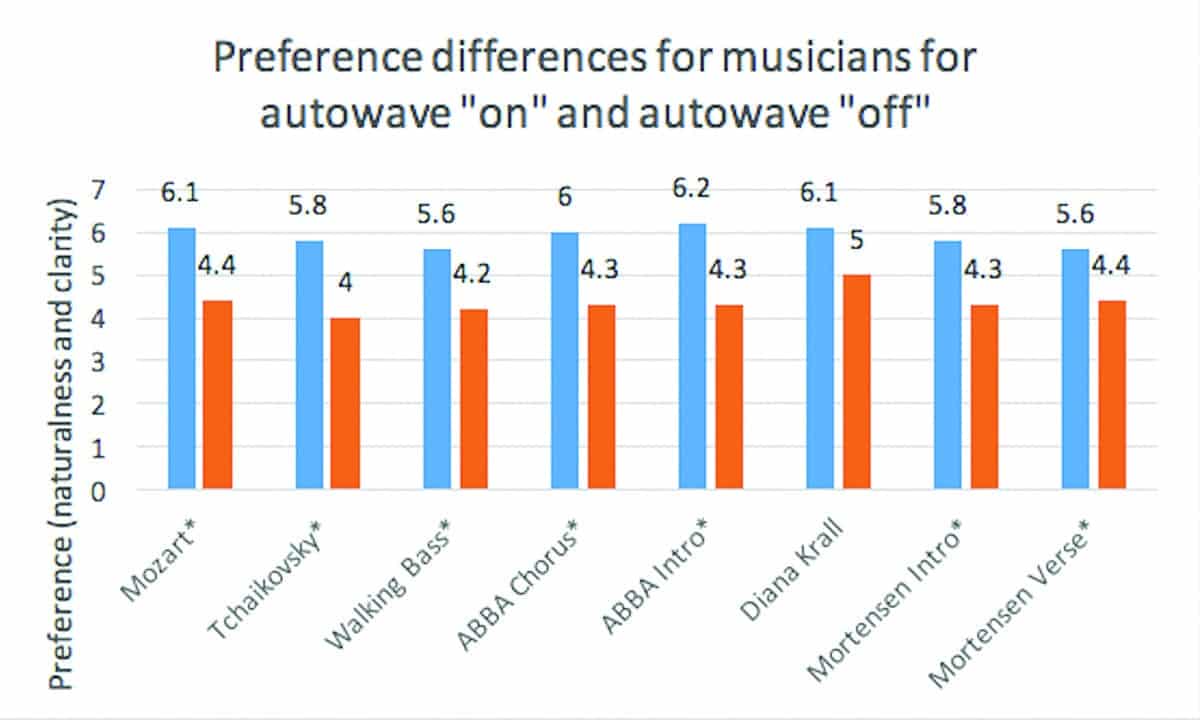
Figure 2a. Average preferences (naturalness and clarity) for 10 musician subjects for the eight pieces of recorded music with the astrisk (*) showing whether the differences between the “autowave on” (blue bars) and the “autowave off” (orange bars) achieved statistical significance at a = 0.05.
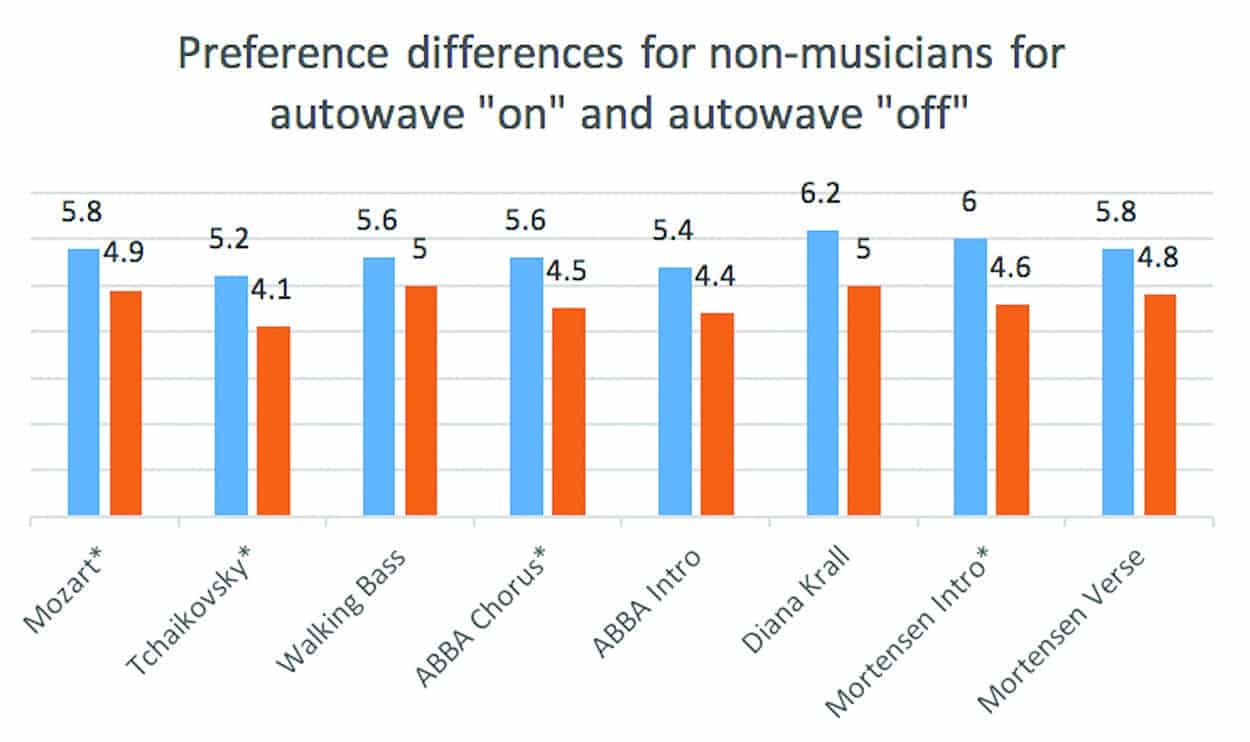
Figure 2b. Average preferences (naturalness and clarity) for 10 non-musician subjects for the eight pieces of recorded music with the astrisk (*) showing whether the differences between the “autowave on” (blue bars) and the “autowave off” (orange bars) achieved statistical significance at a = 0.05.
Conclusion
A new technology that utilizes more than one innovation such as a post 16-bit architecture and a compression circuitry prior to the digitization process has been shown to provide improved naturalness and clarity for both musicians and non-musicians while listening to music. In addition, this combination of technologies has allowed these same two groups to find that speech cues are easier to hear; the listening effort in noisy locations is lower; the ability to hear speech in quiet is better; and the sound is more pleasant.
Acknowledgements
This research has been approved through the University of Toronto Institutional Review Board protocol (reference #32422). Remuneration from Oticon has been received by the author for subject recruitment and partial payment of salary for a research associate and administrative overhead at the Musicians’ Clinics of Canada. Non-labeled test hearing aids were provided by Oticon with the “new” (Oticon Opn) and the “old” technologies. These were returned to Oticon after the end of the testing. The author thanks Julie Neel Weile, Thomas Behrens, and Nicolas Le Goff for the assistance in the design and technical information required to run this blinded experiment.
 Correspondence can be addressed to HR or Dr Chasin at: [email protected]
Citation for this article: Chasin, M. A novel technique to improve amplified sound quality for both music and speech. Hearing Review. 2017;24(8):32-36.
References
-
Chasin M, Russo F. Hearing aids and music. Trends Amplif. 2004;8(2):35-48.
-
Chasin M. The ‘best hearing aid’ for listening to music: Clinical tricks, major technologies, and software tips. Hearing Review. 2014;21(8):26-28.
-
Cox RM, Alexander GC, Xu J. Development of the Device-Oriented Subjective Outcome (DOSO) Scale, J Am Acad Audiol. 2014;25(8):727-736. DOI: 10.3766/jaaa.25.8.3.
-
Gabrielsson A, Sjögren H. Perceived sound quality of sound-reproducing systems. J Acoust Soc Am. 1979;65(4): 1019–1033.
-
Gabrielsson A, Hagerman B, Bech-Kristensen T, Lundberg G. Perceived sound quality of reproductions with different frequency responses and sound levels. J Acoust Soc Am. 1990;88(3);1359-1366.