Tech Topic | October 2013 Hearing Review
By Tara Helbling, AuD, Matthias Vormann, PhD, and Kirsten Wagener, PhD
A blinded paired-comparison study suggests that listeners preferred the fast-acting Speech Priority Noise Reduction system from Sonic over a competitive noise reduction strategy.
Hearing in background noise has long been identified as one of the biggest problems facing hearing instrument users.1,2 Whereas noise reduction algorithms developed for hearing aids have been shown to improve sound comfort, they also can degrade speech recognition if applied too aggressively.3 It is important that hearing instruments strike the right balance between providing exceptional listening comfort in noise while maintaining speech intelligibility.
In 2011, Sonic introduced Speech Variable Processing (SVP), its newest advancement in digital signal processing. SVP allows for broadband signal analysis, which eliminates the traditional need to split the incoming signal into channels. Because of the fast time constants possible with this platform, SVP can identify immediate changes in the sound pressure level of the incoming signal. The speed of Speech Priority Noise Reduction (SPNR) is just as fast. This is essential in the algorithm’s ability to detect and then estimate the environment’s signal-to-noise ratio (SNR) more accurately, and more reliably. Reliable detection and estimation of the SNR is a critical component leading to accurate gain reductions for steady-state signals, familiarly known as background noise.
Historically, Sonic has always used fast time constants with its digital noise reduction system to provide better sound quality in noise.4 Now as a direct result of SVP’s increased processing capacity, the relationship between SVP and SPNR works better together: SPNR reduces attenuation when speech is present, and SVP immediately applies the correct gain. This is how the estimation of the SNR has been improved in dynamic sound environments, compared to before. The concept behind Sonic’s Speech Priority Noise Reduction (SPNR) algorithm is that it must—as quickly as possible—identify and separate the fluctuations of speech from the background noise in the incoming signal, even within the pauses between phonemes. Faster identification of noise in a speech signal should result in a more effective reduction of noise. If speech signals are simultaneously preserved, it follows that favorable listening preferences should be obtained in noisy conditions.
To test if SPNR’s fast time constants support preferred listening conditions in background noise, an independent study was made to evaluate the maximum noise reduction settings found in currently available Sonic hearing instruments compared to the baseline state (off), and also compared to a different, commercially available hearing instrument that employs noise reduction with slower time constants.
Study Methods
Devices. Two brands of commercially available hearing devices were set up for a comparative evaluation. Settings “Off” and “Maximum” were selected within the EXPRESSfit fitting software for testing the Sonic devices against each other. The setting “Maximum” was selected for a competitor product. Table 1 shows the selected devices, the targeted noise reduction settings, and the corresponding designators for the blinded conditions of the study.
Test measures. Traditional forms of speech testing, as well as paired comparisons, were employed to evaluate a multitude of speech and listening preference data. Speech intelligibility in quiet and in noise was measured by the WAKO monosyllabic rhyme test5 and the Oldenburg Sentence test (OLSA),6 respectively. Subjective assessments regarding sound quality preferences using a Virtual Hearing Aid were completed via paired comparison testing. Descriptions of each test and its method follow. The study also used two speech intelligibility measures:
WAKO. In the present study, WAKO test lists with 47 consonant-vowel-consonant (CVC) items were used that test for intelligibility of the initial or final consonant applying a closed response format (recognized word has to be identified out of 5 visually presented response alternatives that differ only in one phoneme).7 The WAKO speech material was presented in quiet from 0° azimuth with a presentation level of 45 dB SPL in the sound field in the unaided and aided conditions listed in Table 1.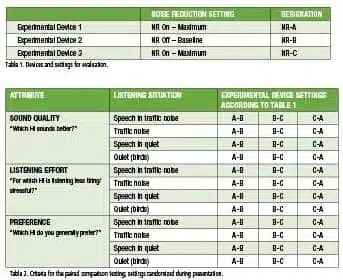
OLSA. The Oldenburg Sentence Test quantitatively measures speech intelligibility in background noise. In a sound field setting, the OLSA presents continuous noise, and employs an adaptive measurement method8 to determine the speech reception threshold (SRT, the SNR that yields 50% intelligibility). The subjects’ task was to repeat all words that were understood and the results were analyzed with word scoring. In the present study, both speech signal and continuous speech shaped noise were presented from 0° azimuth at a noise presentation level of 65 dB SPL, where the speech presentation level differed according to the adaptive procedure. Prior to the measurements of the unaided and aided conditions (see Table 1), two training lists with 20 sentences each were presented: 1) In quiet, and 2) Following the same procedure that was used in the main measurements.
Sound Quality Measures
Paired comparisons were used to subjectively rate attributes for the perception of sounds by directly comparing two sounds at a time. The task for the subjects is to select the sound which they prefer or for which a specific attribute is stronger. This can easily be done without having much experience.
In the study, the three hearing instruments with varying time constants from Table 1 are rated. Since it is too complex and time-consuming to change hearing instruments for every rating, the Oldenburg Virtual Hearing aid is used. In the first step, the sounds of the three hearing instruments are recorded dichotically in the ear canal close to the raters’ eardrum using in situ recording with a probe microphone tube. In the second step, the recordings are played back using insert earphones, adequately filtered to produce the same time-dependent SPL at the raters’ eardrum as during the recordings. Since the same input (eg, speech in noise) is used for generating all recordings in the lab, the playback for all pairs of hearing instruments can be synchronized and the rater may switch between two instruments without any distortions. Using this method, direct comparisons between the hearing instruments are possible, allowing for the detection of very small differences. Moreover, the comparisons are blind, thereby avoiding non-acoustic biases, such as brand, design of the hearing instruments, or attitude of the experimenter.
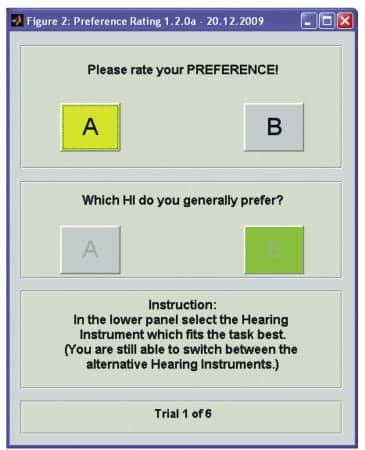
For the purposes of the study, the subjects were asked to compare two hearing devices and to rate which of them (“A” or “B”) was preferred by making their choice on a touchscreen monitor using a graphical user interface (Figure 1). The recordings were played in a loop; therefore, the subjects could change between the programs as often as they wanted before giving the final rating.
|
| Figure 1. Graphical user interface for carrying out the paired comparison task. |
In the full paired comparison task, each subject rates three attributes for three hearing instruments in four different listening situations (see Table 2 for an overview).
Sessions. Two sessions were arranged for the study. On the first visit, pure-tone audiometry was conducted, and the hearing instruments were fit to the subjects’ ears. The WAKO test was administered, followed by in situ recordings for the Oldenburg Virtual Hearing Aid. On the second visit, the OLSA test was administered and the paired comparison listening tests with the Virtual Hearing Aid were conducted to obtain noise reduction preference ratings.
Hearing instruments. Behind-the-ear (BTE) hearing instruments were used. All adaptive features were turned off, except the noise reduction (in the case of Experimental Devices 1 and 3 as shown in Table 1) and the feedback canceller. Directionality was set to Fixed Omni, and all other parameters between instruments were matched. The hearing instruments were acoustically coupled to the ear by power dome, tulip dome, or closed earmold based on subject needs. For each subject, the same acoustic coupling was applied for all hearing devices.
Subjects. A total of 20 subjects ages 42-77 years (mean 68.6 years ±8.5) participated in the study. There were 12 males and 8 females who were all experienced hearing instrument users. Figure 2 shows the mean audiometric pure-tone thresholds and inter-individual standard deviations of the right and left ears.
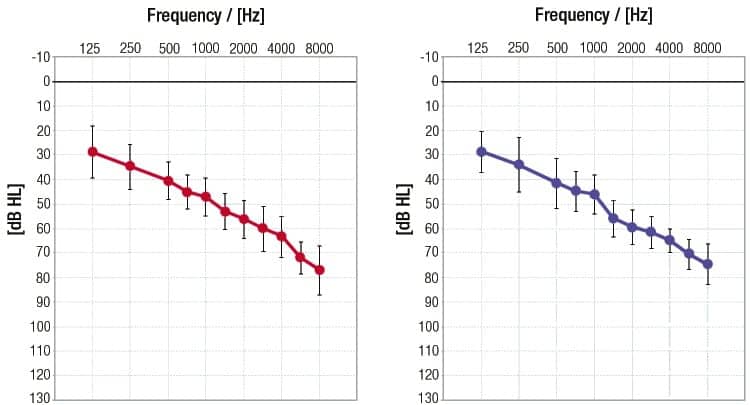
|
| Figure 2. Mean audiogram and standard deviations. |
Results
Speech intelligibility. The WAKO test, presented in quiet at 45 dB SPL, shows a median score of 35% correct speech intelligibility for the unaided conditions. Aided results show an improvement for median speech intelligibility scores at 68%, 70%, and 72% correct for hearing aids NR-A, NR-B, and NR-C, respectively. There is no significant difference across the aided configurations, as seen in Figure 3.
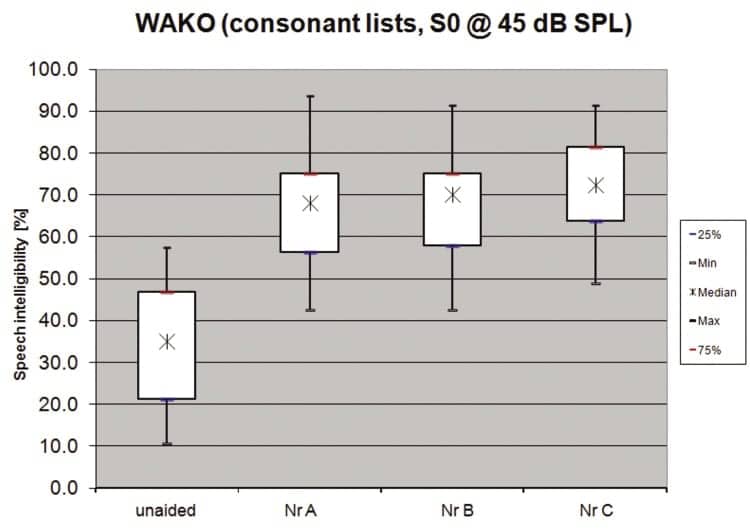
|
| Figure 3. Speech intelligibility in quiet [%] for unaided and aided conditions. |
OLSA, the adaptive SRT test method to yield 50% speech intelligibility, shows that the median unaided SRT in continuous 65 dB SPL speech-shaped noise (olnoise) was measured at -2.6 dB SNR. For the aided conditions, median SRTs in noise show improvement at -4.9, -4.5, and -4.2 dB SNR for NR-A, B, and C, respectively. There is no significant difference across the aided configurations, as seen in Figure 4.
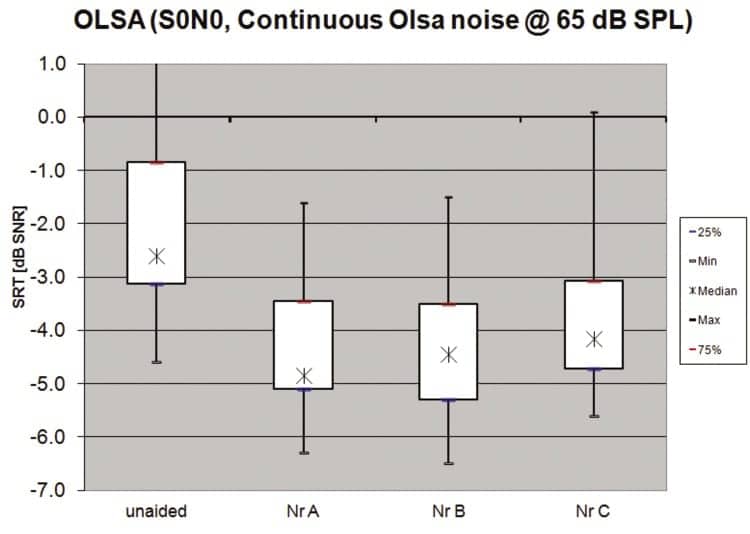
|
| Figure 4. Speech intelligibility in noise for unaided and aided conditions. |
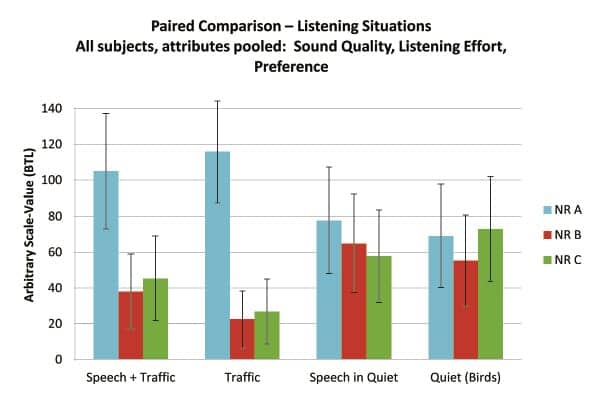
Sound quality. The subjects compared all of the 36 pairs shown in Table 2. A BTL Model9 was used to obtain a ratio-scaled representation of the data according to Wickelmaier and Schmid.10 The individual distances for the 20 subjects are summed for each listening situation. Figure 5a shows the results for all attributes (sound quality, listening effort, and preference) pooled over the four listening situations. In the two noise conditions (Speech + Traffic, Traffic), NR-A is rated significantly better than NR-B or NR-C. In the Speech in Quiet situation, NR-A is slightly better than the other programs, whereas NR-C has a little advantage when listening to the high frequency sound “Birds.”
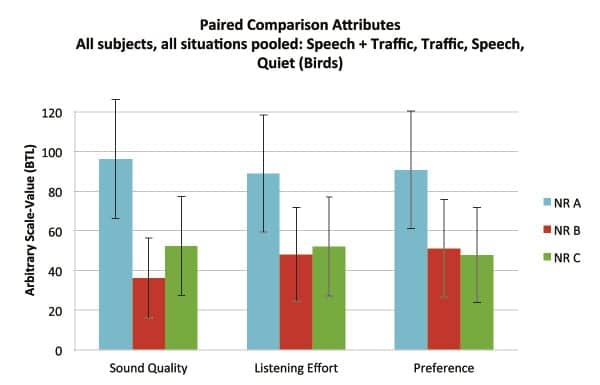
Figure 5b shows the results for all listening situations pooled over the three attributes. NR-A is rated significantly better than NR-B and better than NR-C for Sound Quality; NR-A also shows an advantage for Listening Effort and Preference over NR-B and NR-C.
Discussion
Speech intelligibility. Compared to the unaided conditions, the improvement in speech intelligibility in quiet seen with NR-A, B, and C comes from wearing a hearing instrument with appropriate amplification for the individual hearing loss. Looking specifically at NR-A, B, and C, the results show no significant difference in speech intelligibility scores with the two implementations of the noise reduction settings (NR-A, NR-C) compared to the baseline (NR-B). Although this is to be expected in quiet conditions, it is important to note that speech intelligibility scores did not decrease in the aided conditions, confirming that the noise reduction settings are not interfering with speech signals in a quiet environment.
|
|
Figure 5a. BTL-scaled results of paired comparisons for the four listening situations, pooled over the three attributes Sound Quality, Listening Effort, and Preference. The error-bars represent the 95% confidence intervals. |
The OLSA test, examining speech intelligibility in noise, shows that the SNR to yield 50% intelligibility of SRTs in continuous levels of broadband noise (65 dB SPL presentation level), improved with amplification compared to unaided conditions. Comparing NR-A, B, and C, the results show no significant difference in SNR scores with the two implementations of the noise reduction settings (NR-A, NR-C) compared to the baseline (NR-B). It is important to note that speech intelligibility was not negatively affected when the noise reduction was activated. These results confirm that speech intelligibility is preserved with both NR-A and NR-C, even at maximum strength, in noisy testing conditions.
|
| Figure 5b. BTL-scaled results of paired comparisons for the three attributes, pooled over the four listening situations. The error-bars represent the 95% confidence intervals. |
Sound quality. When interpreting which hearing instrument settings are most favored in noisy listening situations (either alone or with speech), NR-A was chosen significantly more times over NR-B and NR-C. In quiet situations (either alone or with speech), no significant difference was found favoring one implementation over the other. Therefore, in noisy situations, NR-A brings significant relief; in quiet situations, no perceptual differences are detected with noise reduction activated.
When interpreting the hearing instruments concerning the attributes, NR-A consistently received the most votes for Sound Quality. It also trends toward an advantage regarding Listening Effort and Preference, although a significant difference was not achieved.
Overall, NR-A was found to be the better hearing instrument compared to NR-B and NR-C for the tested listening situations and attributes.
Conclusions
Better sound quality and a greater preference for hearing in noise was found in the tested noise reduction system that is available in Sonic’s Bliss, Charm, and Flip hearing instrument families when compared to a competitive noise reduction system. The variable that this difference is attributed to is the speed of the noise reduction system, with Sonic’s noise reduction system having faster time constants than those found in the competitor’s system.
With the faster processing speed contained in Sonic devices, the estimation of the SNR was found to be more reliable and accurate than that in a slower system. This leads to robust, favorable differences that can be perceived to a significant degree by those with varying degrees of hearing impairment.
Acknowledgements
The authors thank the Hoerzentrum Oldenburg for collection and statistical analysis of the data. The authors are also grateful to Martin Kuriger for his technical contributions to the algorithm, and to Neil Hockley and Kathy Landon for their helpful comments.
Tara Helbling, AuD, (pictured) is a technical communicator for Sonic in Bern, Switzerland; Matthias Vormann, PhD, and Kirsten Wagener, PhD, Department Supervisor, are auditory researchers in Audiology Projects at Hörzentrum, Oldenburg, Germany.
CORRESPONDENCE can be addressed to Dr Helbling at: [email protected]
References
1. Kochkin S. MarkeTrak V: Why my hearing aids are in the drawer: The consumer’s perspective. Hear Jour. 2000;53(2):34-42.
2. Kochkin S. MarkeTrak VIII: Customer satisfaction with hearing aids is slowly increasing. Hear Jour. 2010;63(1):11-19.
3. Ricketts T, Hornsby B. Sound quality measures for speech in noise through a commercial hearing aid implementing digital noise reduction. J Am Acad Audiol. 2005;16:270–277.
4. Nilsson, M, Bray V. Benefit from Noise Reduction and Directionality in BTEs. Somerset, NJ: Sonic Innovations: 2002.
5. Wallenberg EL, Kollmeier B. Sprachverständlichkeitsmessungen für die Audiologie mit einem Reimtest in deutscher Sprache: Erstellung und Evaluation von Testlisten. Audiologische Akustik. 1989;38:50-65.
6. Wagener K, Kuehnel V, Kollmeier B. Development and evaluation of a German sentence test; Part I-III: design, optimization, and evaluation of the Oldenburg sentence test. Zeitschrift für Audiologie. 1999;38:86-95.
7. Brand T, Wagener K. Wie lässt sich die maximale Verständlichkeit optimal bestimmen? In: Jahrestagung der Deutschen Gesellschaft für Audiologie. Zeitschrift für Audiologie. 2005; Vol Suppl 8 [CD-ROM].
8. Brand T, Kollmeier B. Efficient adaptive procedures for threshold and concurrent slope estimates for psychophysics and speech intelligibility tests. J Acoust Soc Am. 2002;111:2801–2810.
9. Luce RD. Individual Choice Behavior. New York: Wiley; 1959.
10. Wickelmaier F, Schmid C. A Matlab function to estimate choice model parameters from paired-comparison data. Behaviour Research Methods, Instruments & Computers. 2004;36:29-40.
Citation for this article: Helbling T, Vormann M, Wagener K. Speech priority noise reduction: A digital noise reduction preference study. Hearing Review. 2013;10(11):34-43.
Tech Topic | October 2013 Hearing Review