A review of recent findings and new developments with regard to ASSR, as well as new software-based algorithms and hardware solutions.

|

|

|
| This article was submitted to HR by Douglas L. Beck, AuD, director of professional relations at Oticon Inc, Somerset, NJ; David P. Speidel, MS, director of audiology services; and Jill Gordon Craig, MA, clinical advisor (EP/OAE) at Interacoustics, Eden Prairie, Minn. Correspondence can be addressed to HR or Dr Beck at . | ||
The Auditory Steady-State Response (ASSR) is similar to auditory brainstem response (ABR) in many ways. However, ASSR potentially evaluates four frequencies (500, 1000, 2000, and 4000 Hz) in both ears simultaneously, and ASSR can help differentiate severe from profound hearing loss—a distinction that is clearly meaningful and significant with regard to aural (re)habilitation and the selection of powerful hearing aids versus cochlear implants.
ASSR has multiple applications with regard to hearing screenings and diagnostic audiology. ASSR facilitates a rapid and statistically valid estimate of hearing thresholds, and ASSR can add significant threshold information while evaluating patients unable or unwilling to participate in behavioral tests. Recent findings and new developments with regard to ASSR stimulus, software-based algorithms, and hardware solutions will be addressed in this article.
The goal of ASSR is to create a statistically valid estimated audiogram.1 Successful incorporation of ASSR into the well-accepted and assorted audiology armamentarium will not replace previously accepted tools. Rather, ASSR will serve as yet another tool that enhances our ability to “cross check” and verify prior to arriving at a differential diagnosis.2
ASSR Versus ABR
ASSR and ABR use many of the same basic tools and protocols; thus, it is reasonable to compare and contrast the two.
The similarities between ABR and ASSR include:
- Both deliver an auditory stimulus;
- Both stimulate the auditory system;
- Both record bioelectric responses from the auditory system via electrodes; and
- In each protocol, the patient does not have to respond volitionally.
The differences between ABR and ASSR include:
- ABR stimulus is usually a click or a tone burst (one tone and one ear at a time) presented at a slower rate, whereas ASSR uses amplitude or frequency modulated sounds presented rapidly to excite the auditory system while stimulating four frequencies and both ears simultaneously.
- ABR is highly dependent on a relatively subjective analysis of amplitude versus latency. ASSR is dependent on a statistical analysis of the probability of a response, usually at a 95% confidence level.
- The ABR response is measured in millionths of a volt (microvolts), and the ASSR is measured in billionths of a volt (nanovolts).
For an in-depth review of ASSR/ABR similarities, see James Hall’s article3 in the August 2004 HR.
Literature Review
Venema4 examined ASSR responses from subjects using two different ASSR stimuli. Among ASSR advantages, Venema reported reduced test time and the use of artificial intelligence to determine response versus no response. He noted “ASSR seems quite promising at estimating configuration or shape of the behavioral audiogram.”
Lin et al5 evaluated 142 subjects from January through June 2007. Hearing thresholds at 500, 1000, 2000, and 4000 Hz were evaluated. All subjects received behavioral puretone audiometry, ASSR, and ABR. Correlations between ASSR and behavioral tests, as well as correlations between ABR and behavioral tests, were reported. The authors reported correlation coefficients (r) of ASSR with behavioral thresholds as 0.89 at 500 Hz, 0.95 at 1000 Hz, 0.96 at 2000 Hz, and 0.97 at 4000 Hz. The correlation value for ABR was determined to be 0.83. Lin et al concluded ASSR was more reliable than ABR in predicting hearing thresholds.
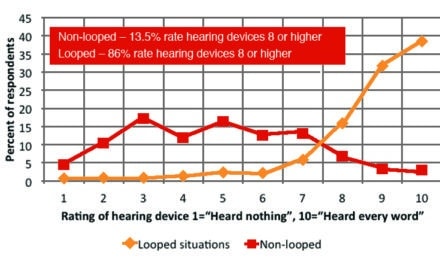
Table 1 displays information from a presentation to the International Symposium on Auditory and Audiological Research by Elberling et al.6 These results indicate “CE Chirp”-derived ASSR thresholds are more similar to behavioral thresholds than previous ASSR stimuli. In brief, the differences between ASSR thresholds obtained using CE Chirp stimuli (to be discussed below) and puretone thresholds using behavioral audiometry were within 11 dB (±7 dB) at 500 Hz, 10 dB (±7 dB) at 1000 Hz, 6 dB (±5 dB) at 2000 Hz, and 13 dB (±4 dB) at 4000 Hz. (Authors’ Note: “CE Chirp” is respectfully so named in honor of our colleague, Claus Elberling, PhD.)
|
| TABLES 1a-b. Left box (1a) demonstrates means and standard deviations obtained with “CE Chirp” stimuli on 20 normal-hearing adults; right box (2a) demonstrates data grouped from four previous studies using non-chirp ASSR stimuli. |
Rance et al7 compared ASSR responses acquired within 3 months of birth to later-acquired behavioral responses. A total of 575 subjects were evaluated (285 with normal hearing, 271 with sensorineural hearing loss, and 19 with auditory-neuropathy-type hearing loss). Rance et al determined ASSR and behavioral thresholds for subjects with normal and sensorineural hearing loss were highly correlated (Pearson r-values exceeded 0.95 at each test frequency). The authors noted ASSR testing during the first months of life can offer information accurate enough to serve as the “basis for hearing aid fitting and early intervention.”
|
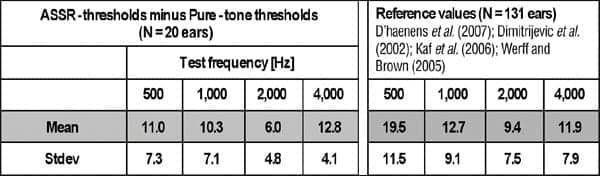
| FIGURE 1. The CE Chirp has a flat spectrum from 200 to 8000 Hz. From Elberling et al.9 |
D’haenens et al8 evaluated the test-retest reliability of ASSR across 29 normal-hearing subjects (ages 18 to 30 years). Statistical measures employed were Pearson product-moment correlation, analysis of variance, and standard error of the mean. The authors determined there was a 95% chance ASSR thresholds would be repeated (within ±17 dBHL at 500 Hz, within ±12.3 dBHL at 1000 Hz, within ±10.6 dBHL at 2000 Hz, and within ±11.3 dBHL at 4000 Hz), and they note the test-retest reliability of ASSR was clinically acceptable.
CE Chirp Stimuli
Previously, as stimuli presentation loudness approached normal and mild hearing thresholds, the quantity of hair cells activated decreased. Thus, test time increased, accuracy decreased, and threshold testing and estimation became less certain. Recently, the “CE Chirp” stimuli have been introduced in the Interacoustics Eclipse ASSR System to maintain a larger quantity of hair cells in the response, thus making the response more robust and easier to detect (Figure 1).
The CE Chirp compensates for the “cochlear traveling wave delay” and increases “temporal synchrony” within the cochlea while producing higher amplitude responses than click stimuli.9
|
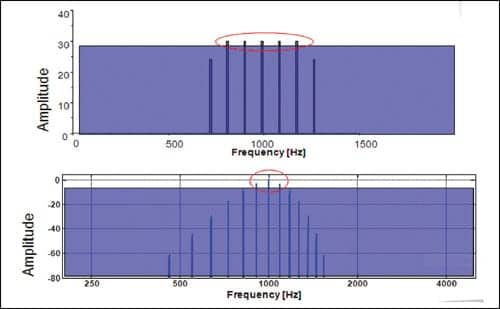
| FIGURE 2. Top: CE Chirp stimulus creates increased response from side band frequencies. Bottom: Traditional ASSR stimulus creates minimal response from side band frequencies. |
The CE Chirp has several unique and beneficial properties that contribute to reduced test time and improved audiogram threshold estimation.
- Side band frequencies are maintained, enabling more hair cells to be stimulated at lower intensity levels, while producing response amplitudes twice as large as previous stimuli (see Figure 2).
- The frequency separation of the side bands produces the desired “modulation rate.” For example, consider a 990 Hz center frequency with side bands separated by 90 Hz (900, 810, 990, 1080, 1170 Hz), thus producing a modulation rate of 90 Hz.
- Input compensation allows low frequency acoustic segments to be initiated before high frequencies, causing sequential frequencies to reach their destinations along the basilar membrane at the same time.
Full Spectrum Detection Engine
Various algorithms have been used to mathematically detect an electrophysiological response from the auditory pathway. First-generation ASSR systems detected auditory responses in the time or frequency domains using a “one sample” test (ie, the response was obtained from a single harmonic, the fundamental frequency). Nonetheless, recent data indicates the inclusion of higher harmonics produces superior results.10
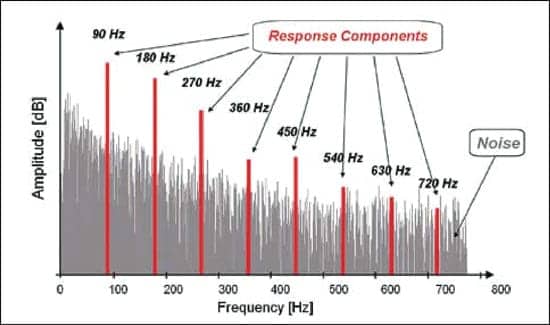
In Figure 3, a stimulus repetition rate of 90 Hz is shown. Note that, in addition to the fundamental frequency (90 Hz), additional harmonics are present (180 Hz, 270 Hz, etc). The first harmonic produces the largest amplitude, yet additional and significant information can be ascertained from additional harmonics. Cebulla et al10 determined the q-sample test based on the fundamental frequency in tandem with higher harmonics produced better detection of the auditory response compared to previous methods.
|
| FIGURE 3. Note fundamental frequency of 90 Hz, plus multiple harmonics at 180 Hz, 270 Hz, 360 Hz, etc. |
The Full Spectrum Detection Engine (available in the Interacoustics Eclipse ASSR system) combines phase coherence and response amplitudes for maximal detection while reducing test time and increasing accuracy.10 Interacoustics has successfully implemented the patented CE Chirp stimulus and the Full Spectrum Detection Engine into the Eclipse Evoked Potential Hardware. Note, the Eclipse hardware contains a standard 2-channel ABR system, thus the ASSR function can use the same electrode array and run two full spectrum detection engines simultaneously for maximal efficiency. This new technology allows the hearing care professional to assess hearing thresholds quickly and accurately. The user-friendly software module has data-supported correction factors and “real time” control over frequency and loudness while testing, and it is NOAH compatible, facilitating immediate RECD measurements and hearing aid fittings.
Summary and Discussion
Clinical interest and application of ASSR have helped initiate ongoing creative and technical developments with regard to ASSR. Ongoing developments in ASSR continue to demonstrate improved and reliable performance with regard to hearing screenings and diagnostic applications. ASSR facilitates statistically valid estimates of normal hearing thresholds in less time, while availing additional useful information with regard to overall hearing.
References
- Beck DL, Speidel DP, Petrak M. Auditory steady-state response (ASSR): a beginner’s guide. Hearing Review. 2007;14(12):34-37.
- Jerger JF, Hayes D. The cross-check principle in pediatric audiometry. Arch Otolaryngol. 1976;102(10):614-620.
- Hall JW III. ABRs or ASSRs? The application of tone-burst ABRs in the era of ASSRs. Hearing Review. 2004;11(9):22-30,60.
- Venema T. The ASSR revisited: a clinical comparison of two stimuli. Hearing Review. 2005;12(6):54-59,70.
- Lin YH, Ho CH, Wu HP. Comparison of auditory steady state responses and auditory brainstem responses in audiometric assessment of adults with sensorineural hearing loss. Auris Nasus Larynx. 2009;36(2):140-145.
- Elberling C, Cebulla M, Sturzebecher E. Simultaneous multiple stimulation of the ASSR. Paper presented at: International Symposium on Auditory and Audiological Research (ISAAR); Denmark; December 2007.
- Rance G, Roper R, Symons L, et al. Hearing threshold estimation in infants using auditory steady-state responses. J Am Acad Audiol. 2005;16:291-300.
- D’haenens W, Dhooge I, De Vel E, Maes L, Bockstael A, Vinck BM. Auditory steady-state responses to MM and exponential envelope AM2/FM stimuli in normal-hearing adults. Int J Audiol. 2007;46:399-406.
- Elberling C, Don M, Cebulla M, Stürzebecher E. Auditory steady-state responses to chirp stimuli based on cochlear traveling wave delay. J Acoust Soc Am. 2007;122:2772-2785.
- Cebulla M, Stürzebecher E, Elberling C. Objective detection of auditory steady-state responses: comparison of one-sample and q-sample tests. J Am Acad Audiol. 2006;17:93-103.
Correspondence can be addressed to HR at HREditor or Douglas L. Beck at .
Citation for this article:
Beck D, Speidel D, Craig J. Developments in Auditory Steady-State Responses (ASSR): 2009 Hearing Review. 2009;16(8):20-27.