Market Research | July/August 2025 Hearing Review
By Bridget Sobek Dobyan, JD, and Thomas A. Powers, PhD
With the twelfth edition of the MarkeTrak study, MarkeTrak 2025 (MT2025) builds upon MarkeTrak 2022 (MT2022) through a series of nationally representative consumer questions. While maintaining continuity with core questions to enable longitudinal analysis, this latest edition expands in response to a shifting market, integrating new data on prescription hearing aids, over-the-counter (OTC) devices, and emerging technologies such as earbuds with hearing improvement features.
Since 1989, the Hearing Industries Association (HIA) has commissioned MarkeTrak, the only major U.S.-based study examining the hearing-impaired market. This research provides insights into the estimated incidence of hearing loss in the United States and adoption rates of hearing aids, cochlear implants, and other hearing devices, among many other topics surrounding demographics, decision making, and sentiment of those with hearing loss.
The following sections highlight key findings from MT2025, offering a first look at emerging trends, shifting consumer behaviors, and meaningful comparisons to prior studies.
Examining Hearing Difficulty
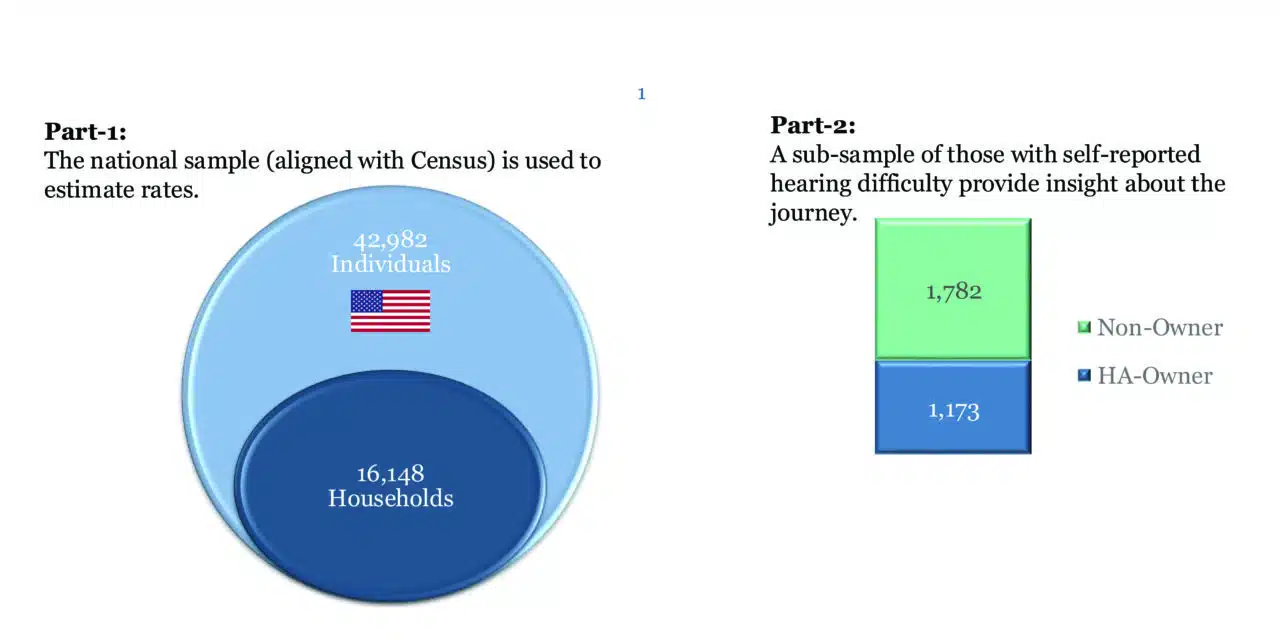
The research methodology for MT2025 closely aligns with the previous online-based system utilized for MT2022, MT10 (2019), and MT9 (2015). This survey was fielded by Az Marketing Research Inc. in October and November of 2024 to reach 16,148 households in the United States, balanced and weighted to key U.S. Census characteristics (Figure 1). From this group, there were 42,982 individuals that completed Part 1 of the survey to estimate rates. A total of 2,955 individuals with self-reported hearing difficulty advanced to Part 2, which provides insights into the hearing health journey. Of the sample, 1,173 respondents are hearing aid owners and 1,782 are non-owners.
Figure 1
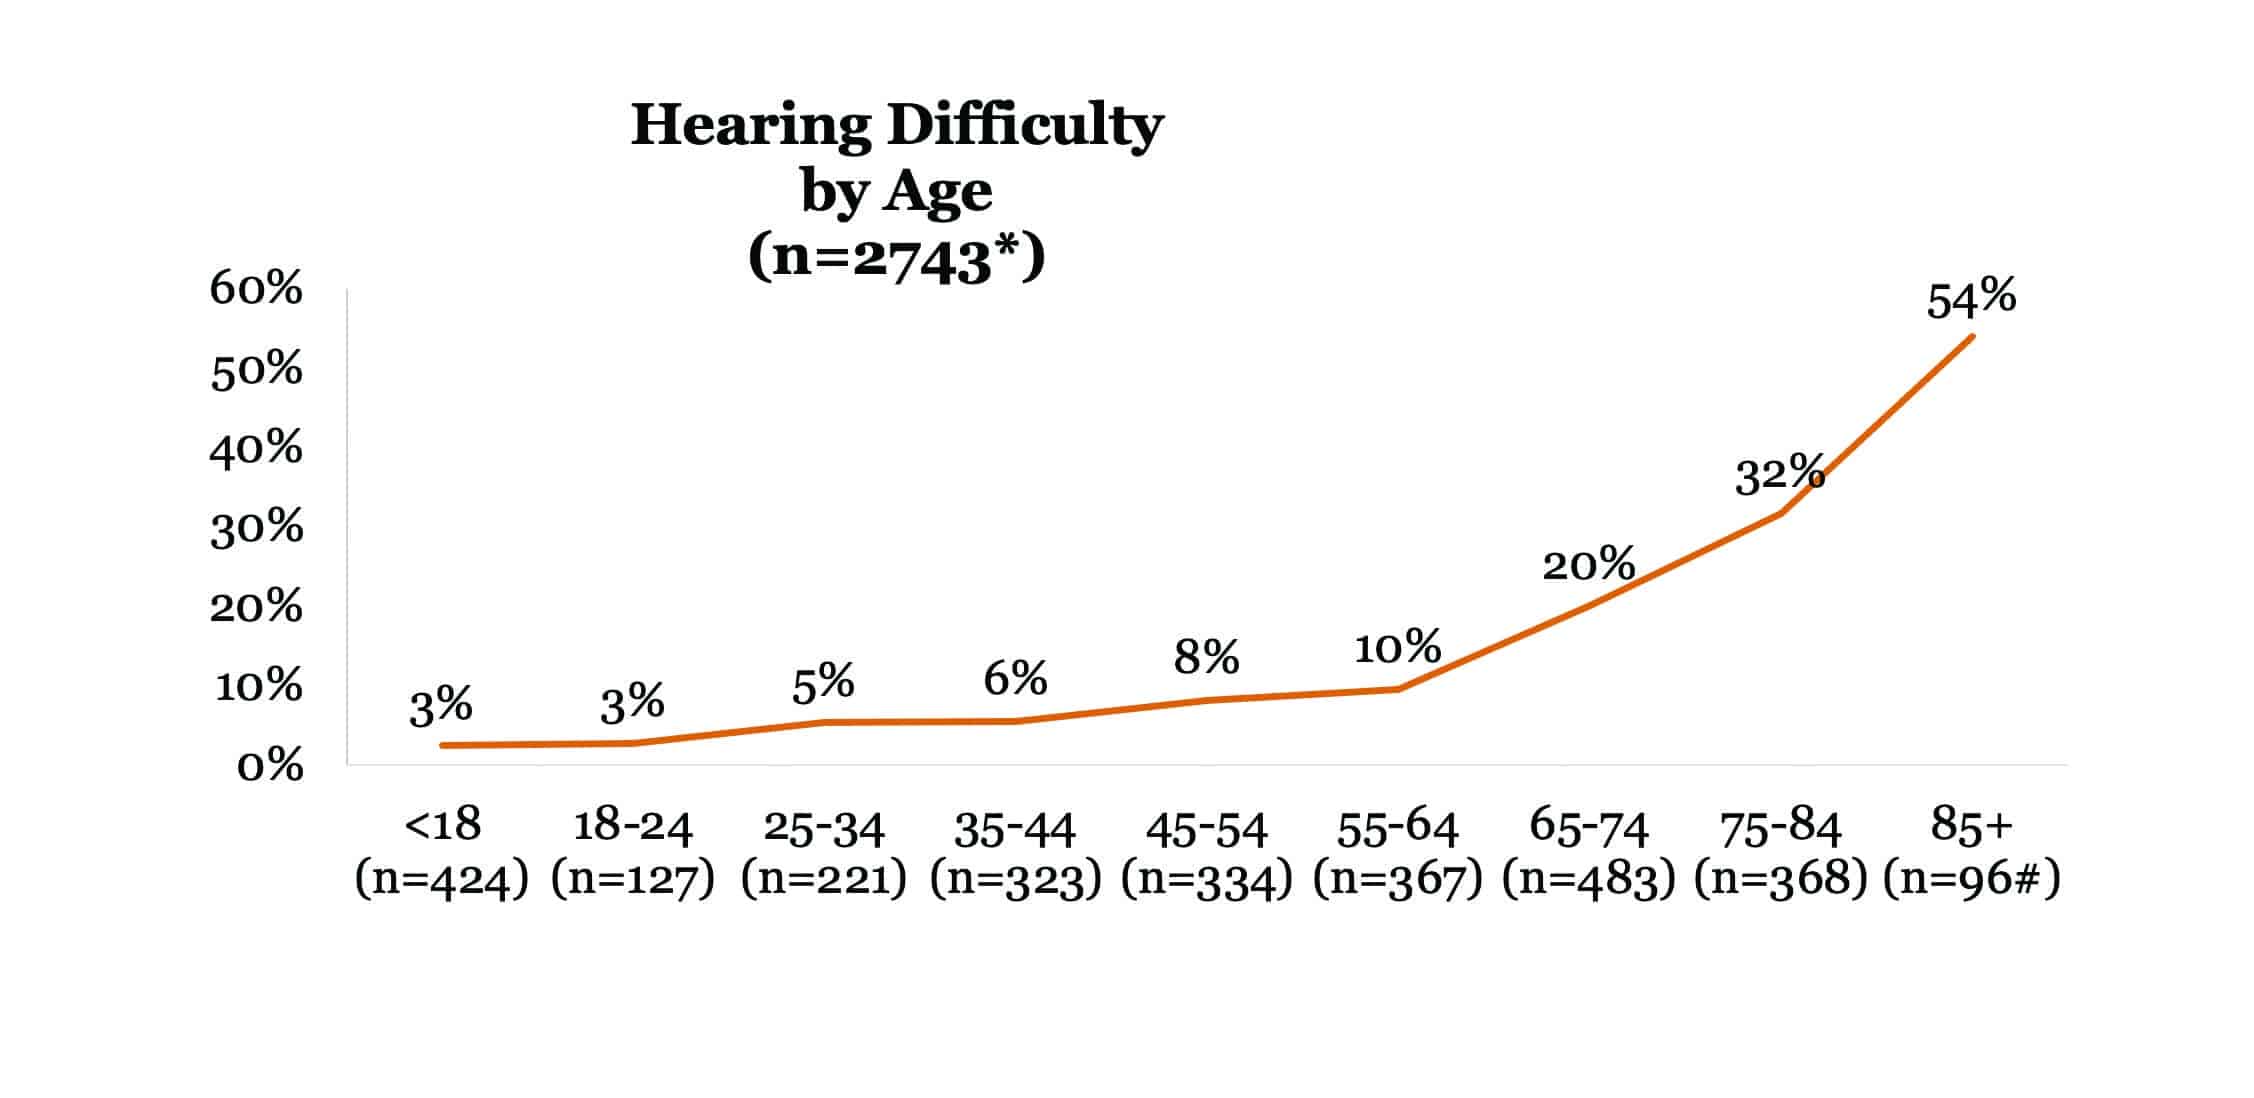
In MT2025, the self-reported hearing difficulty rate dropped to 9.1% after remaining at 10-11% for all MarkeTrak studies since 1989. As shown in Figure 2, the rate of hearing difficulty steadily increases until age 55, when the rate develops a steeper upward trajectory. When compared to rates in MT2022, hearing difficulty decreased from 34.1% to 32% for individuals 75-84 years old, and individuals 85 years of age and older self-reported a hearing difficulty that decreased from 55.7% to 54%. The self-reported hearing difficulty rate decreased among those 25-34 years old (from 6.5% to 5%) and those 35-44 years old (from 7.5% to 6%). The total overall drop in self-reported hearing difficulty rates merits additional study.
Figure 2
The proportion of self-reported individuals with bilateral hearing difficulty increased to 73% from 70% in MT2022 and 72% in MT2019.
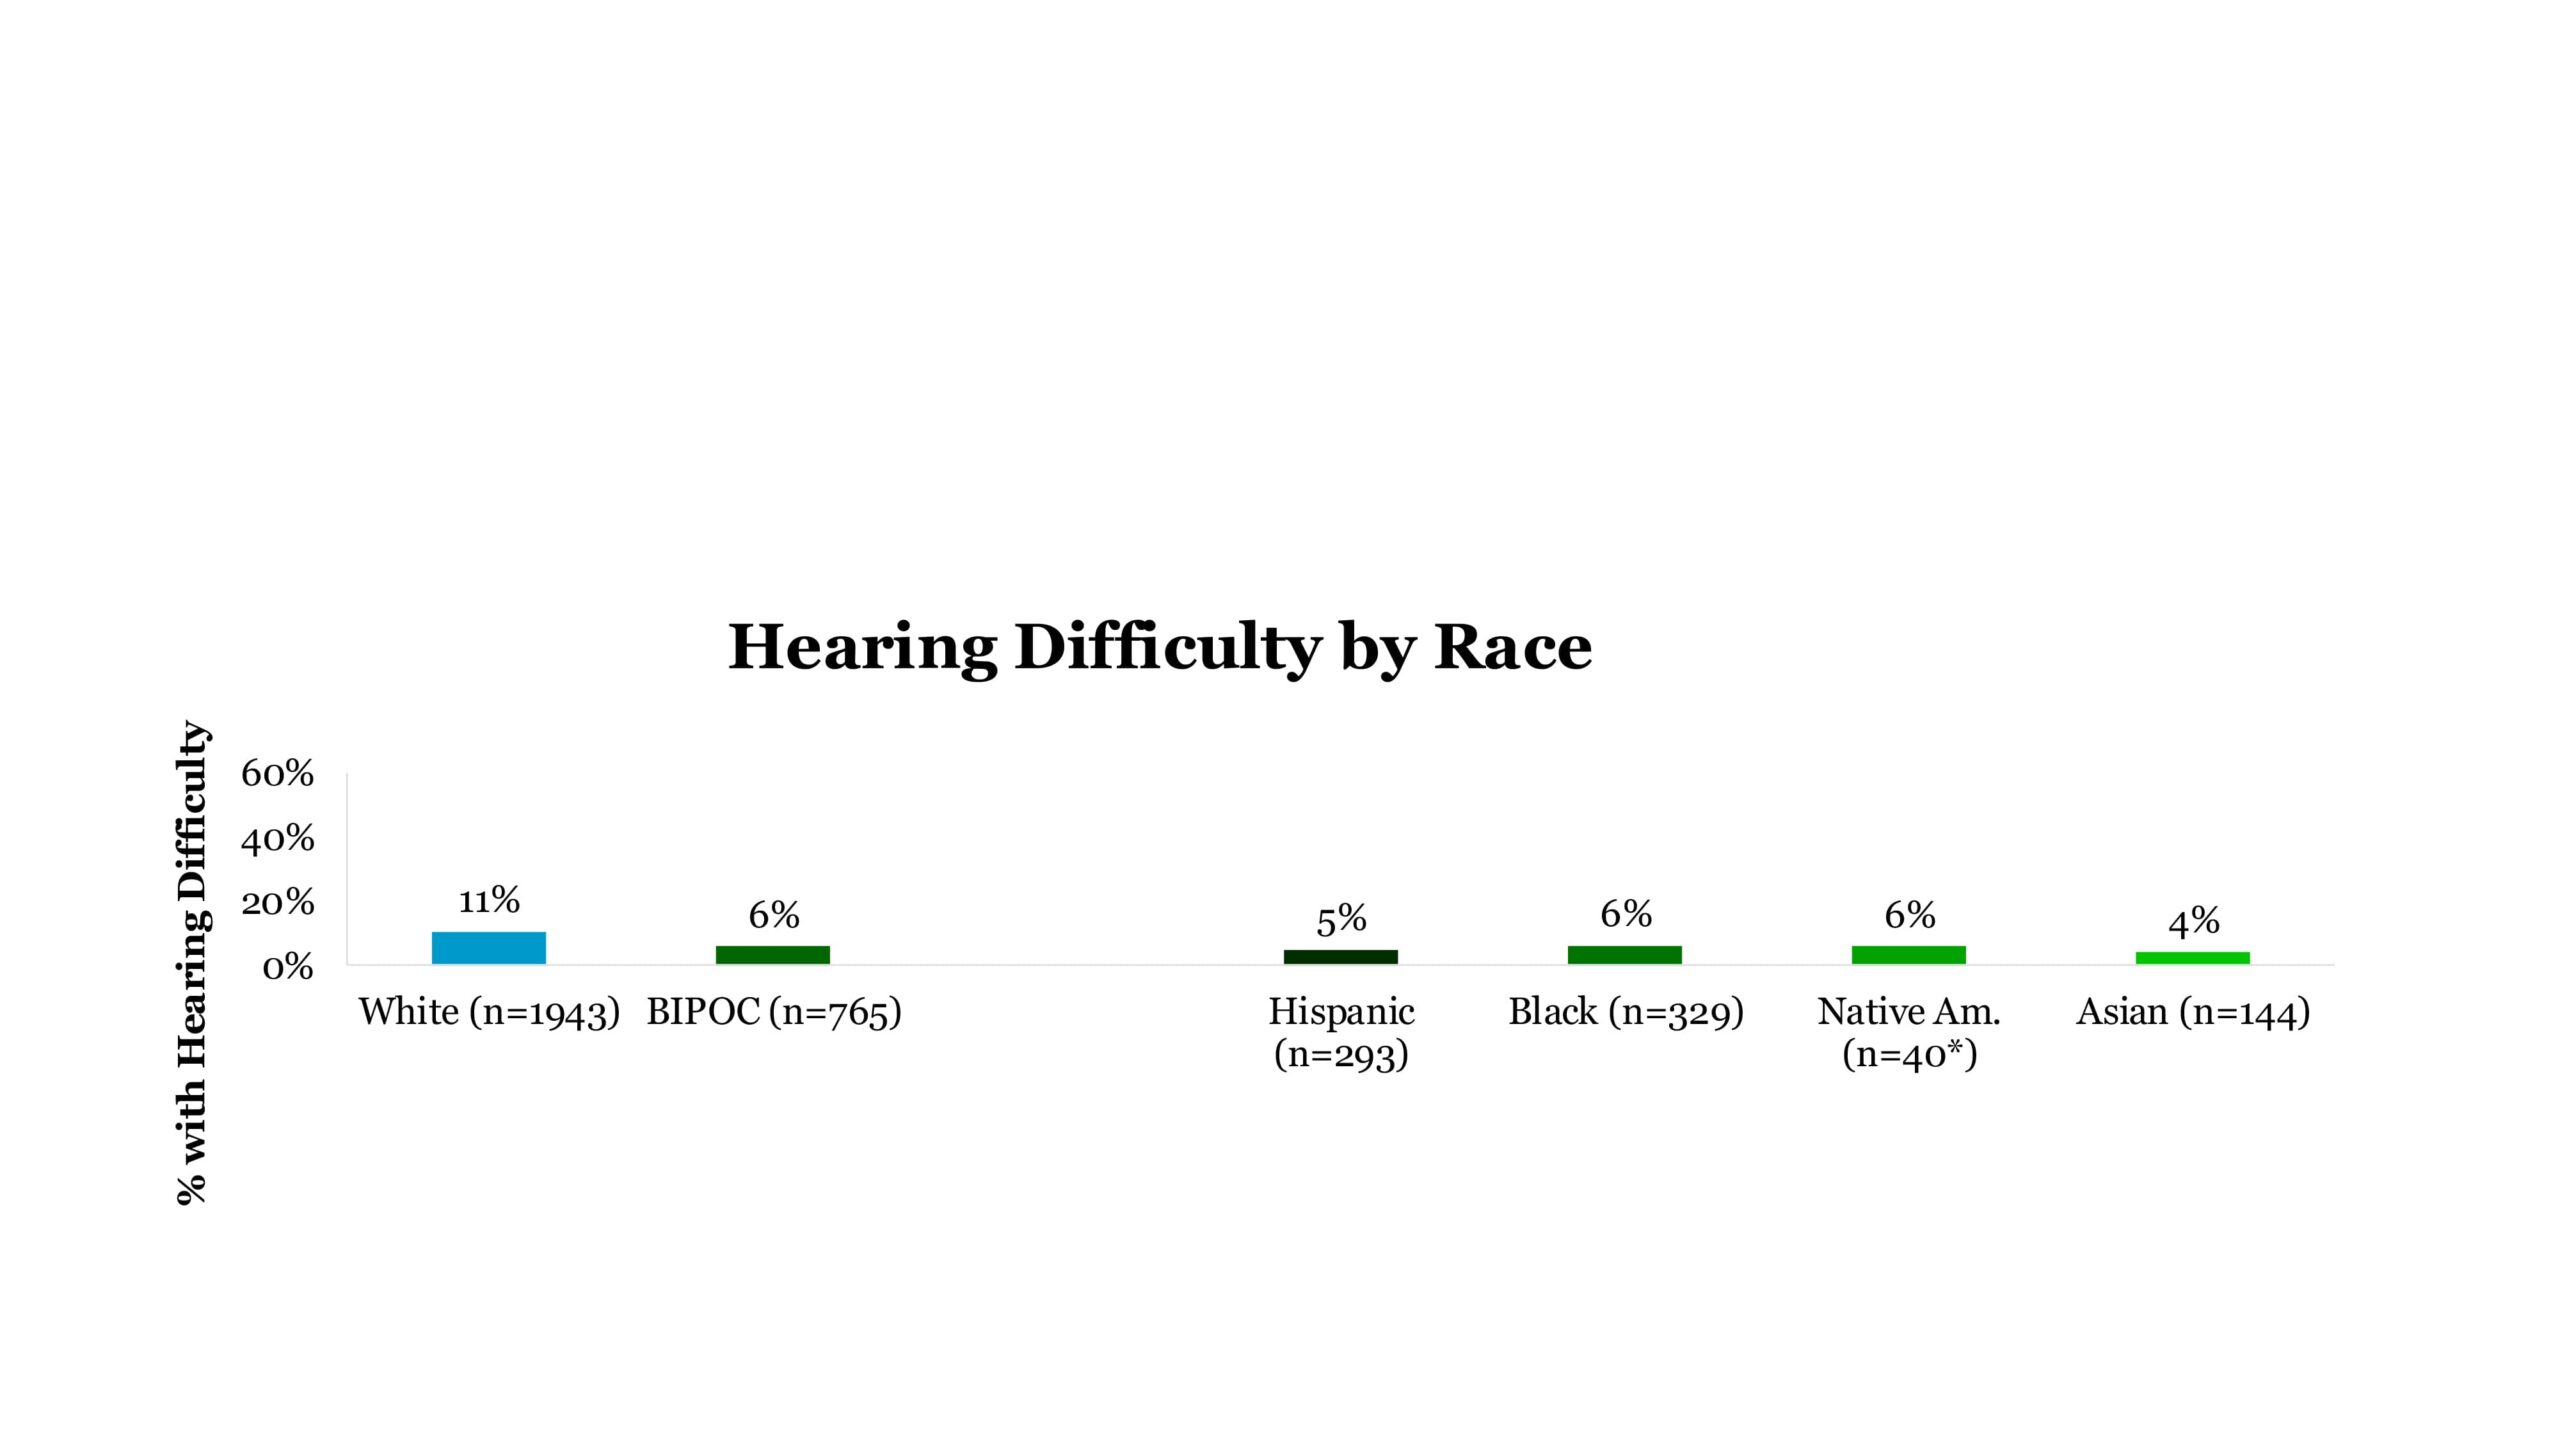
Hearing difficulty rates by gender continue to show higher prevalence in males (12%) than females (7%). Hearing difficulty by race trends along with MT2022 findings, with a disproportionately low rate of self-reported hearing difficulty for the Black, Indigenous, and People of Color (BIPOC) population as compared to those who identify as white (Figure 3). However, within the BIPOC population, rates of hearing difficulty are relatively consistent.
Figure 3
The survey reveals a 2-point increase from MT2022 in hearing tests administered by a professional in the last year (from 37% in 2022 to 39% in MT2025). Of those individuals with hearing difficulty who screened their hearing level on their own, 9% used an online tool (down from 16% in MT2022) and 9% used an app on a smartphone or tablet (down from 13% in MT2022).
To understand the changing marketplace, MT2025 expanded definitions to include prescription (traditional) hearing aids, over-the-counter (OTC) hearing aids, implants, and earbuds with hearing improvement features. The survey found that about four in 10 respondents own a hearing aid (traditional, OTC, or other). When factoring in the implant population, the total adoption rate increases to 43.4%. Just over half (51.3%) of those with hearing difficulty own some kind of hearing device (hearing aid, implant, or earbud with hearing improvement feature). Notably, among hearing aid owners with bilateral loss, the binaural solution rate is 83% (an increase of 12 points from MT2022).
The role of the primary care physician slightly tapered, where 51% of those with self-reported hearing difficulty discussed their hearing with a medical doctor (down from 52% in MT2022); however, the recommendation to get a hearing aid increased to 22% (up from 18% in MT2022). Six in 10 individuals with self-reported hearing difficulty have spoken to a hearing care professional about their loss.
OWNERS OF HEARING DEVICES
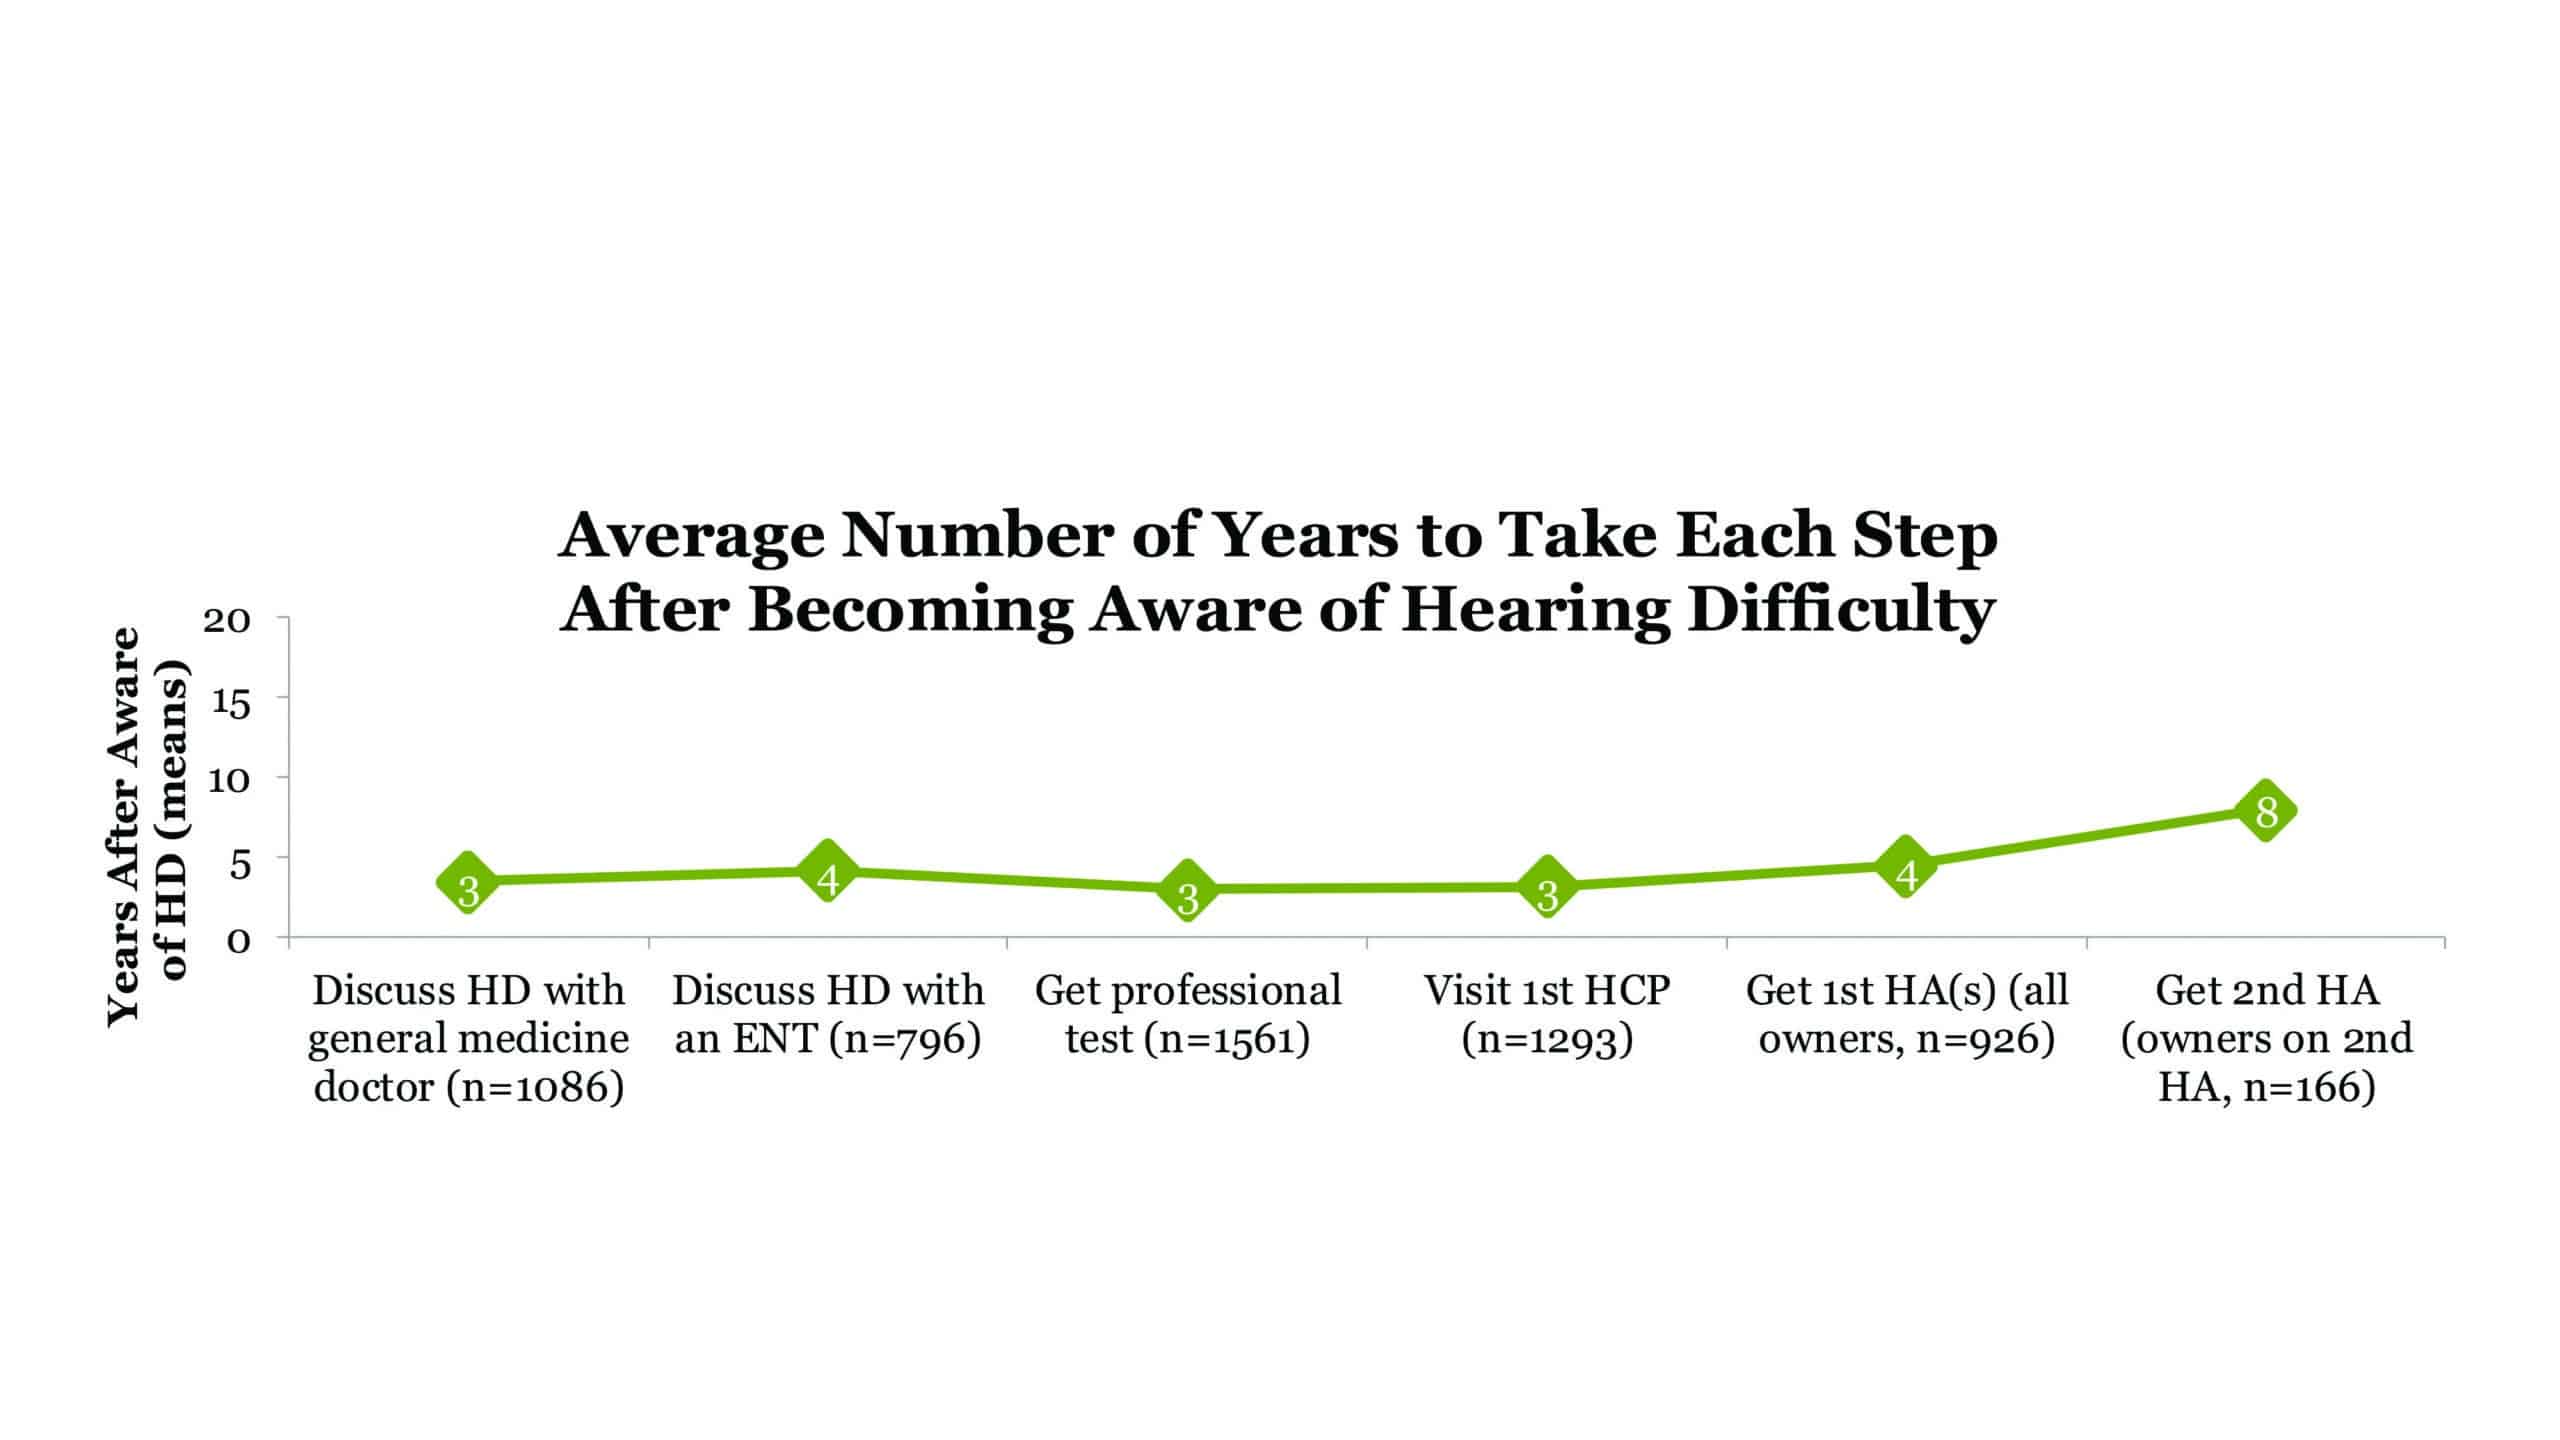
Average Time to Take Action on Hearing Difficulty
Consistent with MT2022, it takes about 4 years for an individual to get a hearing aid after becoming aware of hearing difficulty (Figure 4). The time it takes to discuss hearing difficulty with a general medicine doctor, receive a professional test, and first visit a hearing care professional all decreased from 4 years to 3 years.
Figure 4
First-Time Buyers
A key metric across all MarkeTrak surveys, but particularly relevant in MT2025 given the emergence of the OTC hearing aid category, is the percentage of first-time buyers. MT2015 and MT2019 found that nearly six in 10 individuals were first-time buyers in all hearing aid categories (traditional, OTC, or other). This number dipped in MT2022 (51%) before increasing to 60% in MT2025. In MT2025, 58% of traditional hearing aid owners are first-time buyers while, unsurprisingly, 70% of OTC hearing aid owners are first-time buyers.
OTC hearing aids are, by definition, limited to individuals with self-perceived mild-to-moderate hearing loss. MT2025 reveals that eight in 10 OTC hearing aid owners self-report their hearing loss to be in the mild-to-moderate range. Daily behaviors are somewhat distinct between OTC hearing aid users and traditional hearing aid users, including how often users wear their hearing aids and for how many hours per day. Traditional hearing aid users wear their hearing aids more hours on average per day (9.4 hours) versus OTC users (6.8 hours). Further, the OTC user differs from the traditional (prescription) hearing aid user in that they tend to be younger, working, and BIPOC; individuals that could migrate to the traditional hearing aid category as hearing loss or experience progresses.
Hearing Aid Features
Consumers are increasingly identifying features available with their hearing aids, including rechargeability and volume control. Participants were asked whether their current hearing aids have each feature (Table 1), with 74% reporting volume control (up from 72%) and 69% reporting rechargeability (up from 52%). However, knowledge of features including program button, microphones in noisy situations, and telecoils decreased.
Table 1
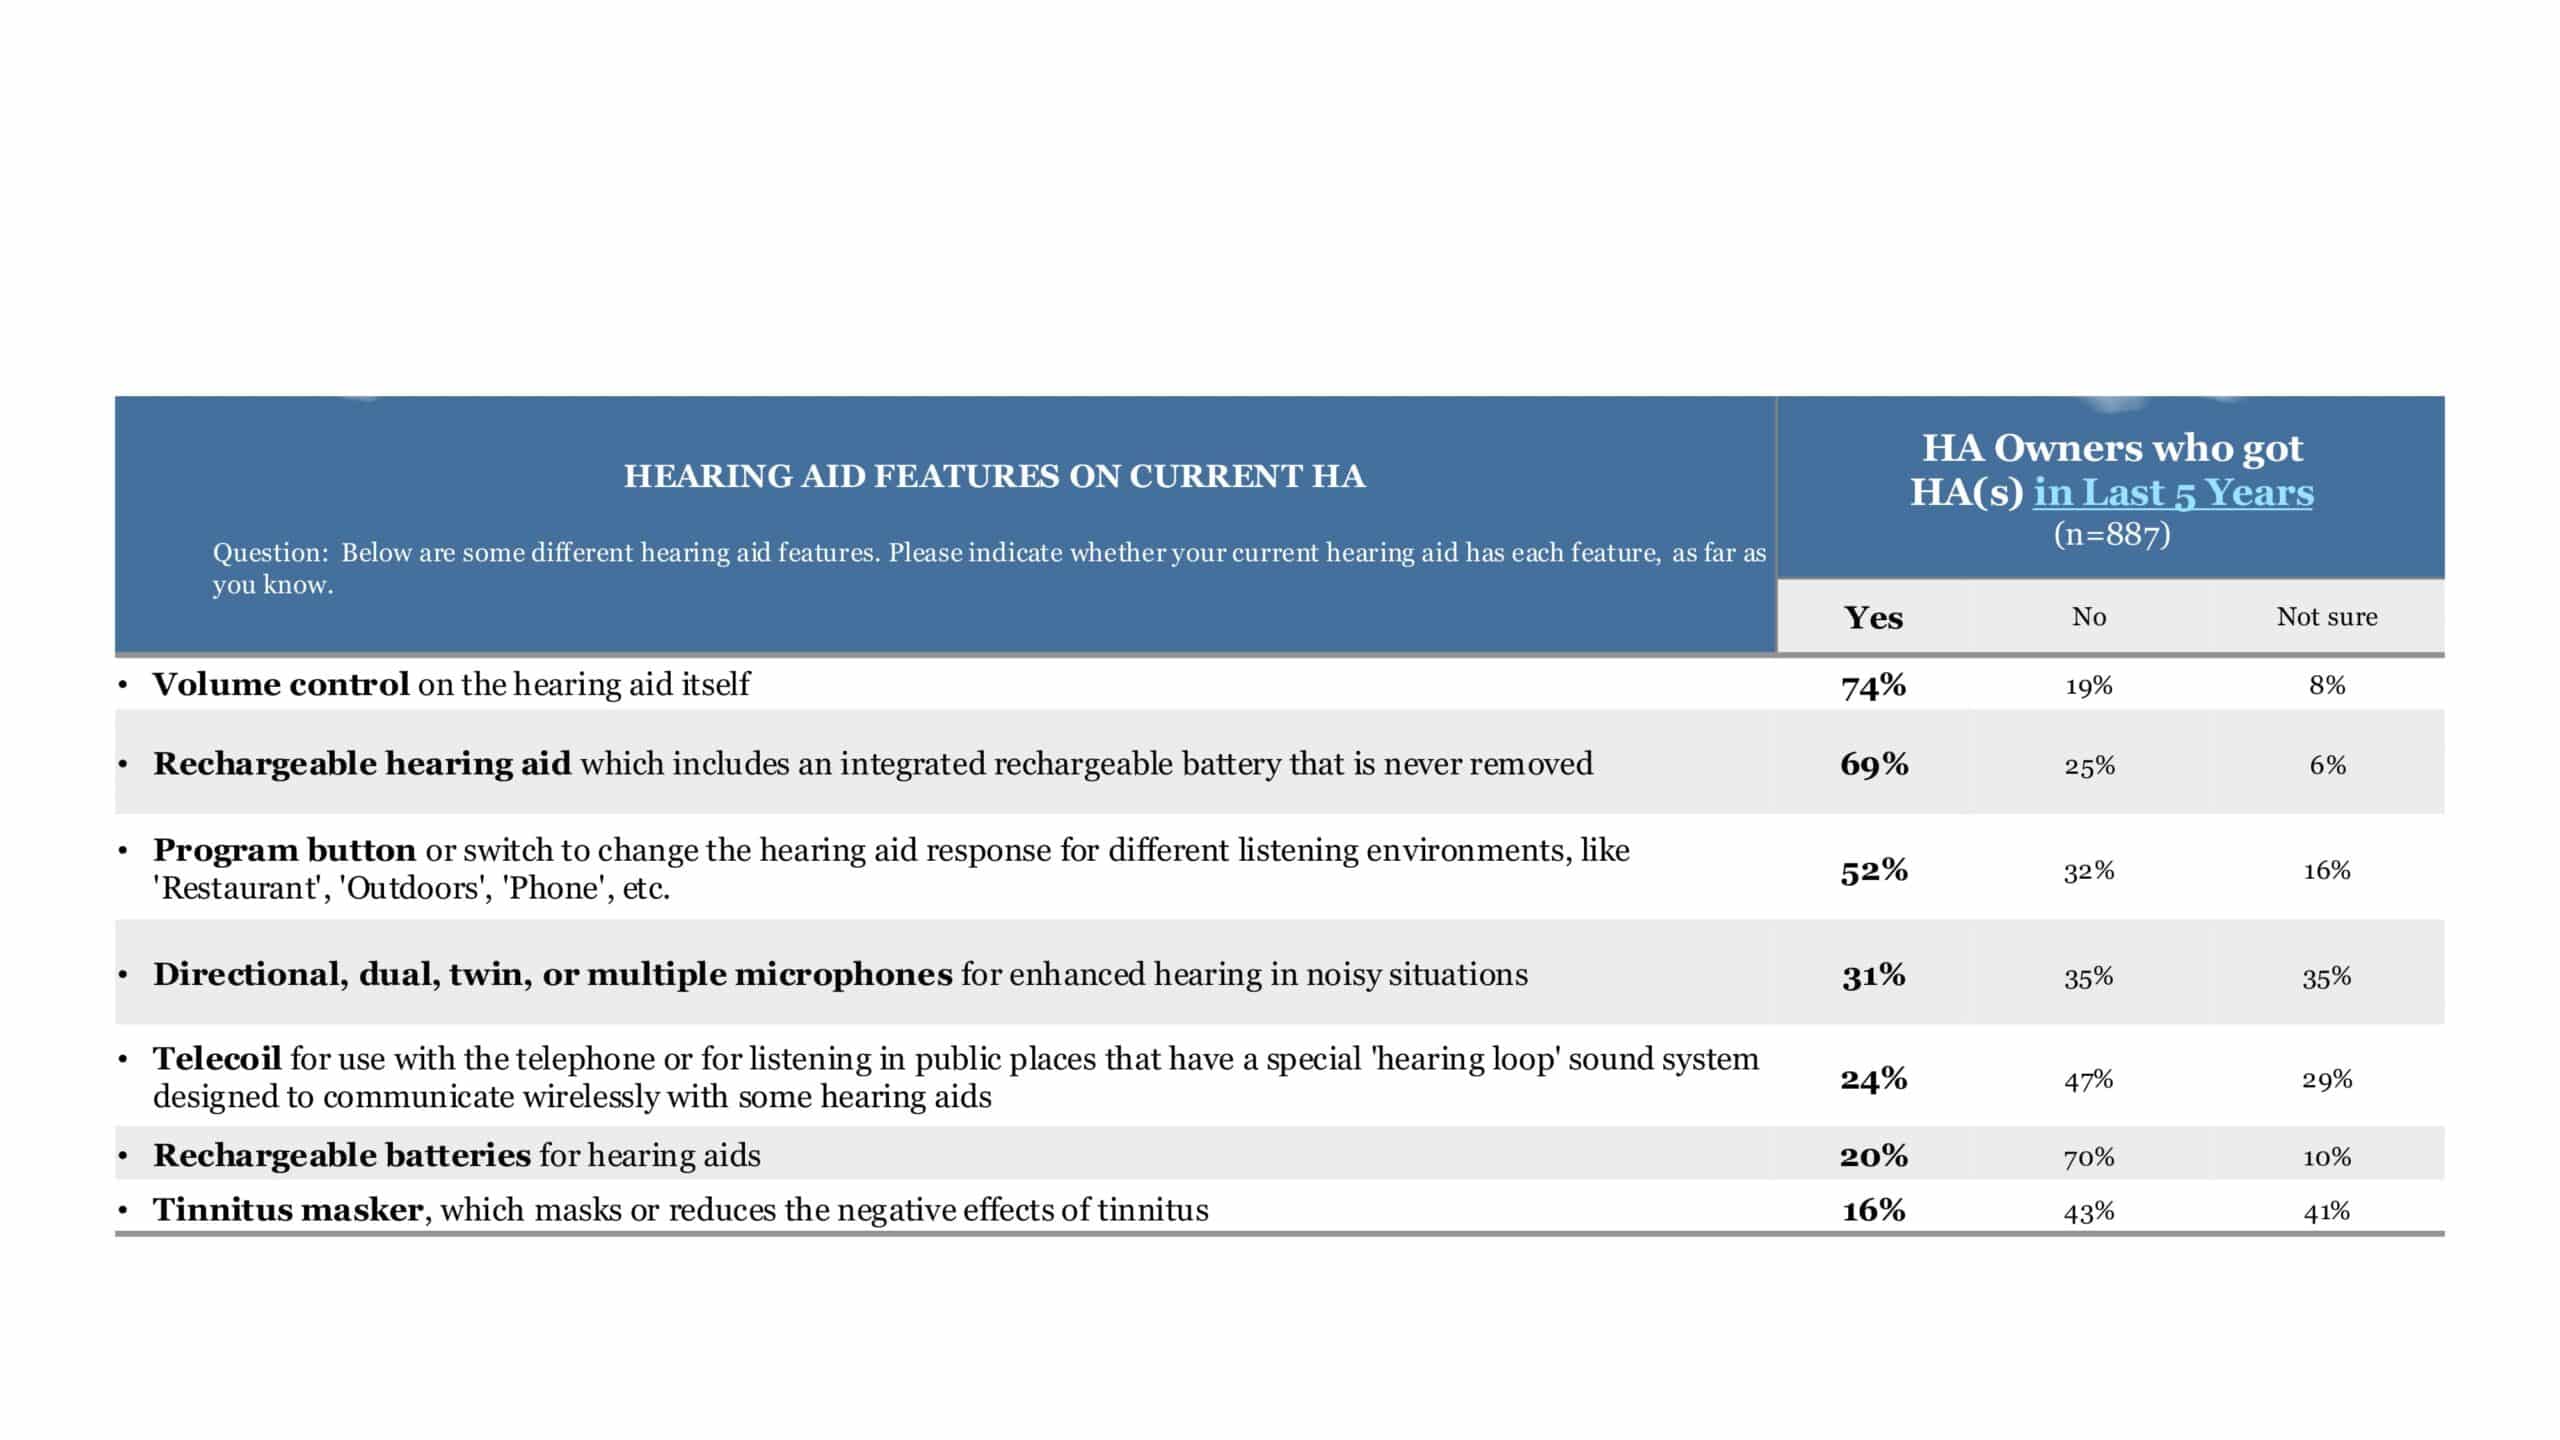
Wireless capability likewise continues to increase, rising from 63% in MT2022 to 70% in MT2025. This net number includes the ability to stream sound from a smartphone directly, the ability to link volume or program changes, and the ability to stream sound using an additional accessory. Additionally, the number of hearing aid users with downloadable apps has increased 10 points since MT2022, resulting in over half (54%) of respondents in MT2025. Of features, the top four most impactful are volume control, rechargeability, downloadable app, and ability to stream from a smartphone.
Device Satisfaction
Consistent with prior waves of MarkeTrak, approximately eight in 10 hearing aid owners are satisfied with their hearing aid, with more traditional owners than OTC owners selecting “very satisfied” with their device. This difference aligns with data revealed in the following section: hearing aid owners who receive assistance from a hearing care professional during the process express more satisfaction than those who do not receive assistance.
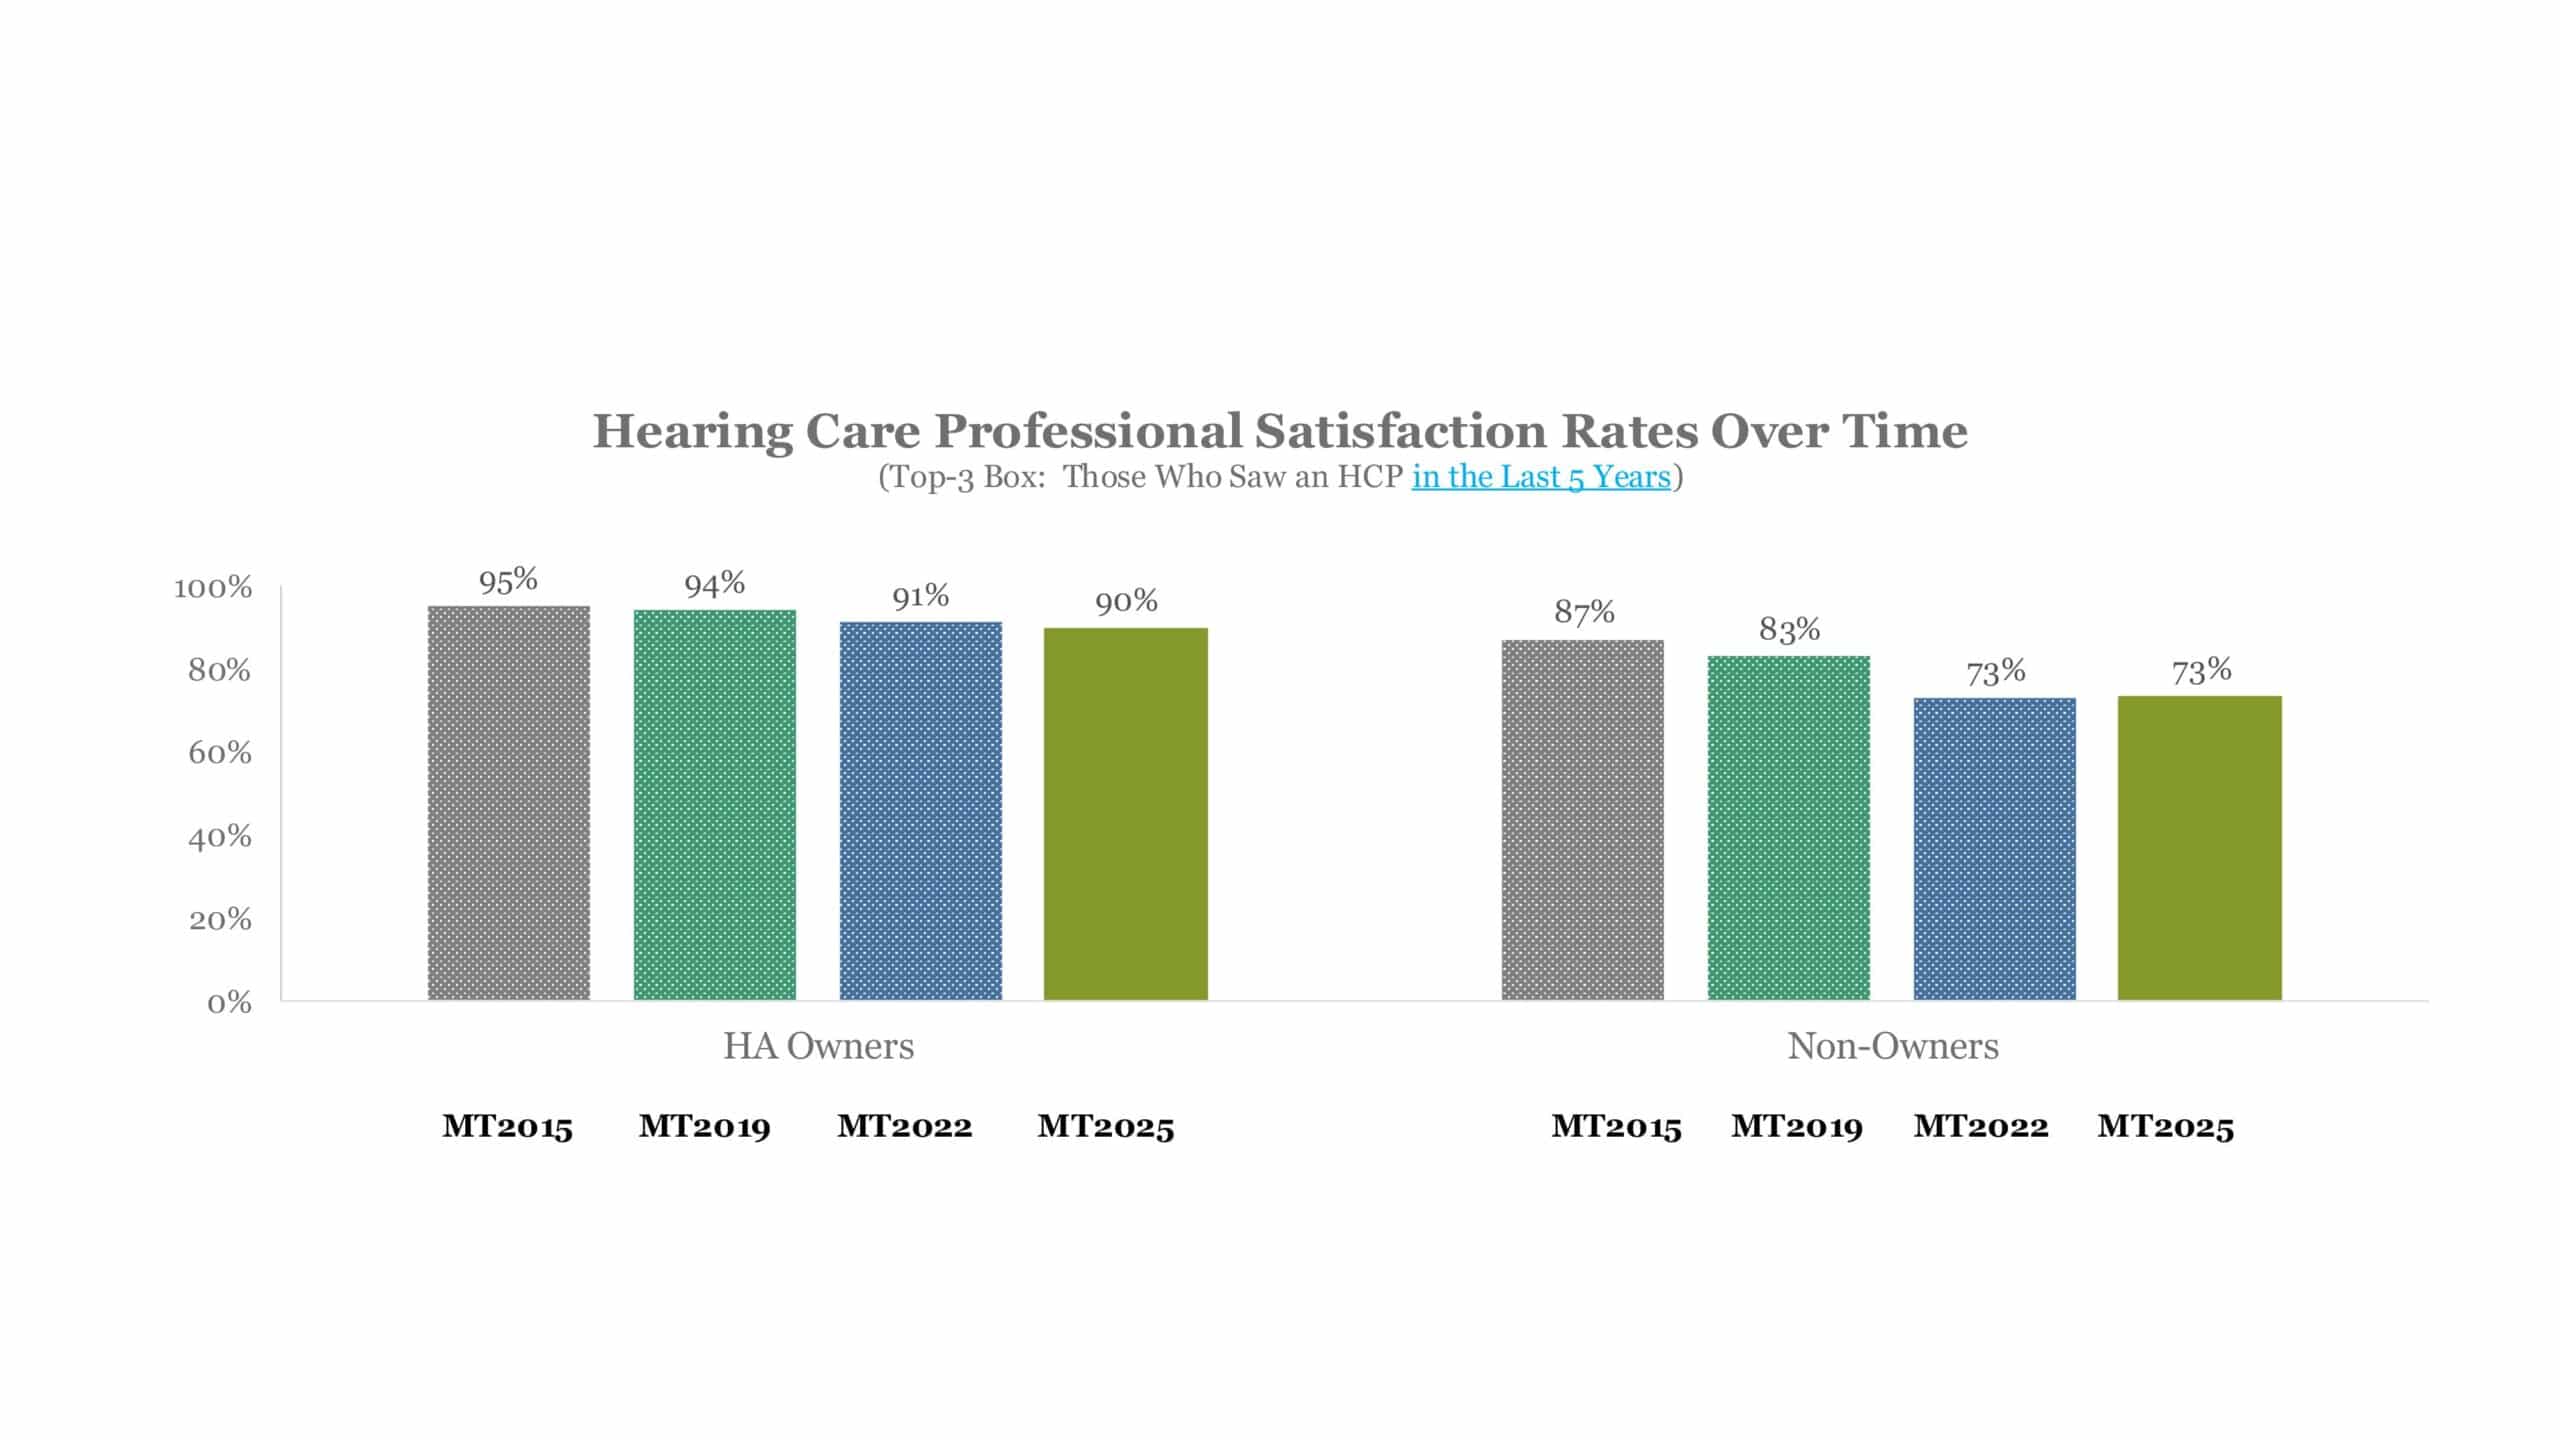
Role of the Hearing Care Professional
Over multiple waves of the MarkeTrak survey, hearing care professionals enjoy a high rate of satisfaction. While slightly down versus MT2022 rates (91%), 90% of current hearing aid owners are satisfied with their HCP (Figure 5). Expert advice, good service and support, and assistance with the hearing aid technology through the fitting, adjustment, and programming processes all positively influence satisfaction rates. The HCP satisfaction rate for non-owners remained consistent with MT2022 at 73%.
Figure 5
NON-OWNERS OF HEARING DEVICES
Primary Reasons for Non-Purchase of Hearing Aids
While the overall adoption rate increased in MT2025, there is still a significant segment of individuals with self-reported hearing difficulty who do not take steps to address hearing loss or use hearing aids. For non-owners who have a recommendation to get a hearing aid, top indicated reasons in MT2025 include that the cost is too high, coverage is not adequate, or they are not ready. Of current hearing aid non-owners, 15% have no plans to ever purchase a hearing aid.
Conclusion
As the first survey conducted after the publication of the final OTC hearing aid rule, MarkeTrak 2025 highlights longitudinal consistencies, market changes, and opportunities for growth and outreach to individuals with hearing loss. Insights into the experiences of owners and non-owners reveal key factors that influence treatment for hearing loss, including the balance of cost, choice and features, impact on health and engagement, and so much more. High device satisfaction with devices underscores the value of current technologies and emphasizes the pivotal role of hearing care professionals in supporting individuals through the process.
MarkeTrak 2025 contains a wealth of data, and additional insights and analysis will be published in the November 2025 issue of Seminars in Hearing, featuring contributions from a range of academic authors and researchers.
The MarkeTrak series continues to provide valuable insights into both consumer behaviors and market trends. The Hearing Industries Association remains committed to this important market survey and serving as the trusted resource for both consumers and professionals in the hearing care journey.
About the Authors:
Bridget Sobek Dobyan, JD, is the executive director of the Hearing Industries Association (HIA), where she leads strategic initiatives and advocacy efforts. She has extensive experience in nonprofit leadership, government affairs, and legislative policy, including roles on Capitol Hill and in state government. Dobyan holds a JD from Michigan State University College of Law and is a member of the State Bar of Michigan and the D.C. Bar.

Thomas A. Powers, PhD, is currently the founder/managing member of Powers Consulting LLC, providing management consulting to the hearing health industry. He began his career as a partner in an audiology private practice, followed by over 35 years in the hearing aid industry. Dr Powers received his B.S. from the State University of New York at Geneseo, and his MA and PhD in Audiology-Hearing Science from Ohio University. He is a licensed audiologist in New Jersey.
Citation for this article: Sobek Dobyan B, Powers TA. MarkeTrak 2025: Hearing Care in the Era of OTCs and Wearables. Hearing Review. 2025;32(4):8-14.
