During 2003, the average hearing care professional saw the percentage of digital aids dispensed in their office rise to 75%; they saw little or no growth in unit volume; they saw the average price of hearing aids go up only slightly (3.7%), with digital prices (in many cases) going down substantially; and they have relatively high expectations for both unit gains and revenue growth in 2004.
These are a few of the results of the 2004 HR Dispenser Survey which asked dispensing audiologists (DA) and hearing instrument specialists (HIS) about their business/practice activities in 2003. This year’s survey was sent randomly to 750 dispensing offices that receive The Hearing Review magazine, and the survey mailing was weighted by both state dispensing activity (as reported by the Hearing Industries Association1) and estimated dispensing activity by profession (as estimated by HR’s mailing list and database). About one-fifth (19.4%) of the questionnaires were returned (Figure 1), representing 141 hearing care offices/practices in 47 states, the District of Columbia, and Puerto Rico.
|
About this year’s survey…
Figure 1. Survey respondents In March 2004, The Hearing Review (HR) mailed a 3-page questionnaire to 750 dispensing professionals whose names were chosen at random from the HR mailing list. Dispensing audiologists (DA), hearing instrument specialists (HIS), and medical doctors were included. A total of 19% of the questionnaires were completed and returned to HR (HIS 40% and DA 60%). Returned questionnaires were received from every state except Alabama, Arkansas, and Idaho; 99% of the respondents stated that they had controlling interests in the practices/businesses, with 89% owners and 10% co-owners (1% of respondents were employees of the practice/business). |
Survey Respondents
Respondents to this year’s survey were overwhelmingly the owners of the offices/practices (89%, HIS 91%; DA 87%) and had dispensed hearing aids for more than 20 years (Figure 2). Of the dispensing offices that took part in this year’s survey, 60% were run by dispensing audiologists and 40% were run by hearing instrument specialists, which roughly corresponds to the US dispensing distribution by profession, according to HR estimates. Slightly more than half (59%) of survey respondents were male, and most respondents held a postgraduate degree (65%) or a college diploma (11%).
There were some important contrasts between hearing instrument specialists and dispensing audiologists, with gender and age being the most apparent. The average dispensing audiologist was a female (56%) between ages 41-60 (68%), while the average hearing instrument specialist was a male (81%) between the ages of 51-70 (64%).
Office/practice owners are getting older. Owners of dispensing businesses are getting older, which has been a frequent observation—and possibly even a lingering concern—among industry observers. Ten years ago, the HR Dispenser Survey2 showed that 55% of hearing instruments specialist and 25% of dispensing audiologist practices were owned by dispensers age 50 years or older. In 2003, 73% of the hearing instrument specialists and 50% of the dispensing audiologists are age 50+. In total, 3-in-5 (60%) dispensing offices have owners who are older than age 50. One-fifth of the owners in this year’s survey are age 61 or older (21%; HIS 30%, DA 16%).
While its quite evident that many dispensing professionals continue to work into their “retirement years,” there may be cause for concern when viewing these numbers. Are there enough new dispensing professionals entering the field to replace those who leave it? A related statistic might be found in the number of dispensing professionals who plan on hiring professional staff in the near future (Figure 3). Half of all dispensing offices (50%, HIS 39%, DA 57%) indicate that they want to hire an audiologist or hearing instrument specialist within the next 3 years, while almost a quarter (23%) of the offices want to hire one within the next year.
The aging of owners of dispensing offices, of course, has its pros and cons. On the “pro” side, with age comes experience and a wealth of practical knowledge. The average 2004 HR Survey respondent has been dispensing hearing aids for more than 2 decades (20.7 years; HIS 20.9 years, DA 20.6 years). This brings considerable expertise to the table, as well as stability to the dispensing field. On the “con” side, some older dispensers may be more reluctant to embrace new hearing testing and fitting technology or radically alter their businesses to new market conditions.
AuD gaining rapidly. Relative to education and certifications, about 2-in-5 (39%) hearing instrument specialists had attained college and postgraduate degrees; 64% held BC-HIS certification, 15% held ACA certification, and 11% had indicated other credentials. Dispensing audiologists, by definition, hold masters degrees. Eleven percent of audiologists responding to this survey held PhDs, 80% held the CCC-A certification, 28% held the ABA certification, and 6% held either the BC-HIS or ACA certification (6% indicated other credentials). A full 30% of dispensing audiologists had attained the AuD degree—a fairly impressive percentage for the relatively new credential.
State licensure was about the same between the two dispensing groups (87%, HIS 84%, DA 89%), and depended only on whether the dispensers’ states required or did not require licensure.
A Look Inside the Nation’s Dispensing Offices
Businesses, staffing, and locations of offices remain relatively static. In terms of overall size of dispensing offices, this year’s HR Dispenser Survey is about the same as last year (Figure 4), with the exception that there are slightly more businesses with 2 offices (35% compared to 27% last year). In fact, two of the largest hearing instrument specialist offices ever encountered in an HR survey made their way into this year’s statistics, with both dispensing 200 or more hearing aids per month. Editor’s note: This doesn’t affect survey numbers significantly in most cases; however, this fact should be kept in mind when looking at the averages for owners’ compensation (Figure 16) and for hearing aid units dispensed (Figure 24). In these cases, HR has provided both the average and median figures for readers.
The largest percentage of dispensing professionals had only one office (45%, HIS 40%, DA 48%). About one-third (35%) of dispensing businesses maintained 2 offices (HIS 33%, DA 36%), 11% had 3 offices (HIS 11%, DA 11%), 5% had 4-5 offices (HIS 9%, DA 3%), and 4% had 6 offices or more (HIS 7%, DA 2%). The majority of these offices were located in a private practice setting (68%, HIS 60%, DA 74%). If not in a private practice setting, then hearing instrument specialists’ offices were more likely to be located in a retail setting (19%, HIS 33%, DA 9%), while dispensing audiologists’ offices were more likely to be located in a medical setting (10%, HIS 5%, DA 14%). Only 3% of all the offices were located in a physicians’ office (HIS 2%, DA 3%).
Half of all dispensing offices were located in medium-size cities of 50,000 to 500,000 people (53%, HIS 55%, DA 52%). while the remaining half of the offices were split evenly between smaller populations under 50,000 people (24%, HIS 23%, DA 24%), and larger populations over a half-million people (23%, HIS 22%, DA 24%). In previous surveys, hearing instrument specialists’ offices tended to have greater numbers in areas of smaller populations, while dispensing audiologists’ offices tended to be more concentrated in larger metropolitan areas.
The typical office is staffed by an average of 2 dispensing professionals (HIS 2.1 hearing instrument specialists per office, DA 1.8 audiologists per office); however, the mean number of professional staff is 1 (Figure 5). In any given sample of 10 offices owned by hearing instrument specialists, you are likely to find 3 dispensing audiologists and 1 MD; in any sample of 10 offices owned by audiologists, you are likely to find 3 hearing instrument specialists and 1 MD. Altogether, 1 in 5 (22.4%) offices in the US have dispensing audiologists and hearing instrument specialists working together: 23.5% of audiology offices employ hearing instrument specialists, and 20.8% of hearing instrument specialist offices employ audiologists (Figure 6).
Some return to traditional manufacturer networks; number of hearing aid brands carried decreases. Network dispensing and marketing/buying groups have become popular among dispensing professionals, as dispensers try to gain competitive advantages in both pricing and marketing. Overall, about 2 in 5 dispensing offices do not belong to any network or buying group (42%, HIS 44%, DA 41%). National independent networks and buying groups (eg, AHAA, Marcon, AudNet, etc) are the system of choice among about one-third (36%) of dispensing audiologists, while only 15% of hearing instrument specialists participate in these types of networks. Dispensing offices that are actually owned by a retail network represented less than 1% of survey responses (HIS 1%, DA 0%).
About one-fourth (26%) of hearing instrument specialists’ offices belonged to traditional manufacturer networks (eg, Beltone, Audibel, Miracle Ear, etc), while only 7% of dispensing audiologists belonged to these networks. These statistics show a trend of hearing instrument specialists returning to traditional manufacturer networks. Reflecting this same trend is Figure 8 which shows there was a slight increase during 2003 in the number of hearing instrument specialists who dispensed mostly one brand of hearing aid (15% in 2003 compared to 11% in 2002). This comes after a fairly dramatic decline in single-brand dispensing during the period of 1999-2000 (falling from 22% to 9%), as shown in Figure 9.
Additionally, Figure 9 suggests that those who exited single-brand dispensing during the 1999-2000 period moved into the 2-4 brand category. This continuing trend toward larger numbers of brands can also be observed from 2000-2001 when the percentage of 2-4 brand dispensers declined sharply (from 55% to 37%) while the percentage of 5-6 brand dispensers increased by a similar amount (from 19% to 34%). The dispensing trend since 2001 has been to narrow the choice of brands, and half of all dispensing offices now carry only 2-4 brands (46%, HIS 41%, DA 51%). About one-third of offices offer 5-6 brands (33%, HIS 23%, DA 39%). Only 1 in 10 offices carry 7-10 brands of hearing aids (10%, HIS 15%, DA 6%), fewer still carry 11+ brands (5%, HIS 6%, DA 4%).
The movement toward larger numbers of brands followed by a narrowing of brand selection could also reflect the increase in second- and third-generation DSP offerings from 1999 to the present. As new models of digital hearing aids become available, dispensing professionals may have taken on these new devices then gradually culled their brand selection to simplify the hearing aid selection and fitting process while taking advantage of volume discounts.
Regardless of the number of brands offered in a typical practice, 72% of all the hearing aids dispensed come from the most popular brand (Figure 10). This shows that the tendency among dispensing professionals is to rely on one brand for about 3 out of 4 patients. Hearing instrument specialists dispense 78% of their hearing aids from their most popular brand, while 68% of aids dispensed by audiologists come from their most-used brand.
Revenue centers remain the same, while gross revenues and profits rise slightly. Despite all the changes in the industry, sources of gross revenues have not changed substantially in the last 10 years. Two-thirds of dispensing audiologists’ gross revenues (66%) and three-quarters of hearing instrument specialists’ gross revenues (77%) come from the sale of hearing instruments (Figure 11). The key difference between the two dispensing groups is that dispensing audiologists derive 15% of their gross revenues from audiological services compared to only 1% for hearing instrument specialists. Hearing instrument repairs and battery sales continue to play an important role in the livelihood of a dispensing business, accounting for 8% and 4% of gross revenues, respectively. Other sources of revenue include earplugs/swimplugs and hearing protection (3%) and assistive devices (2%).
The last two HR Dispenser Surveys indicate that gross revenues have increased for a number of dispensing offices (Figure 12). In 2002-2003, 30%-34% of offices reported gross revenues of $251,000-$500,000, compared to only 25-27% of offices in 2000-2001. Likewise, fewer offices reported revenues below $250,000 in 2002-2003 than in 2001-2002. The percentage of offices with revenues exceeding a half-million dollars has similarly increased during the last 2 years (21% in 2002-2003 compared to 2-10% in 2000-2001). However, more than half (56%) of the dispensing offices responding to the HR survey reported gross revenues between $101,000 and $500,000, which isn’t radically different than the last 5 years; it’s just that some dispensing professionals are moving away from lower revenue levels. This is likely to be due to the rapid acceptance and market dominance of the more expensive digital hearing aids (discussed later).
When asked if their gross revenues increased or decreased during 2003, more than half (53%) of dispensing professionals responded that their revenues increased by an average of 13% (Figure 13). About 1 in 5 (16%) reported that their revenues decreased by an average of 10%, while 1 in 3 (31%) said their revenues remained the same as 2002 levels. Gains and losses in gross revenue were fairly consistent when comparing the dispensing professions. Slightly more dispensing audiologists reported gains (55%, average of 12%) compared to hearing instrument specialists (51%, by an average of 13%). Nearly one-third (31%) of all dispensers reported no change in gross revenues.
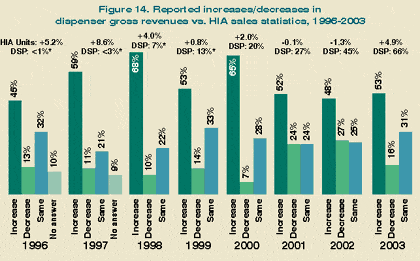
Figure 14 shows the reported increases/decreases in gross revenue as reported by all survey respondents from 1996-2003 contrasted with the industry unit gains/losses and the DSP market share (at top of graph), as reported by HIA.1 It can be seen that, in the years of positive unit sales growth, fewer than 16% of dispensers reported decreases in gross revenues. Along with higher unit volumes, the popularity of digital hearing aids (and their higher prices) have almost certainly influenced the revenue picture—although it should be pointed out that the average price of DSP aids has leveled off, and even decreased in cases, in more recent years (see pricing history in Figures 32-34). The 2003 statistics show that there has been an improvement in revenues over 2001-2002 figures when about one-quarter (24%-27%) of dispensing professionals reported that their revenues decreased and about one-half (48%-52%) said their revenues increased.
Despite this good news, the statistics on reported net profits are a mixed bag (Figure 15). While it appears that some dispensing businesses saw profits rise slightly—with percentages increasing in the $26,000-50,000 and $101,000-250,000 levels—it also appears that fewer businesses saw profits exceeding $250,000.
Employee and owner salaries: In 2003, the median salary of a dispensing audiologist employee ranged from $50,000-$75,000, and the median salary of a hearing instrument specialist employee ranged from $32,500-$60,000, depending on the practice setting (Figure 16). Average salaries for these same professionals ranged from $50,583-$60,200 and $38,486-$54,308, respectively. Sixty percent of dispensing offices pay their staff through fixed salaries (HIS 46%, DA 69%), while 30% pay through salary-plus-commission arrangements (HIS 31%, DA 30%). Eleven percent of offices pay their staff by commission-only (HIS 23%, DA 4%), and only 5% pay by commissions-plus-expenses (HIS 5%, DA 4%). (Note: there were multiple responses on this question, so percentages do not add up to 100%). Due to an increased focus on ethics from all professional organizations, the method of compensation has come under increased scrutiny, with most advocating for the use of fixed salaries in an effort to eliminate any real or perceived conflict of interest relative to dispensing products to patients/clients.
Figure 16 also shows that owners of dispensing practices had mean declared salaries of $80,000 (HIS 75,000, DA $81,000). As mentioned earlier, this year’s survey contained 2 unusually large businesses owned by hearing instrument specialists, and these affected the average salary figures for owners. Thus, for this particular survey, median salaries are more representative of owners’ compensation.
Hearing Aid Consumers
Alarmingly low first-time users, but statistics rise for first time in 4 years. One of the most worrisome statistics in the hearing care field is the small—and shrinking—percentage of first-time clients: those consumers who have never previously purchased a hearing instrument. In 2003, first-time clients in hearing care offices increased to 43% from 41% in 2002 (Figure 17). While this change is hardly impressive, it does represent the first time in 4 years that the percentage has not decreased or stayed the same. Both hearing instrument specialists (41% of clients were first-timers) and dispensing audiologists (44%) reported greater numbers of first-time clients.
First time users of hearing instruments have fallen precipitously since the late-1980s (Figure 18) when they constituted more than three-quarters of the purchasers of hearing aids. Looking at it another way, 57% of the clients in 2003 who purchased a hearing aid already possessed one. If this is the case, and all factors are assumed to be equal relative to new and previous purchasers of hearing aids (ie, binaural vs monaural purchase rates, etc), only 859,000 of the approximately 2 million1 hearing aids dispensed in the United States in 2003 went to first-time users. When accounting for binaural usage (77% of all aids were binaurally fit in 2003, see Figure 26), there were less than 331,000 first-time clients last year—an alarmingly low number.
Of those first-time clients who came into an office seeking hearing help, dispensing professionals report that 16% (HIS 10%, DA 19%) were deemed not to be candidates for hearing aids (Figure 17).
Dispensing professionals report that 70% of their patients come from either word-of-mouth referrals of customers (41%, HIS 45%, DA 39%) or advertising (29%, HIS 39%, DA 21%). Medical referrals by a physician are the second-largest source for new customers in offices owned by dispensing audiologists (28%), but account for only 6% of new clients in offices owned by hearing instrument specialists. Managed care and HMOs (5%, HIS 4%, DA 7%), manufacturers and dispensing networks (2%, HIS 3%, DA 2%), and “other” customer sources (3%, HIS 3%, DA 3%) round out the field relative to where dispensing professionals obtain new clients.
Serving older people with a fair amount of diversity. Patient age has not changed significantly in the last 5-10 years, according to the HR survey, with dispensing audiologists continuing to serve a slightly younger population than hearing instrument specialists. Three-quarters of the patients seen in a dispensing office are either between the ages of 65-84 (62%, HIS 66%, DA 54%) or age 85+ (13%, HIS 17%, DA 12%). Clients ages 45-65 constitute 15% of those seen in an office (HIS 14%, DA 19%), while those clients ages 30-44 make up 5% of the clientele in a typical office. Young adults ages 18-29 (HIS 1%, DA 3%) and children ages 18 and under (HIS 0%, DA 4%) constitute 2% of the client population.
For the first time, HR asked respondents about the ethnicity of clients (Figure 19). It has been a general observation that the dispensing field appears to be lacking in people of color, and this may result in under-serving certain ethnic populations. The HR Survey indicates that about 86% of all clients are white/Caucasian (HIS 88%, DA 84%), 6% are black/African American, 5% are Hispanic (HIS 4%, DA 5%), 2% are Asian (HIS 3%, DA 2%), and 1% are Native American (HIS 1%, DA 2%). When considering people ages 55 and older, the US population is 82.5% white, 8.6% black, 5.9% Hispanic, 2.5% Asian, and 0.5% Native American.13 These numbers appear to indicate that—while the hearing care field could do better in attracting patients of color—dispensing professionals are reaching a more diverse population than what might have been feared.
Fitting more mild losses. In the last 5 years, there has been a gradual trend toward fitting milder hearing losses (<40 dB HL). Whereas patients with milder losses made up 17-21% in the 3 years from 1998-2000, they have made up 25-28% during the last 3 years. In 2003, one-quarter (25%, HIS 20%, DA 28%) of the typical office’s patients had a hearing loss below 40 dB HL; slightly more than half of all patients had a moderate loss of 40-70 dB HL (55%, HIS 58%, DA 53%); and 20% of clients had severe losses (HIS 22%, DA 20%). If this trend continues, it will be good news for the hearing industry, as manufacturers have been trying to gain ground in the mild loss category and enlist more consumers to address their hearing loss at earlier stages. Unfortunately, since HR’s data suggests that the age of hearing aid purchasers has not changed significantly during the same period, it remains to be seen whether this is a real trend or only a statistical aberration (it is also possible that those older people who have milder losses are addressing their hearing loss with greater frequency).
MCO coverage and no-shows. Slightly less than half (45%, HIS 30%, DA 55%) of dispensing businesses have contracts for service with managed care organizations (MCOs/HMOs), and of those with contracts, about one-quarter (24%) of their patients are covered by these contracts (HIS 20%, DA 26%). Those dispensers who deal with MCO/HMO contracted patients report that the contracts make up 18% of their gross revenue (18%, HIS 21%, DA 17%). These figures have changed little in the last 5 years.
Finally, in the “just out of curiosity” column, this year’s survey asked dispensers what percentage of clients make an appointment and fail to show up for it (ie, either must reschedule the appointment or they never do call or make another appointment). Respondents answered that 7% (HIS 9%, DA 6%) failed to make scheduled appointments.
Testing of the Patient
Equipment and testing continues to get more sophisticated. It will come as a shock to no one that the testing of the patient during the screening, fitting and selection process has become more complicated and professional (Figure 20). Equipment found in approximately 7 of 10 dispensing offices includes audiometers (99%, HIS 98%, DA 100%), sound booths (80%), impedance/immittance test devices (72%), video otoscopes (68%), and real ear measurement equipment (67%). Dispensing audiologists are more likely to have sound booths (DA 91%, HIS 63%), impedance (DA 98%, HIS 33%) and real ear measurement equipment (DA 75%, HIS 56%) in their offices than hearing instrument specialists. Instrumentation for testing pediatric patients (OAEs, ABRs) and those patients who present with vestibular problems (ENGs)—two patient populations generally reserved for audiologists—are also far more common in these offices. Conversely, hearing instrument specialists are more likely to have video otoscopes (HIS 80%, DA 60%) and master hearing aids (HIS 70%, DA 21%) in their offices than dispensing audiologists.
OAEs gain widespread use among DAs; speech-in-noise testing embraced among HIS. When looking at trends in equipment usage during the last 8 years (Figure 21), it can be seen that the largest gains have been made in video otoscopes (39% in 1996 vs 68% in 2003), sound booths (70% vs 80%), and impedance/immittance measurement (64% vs 72%). Remarkably, 48% of the offices owned by dispensing audiologists reported having OAE test equipment (last year’s survey indicated that 32% had the test devices).

Tests performed by virtually all (>85%) dispensing professionals during a routine hearing assessment and hearing aid fitting (Figure 22) include air/bone thresholds, word recognition, SRTs, and speech UCL/MCL measures (although only 78% of dispensing audiologists perform this last test). You are more likely than not to find tympanometry (59%, HIS 36%, DA 74%) and video otoscopy (51%, HIS 71%, DA 37%) performed during a routine hearing test and fitting procedure. Less common are tonal UCL/MCL measures (40%, HIS 45%, DA 37%), acoustic reflex (40%, HIS 20%, DA 53%) and reflex decay (13%, HIS 5%, DA 19%), and OAEs (10%, HIS 0%, DA 17%) as part of a standard test procedure.
Perceptions about the value of speech-in-noise testing has made considerable gains during the last 2 years as the professional, manufacturing, and research communities continued to focus on directionality.4-7 Slightly more than half (52%, HIS 46%, DA 55%) of the dispensing offices in this year’s survey reported that they routinely conduct speech-in-noise testing (Figure 23). This represents a 10 percentage point increase from last year’s survey—with all of the new gains attributable to speech-in-noise testing by hearing instrument specialists. The percentage of dispensing audiologists conducting routine hearing-in-noise testing was found to be essentially the same as last year (56%). The most popular tests for assessing hearing in noise are the QuickSIN (42%, HIS 28%, DA 50%), SIN (17%, HIS 24%, DA 14%), SPIN (19%, HIS 20%, DA 18%), HINT (10%, HIS 12%, DA 9%), and various other measures (12%, HIS 16%, DA 9%).
Similarly, more dispensing professionals are verifying the benefit of hearing aids, but this increase is also due to a surge in hearing instrument specialists employing verification measures. Seventy-eight percent of hearing instrument specialist offices indicated that they use verification measures, compared to only 66% in last year’s survey. Seventy percent of audiologist offices conducted verification tests, the same percentage as last year.
Although hearing instrument specialists may have overtaken audiologists in the verification of benefit testing, they are more likely to use their own surveys and questionnaires to assess benefit (HIS 61%, DA 35%) than dispensing audiologists. The most popular measures for benefit used in dispensing offices are the COSI (30%, HIS 15%, DA 38%) and the APHAB (16%, HIS 15%, DA 16%). Other measures, including the HHIE/HHIA and the HHS, account for 10% of the tests used. (Note: the above figures reflect the incidence of testing in offices that indicated they do and do not conduct verification testing, and some offices used more than one measure.)
Hearing Instrument Dispensing, Selection, and Pricing
Marginal increases in unit volume during 2003. Although it has been demonstrated previously that gross revenues increased, and that HIA statistics showed a unit volume gain of 4.9% , the hearing aid volume remained fairly flat according to dispensing professionals (Figure 24). The typical dispensing office in 2003 dispensed an average of 29 units per month, with a median of 20 units per month. Offices run by hearing instrument specialists averaged 2 units more per month (36 units) compared to the previous year; however, it should be remembered that there were 2 extremely large dispensing offices included in these statistics. Thus, the median of 20 units per month—the same as 2002 figures—is probably a more meaningful gauge of dispensing activity. Offices owned by dispensing audiologists averaged 24 units per month—a 1-unit decrease from 2002 figures. The median number of units dispensed per month for these offices was the same as that for hearing instrument specialists (20).
Interestingly, a separate question in the survey asked dispensing professionals the total number of units they dispensed in 2002 and 2003 (Figure 25). The average number of aids dispensed was 296 units in 2002, and 312 in 2003 (a net gain of 13 units or about 1 unit per month). However, the median number of units dispensed in was 233 in 2002, and 216 in 2003 (a loss of 17 units). When viewing the above unit volume statistics against the data reported earlier, it’s probably fair to say that unit dispensing activity was flat, while overall profits increased due to the continued trend of dispensing more digital aids (discussed below). Indeed, when government dispensing activities (ie, Veterans Administration) are ignored, HIA statistics1 indicate that hearing aid sales for private practices increased by only 2.6% (not 4.9%1) in 2003. This figure would suggest that the average practice that dispensed 20 units per month in 2002 would have sold only 6 more hearing aids in 2003.8
More binaural fittings. Much of the robust hearing instrument unit volume growth that occurred in the early 1990s can be attributed to the increased popularity of binaural fittings. In 1983, binaural fittings constituted only 27% of all patient fittings.9 But, by 1992, binaural fittings made up 55% of all fittings,10 and then hovered between 68%-72% from 1998-2001. However, in the last two HR Dispenser Surveys, the incidence of binaural fittings has jumped 5-6 percentage points to 77%-78% (Figure 26). Offices owned by hearing instrument specialists fit 75% of their patients with binaural aids, while offices owned by dispensing audiologists fit 79% of their patients with binaural devices. The binaural fitting rate is reaching a saturation point (probably somewhere between 80-85%). MarkeTrak VI11 reports that the binaural purchase rate in 2000 among bilateral loss consumers was 84.5%, and 74.2% among all hearing aid users.
BTE use climbs rapidly. The use of behind-the-ear hearing instruments continues to increase.(Figure 27). In only 2 years, BTEs have moved from 16% of the market in 2001 to 25% in 2003. Dispensing audiologists used BTEs in 29% of their fittings, up from 20% in 2002, while hearing instrument specialists used them in 18% of their fittings, up from 12%.
These statistics are slightly more dramatic than those reported by HIA.1 According to HIA, BTE use increased by 1% in 2003 to constitute 23.7% of the market. However, experience with the HR Survey suggests that this number will increase in 2004-2005.
In response to this surge in the popularity of BTEs, the three other styles of hearing aids have experienced 2-3% declines in their use during 2002-2003, according to survey respondents. Full-shell and half-shell ITE use fell in market share from 32% to 30%, ITCs from 29% to 26%, and CICs from 21% to 19%. Figure 28 provides a 10-year look at HR survey statistics relative to hearing instrument styles. In general, it can be seen that ITE use has decreased in response to the popularity of CICs, and ITC use has similarly declined by about 5% during the last 10 years.
Directional microphone technology. As predicted by HR, the trend in greater BTE use has been largely driven by the utility of directional microphones (Figure 29) combined with digital technology. In the 3 years from 2001-2003, dispensing audiologists have embraced directional microphone technology, using it in nearly half (47%) of the hearing aids they dispense. This is remarkable considering that 41% of the aids dispensed by audiologists are of the ITE and CIC styles—hearing aids not physically conducive to directional technology due to size/faceplate restrictions. Utilization of directional technology by hearing instrument specialists has remained flat at 17% during this same 3-year period. Thirty-six percent of all the hearing aids dispensed last year accommodated directional technology, according to survey participants.
This is clearly good news for the hearing industry, as numerous studies have demonstrated that directional hearing systems remain the only proven way to increase the signal-to-noise ratio and help hearing aid users hear better in noisy environments.
Hearing aid technologies. As detailed in previous marketing articles,8 digital technology has completely transformed the hearing health care field. Figure 30 shows the recent trends in hearing instrument circuitry types. Digital instruments account for three-quarters (75%, HIS 70%, DA 79%) of all hearing aids dispensed; analog linear aids make up 12% of the market, and programmable analog (nonlinear) aids make up 10% of the market. Non-programmable nonlinear hearing aid circuits now constitute only 3% of all hearing aids dispensed.
A 7-year history of HR Survey statistics on circuit trends (Figure 31) shows graphically that the use of digital hearing instruments has climbed rapidly1 from 12% in 1997 to 75% in 2003 (Figure 31). HIA statistics indicated that, in 2003, 66% of all hearing aids dispensed were digital, 20% were analog non-programmable (linear), and 14% were analog programmable.
DSP hearing aid stratification. Obviously, DSP instruments have come to dominate the market, and product segmentation has become a large factor within the digital market.8 Therefore, this year’s HR survey questionnaire asked respondents to classify DSP products into 3 categories: premium high-end (highest priced) product lines, mid-level (moderately priced) product lines, and economy (lower priced) product lines. When asked the percentage utilization of each of these categories, dispensing professionals responded that 35% of their digital sales come from premium product lines (HIS 34%, DA 35%), 42% from mid-level lines (HIS 43%, DA 42%), and 23% from economy lines (HIS 23%, DA 23%).
Hearing aid prices in 2003. Similarly, this year’s survey asked dispensers the price of the different hearing instrument styles and technologies, with the digital instrument pricing divided into the Premium DSP and Economy DSP categories. These prices are shown in Figure 32. The Mid-Level DSP prices shown in the figure represent the midpoint between the Premium and Economy DSP prices (Note: The 2002 survey’s prices for digital aids—which did not make a distinction between premium, mid-level, and economy DSP lines—are shown in parenthesis next to the 2003 Mid-level DSP category).
Figure 32 shows, for all dispensing professionals, programmable analog aids decreased in price by $102-$400 (8%-26%) in 2003 compared to 2002. Conversely, analog linear aids increased in price by $8-$94 (0%-8%).
The range of pricing in digital instruments may be more indicative of the marketing picture than the actual gains or increases in DSP pricing. Dispensing professionals in 2003 offered digital instruments at a number of price points with a total range of over $1700 difference between the highest and lowest priced instruments. Offices owned by hearing instrument specialists offered DSP aids at prices ranging from $1567-3037, while dispensing audiologists’ offices offered DSP aids from $1302-3044. When considering all technologies and styles of hearing aids, dispensing professionals reported that the lowest priced instrument they offered was $754. All this is good news: consumers are being provided with a wide choice of products and price points (although it can be argued that there is still room for lower-priced aids). And, in a large measure, many of the lower-priced offerings are new hearing instrument lines introduced to appeal to economy-conscious consumers.8
Comparing the 2003 prices for Mid-Level DSP aids to DSP prices in 2002 (all professionals), prices fell slightly with a range of $4-$151 (0%-7%). In general, prices for digital instruments in hearing instrument specialist offices increased by $7-$284, while prices for digital aids in dispensing audiologists’ offices decreased by $191-288. One explanation for this is that many hearing instrument specialists, who have historically been more conservative in product/technology adoption, have been reluctant in bringing in the new economical digital lines as they become available. Additionally, 93% of hearing instrument specialists bundle their prices compared to 65% of dispensing audiologists. Finally, it should also be remembered that the Mid-Level DSP category is the average of the Premium and Economy DSP lines, and not a price that was stated by survey respondents.
Figure 33 takes the prices found in Figure 32 and weights them according to the HIA 2003 sales statistics,1 as well as for the three DSP product classifications discussed above. The result is that the average price for digital hearing instruments decreased by $231 (HIS $6; DA $395), or 9.7%, from 2002-2003. (Editor’s Note: Relative to the DSP column for hearing instrument specialists in Figure 33, although mid-level DSP prices in 2003 show an increase compared to average DSP prices in 2002, when the prices are weighted to include the economy DSP lines offered, the average price for a digital instrument decreases by $6.) For all professionals, analog linear prices increased by $35 or 3.7%, and programmable analog (non-linear) prices decreased by $180, or 12.6%.
Because of the large movement toward dispensing more expensive digital hearing instruments (ie, digital market penetration, as reported by HIA, increased from 45% to 65% of the market in 2002-2003), the average price of hearing instruments rose in 2003 by 3.7% to $1794. So, although the overall price of digital aids went down, once the large volume increases of these more expensive aids are considered, the average price of a hearing aid in 2003 increased slightly.
Figure 34 shows a 7-year history of pricing for the various technologies (not adjusted for inflation). Prices for DSP aids, predictably, rose during the introductory (first and second generation) phase of this technology, reaching a high-point in 2000. Since then, DSP prices have decreased, leveling off in 2003. Analog linear prices have remained fairly steady throughout the 7-year period, while programmable aids have decreased in average price since 1999.
Bundling of goods and services. It should be noted that the above prices reflect the predominant practice of bundling goods and services together and reporting them as the “hearing instrument price” (Figure 35). In 2003, 76% of all dispensing professionals bundled the prices of their goods and services (HIS 93%, DA 65%). In other words, only 7% of hearing instrument specialist offices and 35% of dispensing audiologist offices itemized their billing relative to the hearing aid price and fees for services.
Predictions for 2004
Dispensing professionals expressed much stronger optimism in this year’s survey compared to last year. Sixty-seven percent of dispensing professionals predicted that their businesses would experience unit volume gains of 22% during 2004 (Figure 36). About about one-third (30%) of dispensing offices reported that they expected no change in units sold in 2004, and only 3% predicted unit volume decreases of 16%. This shows much greater optimism than expressed in last year’s survey where only 47% predicted unit gains, 36% predicted that sales would remain the same, and 17% predicted a sales downturn. The optimism for 2004 is fairly well distributed between the two dispensing professions: 68% of dispensing audiologists forecasted unit volume increases of 14%, while 65% of hearing instrument specialists forecasted increases of 20%.
Similar percentages were provided for predictions on revenue growth (Figure 37). For all dispensers, 68% predicted their business revenues would increase by 14%, while 29% said the revenues would stay the same, and only 3% expected losses averaging 17%. Again, this is much better than last year’s survey where only 49% of dispensers predicted that revenues would increase, 36% predicted that they would stay the same, and 15% predicted revenues would decline.
Summary
Some of the interesting data uncovered by this year’s survey:
- Ten years ago, 55% of hearing instrument specialist and 25% of dispensing audiologist practices were owned by dispensing professionals ages 50+. Today, 73% of HIS and 50% of DA owners are age 50+. One-fifth (21%) of owners in this year’s survey were over age 61.
- A recovery in the number of single-line dispensers (15% in 2003 compared to 9% in 2000) has occurred.
- The average office carries 2-4 brands of hearing aids and dispenses 72% of its hearing aids from its most popular brand.
- The average number of aids dispensed in 2003 was 312 compared to 296 in 2002, for a net gain of about 1 unit/month.
- In 2003, more than half (53%) of dispensing professionals experienced gains in gross revenues (averaging 13%), one-third (31%) reported flat revenues, and only 16% reported revenue decreases (averaging 10%).
- About 57% of consumers who purchased a hearing aid in 2003 already owned one.
- Slightly more than half (52%) of dispensing professionals say they routinely conduct speech-in-noise tests.
- In the last 2 years, binaural hearing aid fittings have increased by 5-6 percentage points to 77-78%.
- Dispensing audiologists use directional systems for nearly half (47%) of their fittings, but hearing instrument specialists use them in only 17% of fittings. Overall usage is 36%.
- The use of BTE aids has risen quickly from 16% of the market in 2001 to 25% in 2003.
- DSP instruments constituted 75% of fittings in 2003. HR estimates that DSP prices fell by $231, or 9.7%, in 2003. However, due to the number of consumers moving to the more expensive digital instruments, the average price of a hearing aid increased slightly (3.7%) in 2003 to $1794.
- Dispensing professionals expressed optimism for 2004: 67% predicted volume gains averaging 22%, while 68% predicted increases in gross revenues averaging 14%.
Acknowledgements
The Hearing Review thanks those hearing instrument specialists (HIS) and dispensing audiologists (DA) who took time out of their busy schedules to participate in this year’s survey. Without the valuable contributions of these respondents, this report would have been impossible. No incentives—other than helping other professionals better understand the market—were offered. The willingness of these individuals to share information about their businesses/practices provides information that all hearing care professionals can use in years to come in their business planning.
The editor also thanks Christina Jackson, CPA, an accountant in Two Harbors, Minn, for the tabulation of this survey’s data.
References
1. Hearing Industries Association. Quarterly statistics report for the fourth quarter 2003. Alexandria, Va: HIA: 2004.
2. Skafte MD. A review of the 1994 hearing instrument market. Hearing Review. 1995; 2(3):16-27,53,60,61.
3. Strom KE. The HR 2002 Dispenser Survey. Hearing Review. 2002; 9(6):14-32.
4. Kochkin S. MarkeTrak VI: On the issue of value, hearing aid benefit, satisfaction, and repurchase rates. Hearing Review. 2003; 10(2):12-26.
5. Killion MC. Myths about hearing in noise and directional microphones. Hearing Review. 2004; 11(2):14-19,72-73.
6. Dittberner A, Bentler R. Interpreting the directivity index. Hearing Review. 2003; 10(6):16-19.
7. Powers TA. Proving adaptive directional technology works: A review of studies. Hearing Review. 2004; 46-49,69.
8. Strom KE. A brightening future? A review of today’s hearing instrument market. Hearing Review. 2004; 11(3):18-26.
9. Cranmer KS. Hearing instrument dispensing—1983. Hear Instrum. 1983; 34(5):28-44,87.
10. Grahl C. A dispenser yardstick: How to measure your 1992 performance. Hear Instrum. 1993; 44(6):4-13.
11. Kochkin S. MarkeTrak VI: The VA and direct mail sales spark growth in hearing aid market. Hearing Review. 2001;8(12):16-24, 63-65.
12. Strom KE. Looking back to move forward: The hearing instrument market in the new digital age. Hearing Review. 2003; 10(3):18-25.
13. Yntema S. Americans 55 & Older: A Changing Market. 2nd Ed. Itaca, NY: New Strategist Publications, Inc; 1999.
Correspondence can be addressed to Karl Strom, The Hearing Review, Allied Healthcare Group, 6100 Center Drive, Ste 1020, Los Angeles, CA 90045; email: [email protected].

