Updated February 9, 2017
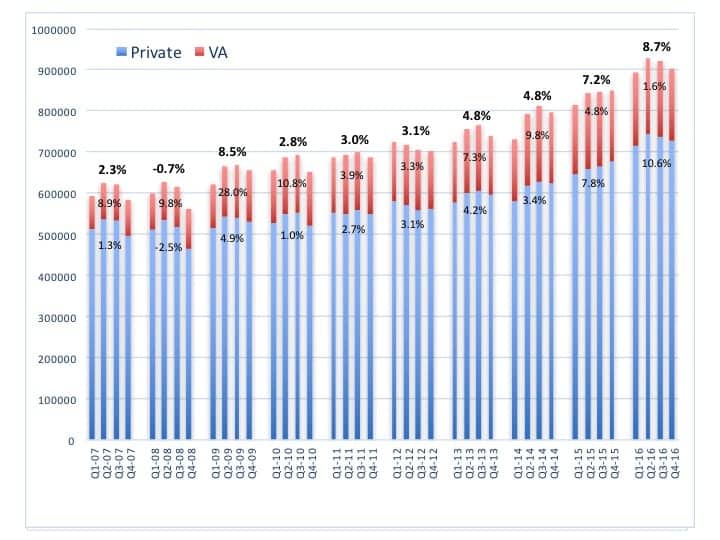
A net total of 3.65 million hearing aid units were dispensed in the United States during 2016, or 8.7% more than in 2015, according to statistics generated by the Hearing Industries Association (HIA), Washington, DC (Figure 1). Hearing aid sales in the fourth quarter (Q4) were strong but slightly softer (6.0%) compared with gains in Q1-Q3 (9.7%, 10.1%, and 8.8% respectively).

Figure 1. [Click on images to expand.] US net unit sales of hearing aids by quarter (2007-2016), with private/commercial unit sales shown in blue and VA in red. Overall percentage gains/losses for each year are shown in bold at the top. In 2016, US net hearing aid unit gains were 8.7% compared to 2015, while private sector and VA gains were 10.6% and 1.6%, respectively. Source: HIA.
What gains did the average dispensing practice experience in 2016? It should be remembered that unit sales of Costco—the fastest growing segment of the market in the past several years—are included in the HIA figures. There are no available estimates for Costco’s growth; indeed, HR has no reliable figures for the mass distributor’s market growth for at least the last 3 years. Hearing Review estimated that, in 2015, Costco accounted for about 11% of all hearing aid sales. Given what appears to be continued strong growth in the market, and using a 15% growth figure for 2016, we estimate that the retail giant’s sales now constitute about 12% of the total market (Figure 2).

Figure 2. Hearing Review estimates of hearing aid unit growth (1979-2016) of the private/commercial sector (in blue), Costco (red), and the VA (green). HR estimates that Costco now constitutes about 12% of the total US market. The VA makes up 20%. Source: HIA and HR estimates.
Without Costco, private sector hearing aid sales growth increased by 9.8% (vs 10.6% including Costco).
This year, two hearing aid companies with US headquarters in Minneapolis became reporting members to HIA’s statistical marketing program: Hansaton USA and Intricon. Both are established hearing aid manufacturers; Hansaton has is part of the Sonova Group and has traditionally had a strong market presence in Germany, and Intricon is a supplier of hearing aids to many industry firms, most notably UnitedHealth’s hi HealthInnovations. Together, they may have accounted for as much as 3-4% extra percentage points to HIA’s 2016 statistical report.
Thus, discounting gains attributable to Costco and the new HIA members, the private sector probably experienced a growth rate somewhere around 5-6%.
In terms of market value, we know from the 2016 HR survey and from other reports that average selling prices (ASPs) of hearing aids are going down—probably in the range of 1-3% annually. However, the effects could be slightly less for independents; the HR survey (in which 71% of respondents were independents) indicated that CPI-adjusted average prices increased by 0.9% and 2.0% for mid- and premium-level product lines, respectively, between late 2013 and early-2016, but decreased by 11.6% for the economy lines. Overall, the survey found that ASPs fell by 1.5% during that period.
So, although the unit gains paint a rosy picture of “high times” for dispensing practices, in terms of gross revenues, the “average dispensing practice” is not experiencing the 10.6% unit growth figure reflected in the YE2016 HIA statistical report. Indeed, it would appear that gross revenue increases would be slightly less than half that figure.
Still, the overall market picture does appear to suggest that the aging population of Baby Boomers are starting to make their effects known on the US market.
Slowdown in dispensing activity at the VA. In contrast to the private sector, 2016 was an uncharacteristic year for dispensing activity at the US Department of Veterans Affairs (VA). The VA dispensed only 1.6% more hearing aids than it did in 2015—the lowest percentage gain in over a decade (2005, -6.2%). In 10 of the 14 years between to 1997 to 2010, the VA experienced 10% or better unit growth; in the ensuing 6 years (2011-2016), it has experienced 10% growth only once (9.8% in 2014).
The VA constituted 19.8% of the entire US market in 2016, down from 21.2% in 2015.

Figure 3. Use of different hearing aid styles by the entire market in 2016. BTEs accounted for 4 in 5 hearing aids dispensed in 2016 when combining receiver-in-the-canal (66%) and traditional BTEs (15%). Source: HIA.
Dispensing of hearing aid styles. Figure 3 shows that about 4 in 5 (81.3%) of all hearing aids dispensed in 2016 were behind-the-ear type hearing aids, according to the HIA statistics (82.6% private sector; 76.2% VA). Receiver-in-the-canal (RIC/RITE) hearing aids, a subcategory of BTEs, accounted for 66.2% of all hearing aids sold, while traditional BTEs and ITEs made up 15.1% and 18.6% of the market, respectively. Looking more closely at the ITE category, full- and half-shell ITEs constituted 7.7% of all aids dispensed (5.5% and 2.0% respectively), while in-the-canal (ITC) and completely-in-the-canal (CIC, or invisible in the canal) aids made up 6.3% and 4.6% of the market respectively.
From a historical perspective, this continues a large shift away from traditional ITEs and BTEs in favor of RIC/RITEs. Figure 4 shows that, only 5 years ago (YE2011), RIC/RITE aids and traditional BTEs made up 35% of the market each (70% combined). Meanwhile, ITEs constituted 15% of hearing aids in 2011, while ITCs and CICs made up 8% and 7% respectively.


I want to know the price of Phonak Brio TM 3 hearing aid and store location near zipcode 77379 USA
Hi,
Do Analog hearing aids ( excluding Refurbished one) are stil used in United States & Mexico?