Research | February 2019 Hearing Review
AERPs and the use of non-target words can provide insights into listening effort
The audiologist or researcher in search of a quantifiable index of “listening effort” need look no further than the PN component of the auditory event-related potential (AERP).
Isolated words, especially consonant-vowel-consonant (CVC) words, have played a prominent role in audiological assessment for many decades. The venerable PB-50 word lists, developed during World War II, may still be found in the armamentarium of virtually every audiologist in active practice. They have long played a key role in testing for speech recognition.
In an article in the July 2018 Hearing Review,1 it was suggested that audiologists might find auditory event-related potentials (AERPs) useful in supplementing the clinical evaluation of word recognition. Real-word listening, especially in unfavorable environments, can be an effortful activity. The listener must recruit attention to bring the word into awareness, memory to hold it attended until analysis has been completed, phonemic analysis to determine the phonological structure of the word, and semantic analysis to determine its meaning. In this article we ask to what extent AERP technology can supplement conventional behavioral measures of speech recognition by providing a measure of listening effort beyond the conventional percent-correct score.
The AERP and “Oddball” Paradigm
The design of any AERP procedure requires that the participant make a decision on each trial of an experimental run. To this end a series of trials is presented. The listener is instructed that each trial will contain either a target or a non-target (sometimes termed the “oddball” paradigm). The a priori probability of a target is purposely set low, usually 10-20%. On each trial the participant must vote either “target” or “non-target.” Such procedures can generate multiple AERPs of interest. Here our focus is on two distinct AERP waveforms:
1) In the case of targets (low probability), a late positive component (LPC, also known as P300) in the latency range from 300-1200 msec—shorter for easy decisions, and longer as the task becomes more difficult.2
2) In the case of non-targets (high probability), a processing negativity (PN) component3 in the latency range from 300-1200 msec, depending on the stimuli used. In the case of CVCs, the PN can be observed as a negativity peaking in the 450-550 msec range and slowly returning to baseline. The degree of negativity increases with the difficulty of the listening task (not to be confused with the familiar N400 response4 to semantic incongruity, or the late negativity(LAN)5 identified with syntactic processing). All three share the same post-stimulus latency range.
Figure 1 compares the waveforms and surface topologies of the AERPs to targets and non-targets in a single normal-hearing subject listening for phonemic targets. In the case of non-targets (left illustration), the processing negativity component (PN) is all negative (warm colors) and peaks in the fronto-central region of the left hemisphere. In the case of targets (right illustration), however, the late positive component (LPC) is all positive (cold colors) and centers over the parietal electrodes, slightly right of the midline. The two components are clearly differentiated.
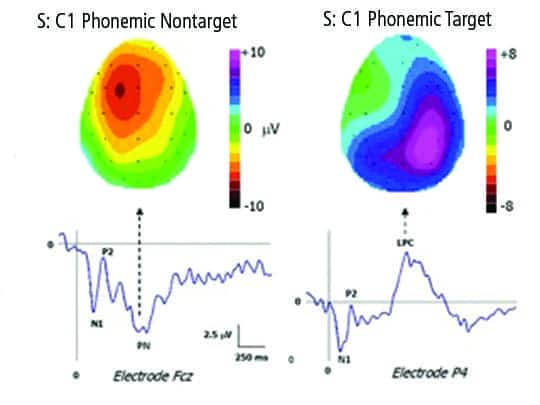
Figure 1. Topographic maps of a single listener in a phonemic detection experiment, contrasting the negative surface activity of non-target words with the positive surface activity of the target words. The two maps differ according to both polarity of the response and its locus over the surface of the skull.
Rationale
In this article we ask how the PN component of the AERP differs as the complexity of the paradigm, and the concomitant instructions to the listener, are systematically varied. We present data showing how the AERP waveform generated by the same non-target words reflects the increasing demand on mental resources, enabling participants to identify the target stimuli presented under four instructional sets (as explained below).
While valuable information can be obtained from the analysis of target stimuli, it is important to emphasize that our focus here is on the AERPs generated to non-target stimuli. By restricting attention to the analysis of non-target words, we demonstrate that variation in the PN component of the AERP across conditions can be attributed solely to the instructions to the listener as the listening task varies in target complexity, ranging from a simple burst of noise, to a spectral (voice/gender) feature, then to the linguistic features of phonological and semantic analysis of words. The use of non-targets rather than targets also yields improvement in the AERP signal-to-noise ratio (SNR), since there are many more trials for non-targets than for targets in the oddball paradigm.
An Experiment Using Four Conditions
There were four separate conditions and 60 trials per condition. Each trial consisted of the presentation of a randomly selected consonant-vowel-consonant (CVC) word spoken by a single male talker (non-target). In each 60-trial condition, listeners were instructed to count the number of target events as follows:
- A) A burst of white noise (an acoustic, non-linguistic task).
- B) A CVC word spoken by a female talker; to test for a spectral difference from the voice of the male talker who recorded all of the other CVC words (a spectral speech detection task).
- C) A CVC word that rhymes with “Jet” (a phonological decoding task).
- D) A CVC word from the semantic category of either body parts or names of animals (a semantic processing task).
These four conditions represent points along a continuum of stimulus complexity and concomitant task difficulty. The four conditions of the test are summarized in Table 1.
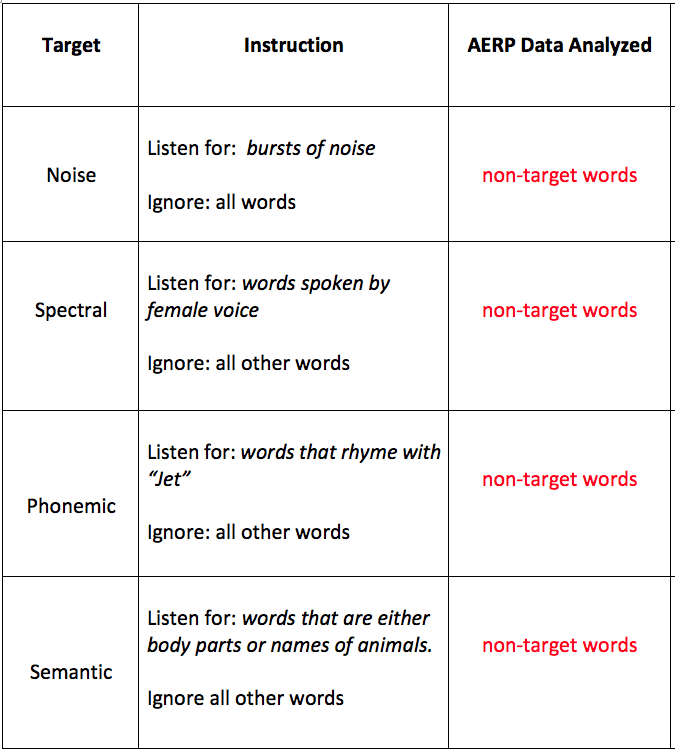
Table 1. The four conditions of the experiment. Note that, across conditions, the analyzed AERP data are based on the same pool of randomly-selected, non-target words.
We gathered AERP data on 10 young adults with normal hearing, fitted with a 32-channel electrode cap. The rationale was that as the target task difficulty increased in each condition, there would be a corresponding increase in the depth and duration of the PN of the AERP to the non-target words. The listener was instructed that, in each condition, targets were stimuli included in the predefined category. Non-target words, in contrast, held no particular significance and were to be ignored.
In each condition we averaged AERPs to all trials containing only non-target words. AERPs to the target words are not a part of this report. We essentially ask, “How does the nature of the instructions to the listener relative to the defined task affect the processing negativity of the AERP to the same words?” Stated differently, the AERPs of all four conditions were based on the same pool of CVC non-target words. Any differences across the four conditions could be based only on the instruction to the listener concerning what to listen for in each of the four conditions.
Results
Figure 2 shows grand-averaged AERP waveforms of the non-target words, for each of the four experimental conditions, at electrode position FC3 (fronto-central location in the left hemisphere). The familiar N1 peaks appear at a peak latency of about 100 msec, the P2 peaks at about 200 msec, and the PN components at about 500 msec. At first glance it would appear that the N1 and P2 peaks shift downward in proportion to the experimental condition, but this is confounded by the fact that the N1-P2 complex rides on the PN negativity which, itself, increases with condition complexity. If this slowly increasing PN negativity is digitally high-pass filtered at 2 Hz, the N1-P2 complex is invariant across the four conditions at all electrodes. The present N1-P2 complexes appear to signal only the onset and preliminary analysis of a word.

Figure 2. Auditory event-related potentials (AERPs) to non-target words under four conditions: 1) Black curve – while listening for target bursts of white noise embedded among randomly selected CVC words; 2) Red curve – while listening for target words that have been recorded by a female talker, embedded among randomly selected CVC words recorded by a male talker; 3) Dashed purple curve – while listening for target words rhyming with the word “jet,” embedded among randomly selected CVC words; 4) Blue curve – while listening for target words that were either body parts or articles of clothing, embedded among randomly selected CVC words. Note the progressively increasing negativity of the PN component as complexity of the auditory input increases.
The black curve in the figure shows the result for the Noise-Burst Condition. Note the PN component in the latency region of 500-600 msec, descending to a peak negative amplitude of about 5 microvolts, then returning to baseline at about 1000 msec. This PN component is not unexpected in view of the salient contrast between a word and a burst of noise.
The red curve shows the result for the Spectral Condition. Here the additional cognitive load imposed by the slightly more complex target (a female voice rather than a male voice) is reflected in the slightly greater negativity (-7.5 microvolts) in the 500-600 msec latency range.
The even more negative levels (-10 microvolts) of the blue and dashed purple curves for the phonemic and semantic conditions, and the longer recovery time to baseline, reflect the additional burden imposed by the need to process each word—both target and non-target—either phonologically or semantically. The processing demands of each of these two conditions appear to be equivalent.
Figure 3 displays the surface topology of the grand averaged AERPs for each of the four conditions. Note that the area of maximum negative amplitude is located over the frontal and fronto-central areas of the left hemisphere. As noted above, this clearly differentiates it from the topology of the LPC component to words which typically peaks symmetrically over the midline parietal and centro-parietal region of the surface topology.3 The PN negativity is least for the acoustic task, slightly greater for the spectral task, and greater still for the semantic and phonemic tasks. All four peak latencies are within the range from 482-532 msec.

Figure 3. Topographic maps of the distribution of AERP voltages across the surface of the skull for each of the four conditions of the experiment. Warm colors denote negativity, cold colors positivity. PN negativity is maximal over the left fronto-central areas in each condition. PN negativity is smallest in the noise-burst condition, intermediate for the spectral condition, and greatest for the phonemic and semantic conditions.
Why Study Responses to Non-Targets Instead of Responses to Targets?
People familiar with the AERP paradigm are usually interested only in the responses to target stimuli.3 And, indeed, in the early days of AERP research that was a reasonable conclusion. The early experiments usually involved either clicks or tone-burst targets and tone-burst non-targets, typically a 50-msec, 1000-Hz burst (non-target) and a 50-msec, 2000-Hz tone burst (target). The procedure was simple: Listen for a change in the pitch of the tone burst. This is not a very difficult task. The listener quickly develops a simple strategy; ignore everything until you hear a change in pitch. In such a sequence of stimuli there is almost no AERP response to the lower-pitched 1000-Hz tone burst, but a healthy positive response to the high-pitched 2000-Hz tone burst, the late positive component (LPC).
The assumption grew that there was little or no point in considering the non-target responses since there was no evident response to the frequent low-pitched stimuli. Not unexpectedly the focus in most early experiments was, and continues to be, either the LPC alone or the difference between the LPC response to targets and the LPC response to non-targets, which is essentially the response to targets.
In the case of the AERP to non-target words, however, the situation is more complex. Each non-target word is different from its neighbor. None can be ignored because each different word is a potential target until ruled out. Hence there is a prominent negativity when the responses to non-targets are averaged.
Students of AERPs have sometimes assumed that the instructions to the listener in an AERP procedure affect only the response to low-probability target stimuli. However, the present results demonstrate that, when the sequence of non-target stimuli is real words rather than tone bursts, what the listener is instructed to listen for impacts the higher-probability non-target words, as well.
Discussion
The audiologist in search of a quantifiable index of “listening effort” need look no further than the PN component of the AERP. The present data show how the depth and recovery of the AERP generated by non-target words reflects the cumulative effect of systematically increasing the cognitive load on the listener. This was achieved by changing the nature of the task defining target words, then noting the effect on the processing of non-target words.
Recall that this effect has been demonstrated on the same non-target words randomly selected from the same pool of CVC words across all four conditions. The only change across conditions was the complexity of the target task and the associated instructions to the listener. As these conditions commanded more listening effort, the PN peaked more negatively in the 500-600 msec latency range.
These results were gathered in listeners with normal hearing. Results in hearing-impaired listeners may prove even more dramatic as the input signal to the auditory system becomes degraded and impoverished.3
Summary
Auditory event-related potentials (AERPs) to non-target CVC words were measured in young adult listeners with normal hearing under four conditions: 1) Count the number of noise bursts embedded among non-target words; 2) Count the number of words spoken by a female voice embedded among non-target words spoken by a male voice; 3) Count the number of words that rhymed with the word “jet”; and 4) Count the number of words that were either the names of animals or articles of clothing, embedded among non-target words. Only data gathered from non-target words have been presented. The processing negativity (PN) of non-target words was concentrated over the frontal and fronto-central regions of the left hemisphere; least for the noise-burst condition, intermediate for the spectral condition, and maximal for the phonemic and semantic conditions.
Results showed that, as the cognitive demands of the listening task increased, there was a parallel increase in the depth and recovery time of the processing negativity (PN) component of the response to non-target words. This implies that the PN may represent a good indicator and possible tool for the quantification of listening effort.

Correspondence can be addressed to Dr Jerger at: [email protected]
Citation for this article: Jerger J, Martin J. AERPs reflect complexity of word recognition. Hearing Review. 2019;26(2)[Feb]:14-18.
References
-
Jerger J. Clinical speech audiometry in the age of the AERP. Hearing Review. 2018;25(7):14-19.
-
Picton T. Human Auditory Evoked Potentials. San Diego, CA: Plural Publishing Inc; 2010:419.
-
Jerger J, Martin J, Fitzharris K. Auditory Event-Related Potentials to words: Implications for audiologists. Scotts Valley, CA: CreateSpace Independent Publishing Platform; 2014.
-
Kutas M, Hilyard SA. Reading senseless sentences: Brain potentials reflect semantic incongruity. Science. 1980;207(4427):203-205.
-
Hoen M, Dominey PF. ERP analysis of cognitive sequencing: A left anterior negativity related to structural transformation processing. Neuroreport. 2000;11(14):3187-3191.