Tech Topic | August 2020 Hearing Review
This clinical study examines the new autoREMfit application of Audioscan VerifitLINK as integrated into Signia Connexx hearing aid fitting software. The results reveal good fit-to-target accuracy (RMSE ~2 dB; 65 dB SPL input) for two different audiograms and coupling systems. Test-retest reliability was excellent with no value greater than 1 dB at any frequency. Clinical benefits of this autoREMfit collaboration are discussed.
By John Pumford, AuD, and H. Gustav Mueller, PhD
Certainly one of the most critical aspects related to the fitting and dispensing of hearing aids (HA) is ensuring that the gain and output have been optimized for a given user across frequencies. While to some extent, this is patient-specific, we do know that on average, the best starting point is a validated prescriptive fitting method such as the NAL-NL21 or the DSLv5.0.2 Research has shown that a verified fitting to either of these validated generic fitting formulas will provide increased benefit when compared to alternative choices, such as the manufacturers’ proprietary fittings (with both adults and pediatrics; see Mueller, Ricketts and Bentler3 for review). Clinical studies have also shown that the manufacturer’s version of these validated generic fitting formulas typically does not result in targeted behavior in the real-ear (and often despite a perfect match to target displayed by the software simulated output).4,5 This evidence leads to the logical conclusion that real-ear probe-microphone verification is necessary for all hearing aid fittings.
Probe-microphone (aka real-ear) measures, as we know them today, have been clinically available for 35 years. The use of this verification approach has been part of all clinical guidelines from professional organizations that have been written since that time. Some documents, in fact, go so far as to state what frequency-specific dB deviations from prescriptive targets are allowable.6,7 Despite the logical need for real-ear verification, and the support from professional organizations, many health care providers (HCPs) do not conduct this testing at all, or do not use it to verify prescriptive targets.
Surveys from past years indicate that probably no more than 30-40% of HCPs fitting hearing aids routinely conduct probe-mic measures.8,9 An interesting finding from the Mueller and Picou8 survey related to the 42% of respondents who already had categorized themselves as people who used probe-mic routinely, and were then asked to identify the primary reason they conducted this testing. They were given several possible choices, one of which was: “to match gain and/or output to prescriptive fitting targets (eg, NAL or DSL) displayed by the probe-mic equipment.” Only 27% selected this reason. So to do the math, if only 42% of HCPs are conducting probe-mic measures, and only 27% of these are fitting to prescriptive targets, we’re left with a dismal 10% of HCPs overall who routinely verify hearing aid output relative to a prescription.
There are many reasons why verification to prescriptive targets is not a routine practice (see Mueller et al3 for discussion). It is tempting to think that ownership of the equipment is a major factor. This doesn’t appear to be true, as this also was examined in the Mueller and Picou survey.8 They found that for the entire sample of HCPs who fit hearing aids, 42% reported doing probe-mic measures. When they narrowed the sample to only those who had the equipment, the use-rate only increased to 56%. That is, 44% of HCPs who had the equipment were not using it, or at least not using it routinely. We can come up with several possible reasons why these disparate findings exist, including: the perceived complexity of the hearing aid programming that would be involved; the HCP is not skilled in probe-mic techniques and procedures; and/or the real-ear fit-to-target process is perceived as too time consuming.
To address in part the issues just mentioned, hearing aid and real-ear equipment manufacturers have partnered to develop an automated method for fitting to prescriptive targets, which we’ll refer to as autoREMfit, although each company tends to have their own name for the procedure (see Mueller and Ricketts for review10). AutoREMfit isn’t something new; it has been around for 20 years,11 but there recently has been an increased interest.
In principle, with autoREMfits, the hearing aid manufacturers’ software exchanges measurement and control data with the verification equipment, assessing the difference between the real-time measured output and the desired (target) output to make HA programming adjustments until a match to target is obtained. The HCP still has to make some pre-fitting decisions in the HA fitting software, ensure that the patient is seated correctly and the probe tube placement is appropriate, but the fit-to-target itself is automatic. Today, there are at least five different verification equipment companies that have partnered with four leading HA manufacturers (and their affiliates) to develop an autoREMfit option.12 Overall, research with these different autoREMfit approaches have shown them to be reasonably accurate and reliable.13-16
As reviewed by Mueller,12 there are several potential advantages to using autoREMfit. First, the fit-to-target most likely will be faster than that accomplished with traditional HCP programming, even for an experienced provider.14,15 For someone who is new to programming hearing aids, the autoREMfit likely will be more accurate and consistent than the HCP-fit. The procedure also would come in handy when the need arises to program hearing aids that the HCP normally doesn’t work with. Finally, the automated procedure is indeed impressive, and could be used as a sales tool, helping to ensure patient confidence in the fitting.
There are, however, some potential concerns.10 Some autoREMfit implementations fit only to the real-ear insertion gain (REIG), not to output targets using the real-ear aided response (REAR). Will this fitting be acceptable and appropriate for the HCP who relies on the REAR values? As pointed out by Mueller and Ricketts,10 if the patient’s real-ear unaided gain (REUG) is abnormal, it’s unlikely a match to the REAR target will be obtained using the REIG approach.
Another issue is that some systems only fit to average-level inputs. Will the resulting fit to soft and loud level inputs be okay? If considerable effort is still needed to fit to soft and loud inputs, then the procedure is no longer faster. A final concern is that some autoREMfit systems use the prescriptive targets from the HA fitting software, not those of the verification equipment. We’ve already mentioned that the HA manufacturer’s simulated output does not agree with measured real-ear values. Will this then also impact the fit-to-target accuracy of the autoREMfit?
The present study was designed to evaluate Audioscan’s new autoREMfit platform, VerifitLINK, as integrated into Signia Connexx fitting software. VerifitLINK allows direct communication between manufacturer’s hearing aid fitting software and Verifit systems. The implementation evaluated in this study satisfies some of the concerns we mentioned in that the VerifitLINK autoREMfit is based on REAR measures (using calibrated speech signals) and the targets that are employed are from the verification equipment, not the hearing aid software. Specifically, the study was designed to answer the following five questions:
- What is the fit-to-target accuracy of the autoREMfit procedure?
- What is the test-retest reliability of the autoREMfit procedure?
- Does the tightness or openness of the eartip affect the fit-to-target accuracy?
- Does the degree of hearing loss impact the fit-to-target accuracy?
- Does an autoREMfit to average inputs also improve the fit-to-target for soft and loud inputs?
Procedures
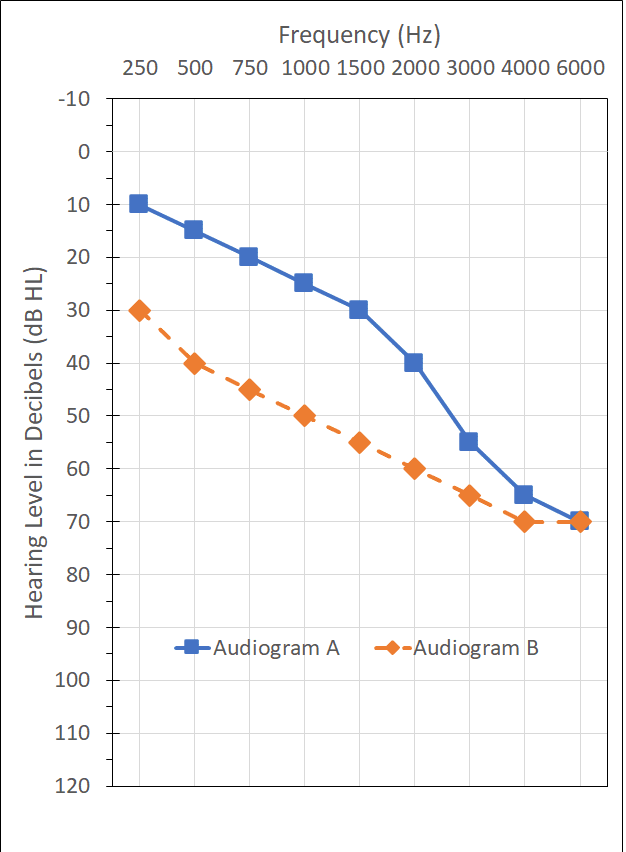
All testing was conducted bilaterally on 8 adults (4 male, 4 female) using the Audioscan Verifit2 (software v4.20.1). Participants were fitted with Signia Xperience 7x RIC (M receiver) hearing aids, programmed via Connexx (software v9.2.10.574). Two different audiograms falling within the manufacturer’s specified hearing aid fitting range and deemed common by the authors were used for the autoREMfit measures (Figure 1): one with normal hearing in the low frequencies sloping to a moderately-severe SNHL (Audiogram A) and the other having a mild-moderate loss in the lower frequencies sloping to a moderately-severe SNHL (Audiogram B).
The VerifitLINK autoREMfit was conducted for the following conditions: Audiogram A with an open fitting tip, Audiogram A with a closed fitting tip, Audio B with a closed fitting tip, and a repeat of Audiogram B with a closed fitting tip for determination of test-retest reliability. While Signia’s autoREMfit implementation of VerifitLINK uses the target match for a 65 dB SPL input as the basis of programming adjustments, we also measured REARs for inputs of 50 and 80 dB SPL (an option in the Signia autoREMfit software). For all test conditions, REARs also were obtained for the manufacturer’s NAL-NL2 First-Fit for the same three inputs. In addition to the aided measures, real-ear unaided responses (REURs) and real-ear occluded responses (REORs) for both ear tips were conducted for all participants.
For the manufacturer’s First-Fit protocol, the audiogram under test was selected in NOAH 4 (v4.12) for importation into the Connexx fitting software and transfer into the Verifit2. The device coupling under test (open vs closed) was chosen in the fitting software and the “limit gain” parameter was deselected in the critical gain screen. The Connexx programming parameters were set to: NAL-NL2, Adult, Experienced User, Non-tonal, Acclimatization 100%, Bilateral fitting.
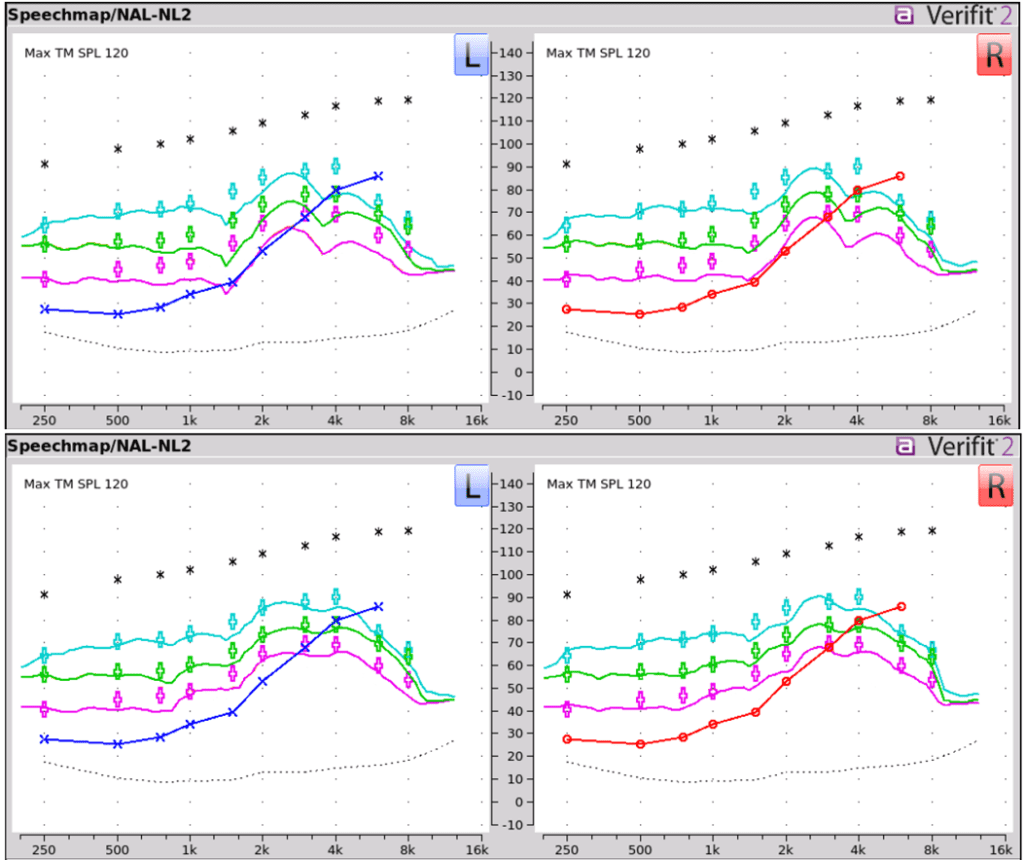
For the autoREMfit procedure, the VerifitLINK interface was set to: Measurement Method=On-ear; Fitting Formula=NAL-NL2; Signal Type=Speech-ISTS; RECD Source=Verifit Average; Transducer=Insert+Foam; Language=Non-tonal; for a bilateral fitting. A stored equalization procedure was used for all measures. An example of REARs obtained before and after completion of the VerifitLINK autoREMfit procedure is shown in Figure 2.
Probe tube placement was completed with each participant using Audioscan recommended procedures, visually assisted positioning techniques and ProbeGUIDE17 to result in a placement of the probe tip within 5mm of the eardrum. A probe-tube marker was used to ensure consistent placement and address any potential confounding factor of probe-tube placement differences across test conditions.
Results
The primary purpose of this research was to assess the fit-to-target accuracy of the new VerifitLINK-Signia autoREMfit application. We conducted autoREMfits for two different audiograms, and for Audiogram A, used two different types of ear couplings. Test-retest also was measured for Audiogram B.
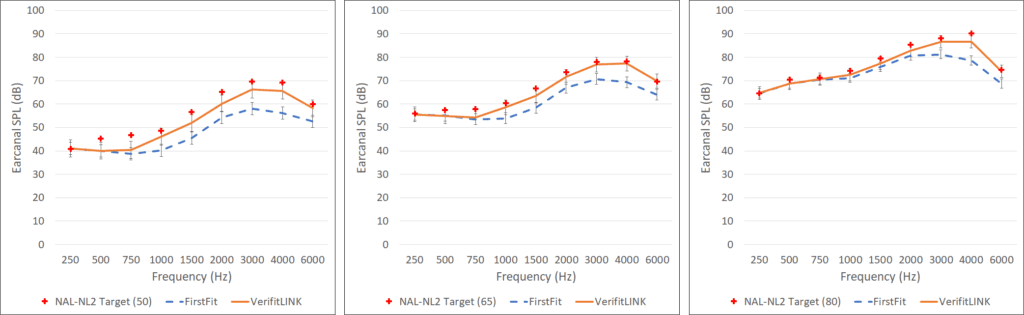
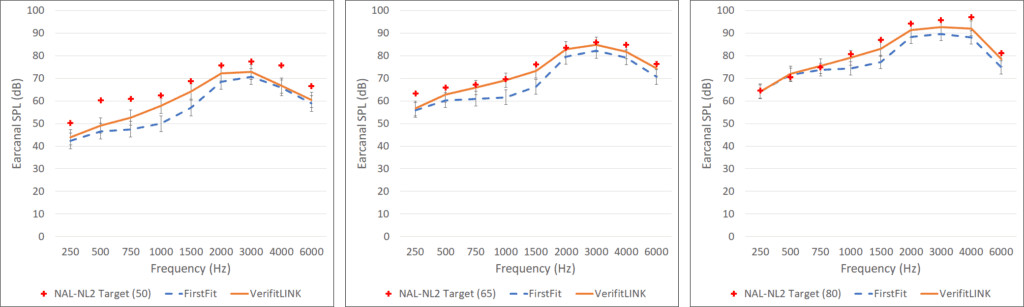
Audiogram A autoREMfit. The NAL-NL2 targets are shown in Figure 3, with the mean REARs for the manufacturer’s First-Fit (NAL-NL2 with no programming changes), and the mean REARs for the autoREMfit. These values are for the open fittings; results in the three different panels are for inputs of 50 dB SPL, 65 dB SPL and 80 dB SPL (autoREMfit only was conducted for the 65 dB input). As expected from previous studies, the First-Fit for NAL-NL2 (without programming) fell below fitting targets for all three input levels. The autoREMfit, however, particularly for the 65 dB SPL input, resulted in a close match to prescriptive targets across frequencies.
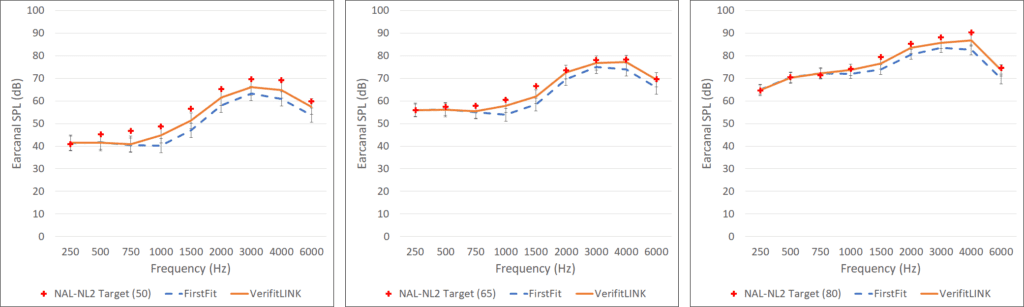
Shown in Figure 4, also for Audiogram A, are the mean test results for the same conditions as Figure 3, except these measures were obtained using a closed instant fitting tip. As can be seen, the findings are very similar to when the open fitting tip was used.
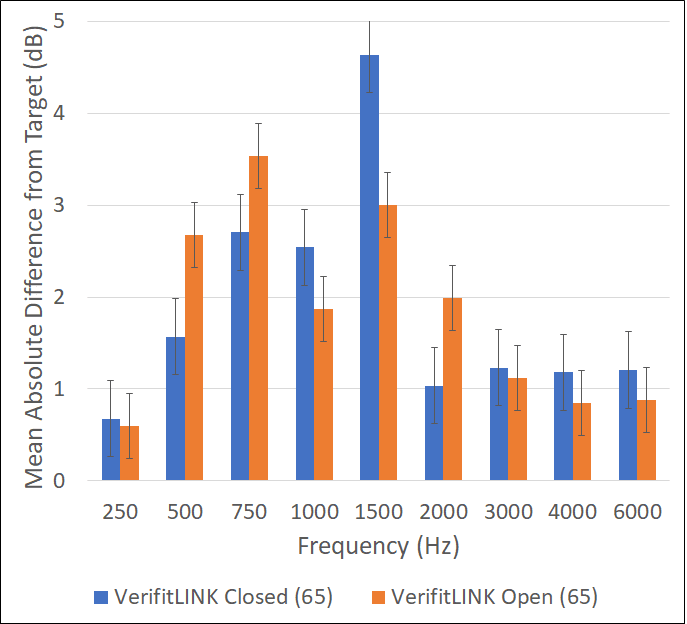
One of our research questions centered on the possibility that the accuracy of the autoREMfit procedure could be influenced by the tightness or openness of the ear coupling. Figure 5 shows a comparison of the mean frequency-specific fitting error (65 dB SPL input) for Audiogram A for the two different couplings that were used. First, observe that for all frequencies, the mean differences from target are small (<5 dB), certainly within the boundary of published fitting standards. If we compare the fitting error for the open vs. closed fitting conditions, we see only minor differences, and the mean fitting error for the key frequencies (500 Hz to 4000 Hz) was essentially identical (~2 dB).
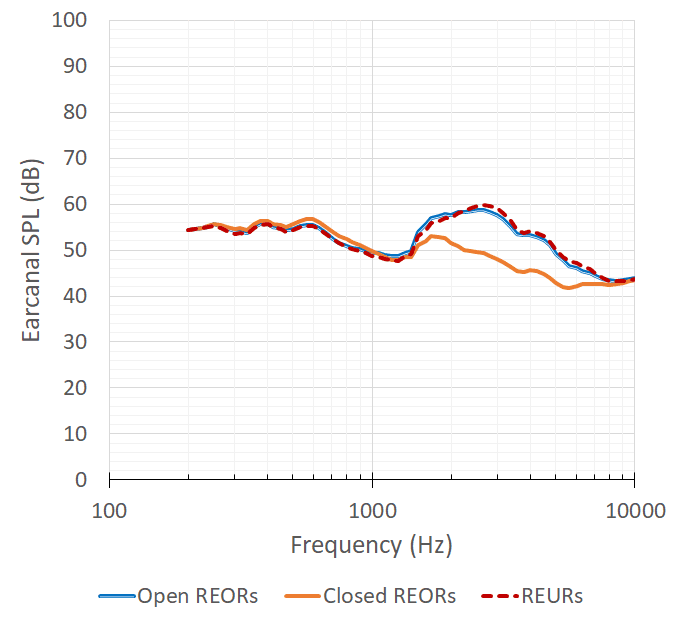
REORs for ear couplings. To ensure that the two different couplings were indeed different regarding the tightness of the fit, REORs for both types were assessed for all participants. The mean REORs are shown in Figure 6. Included as a reference is the mean REUR for the participants. Observe that mean REORs for both ear pieces are essentially equal to the mean REUR in the lower frequencies, until the 1200 Hz region. At that frequency region, the open fitting REOR continues to resemble the output of the REUR, while the closed coupling REOR begins to show some attenuation, falling 8-10 below the REUR for the higher frequencies. This finding supports the perspective that the two different couplings were indeed different regarding the tightness of the fitting, although the REOR for the “closed” fitting did not have the effect typically observed for more traditional closed custom earmolds, where we might see an REOR that reveals attenuation effects in the lower frequencies, and falls 15-20 dB below the REUR in the higher frequencies.3,18
Audiogram B autoREMfit. One of our research questions was to determine if the fit-to-target accuracy of autoREMfit was influenced by the degree of hearing loss. As shown in Figure 1, Audiogram B has considerably more low- and mid-frequency loss than Audiogram A. Figure 7 shows the Audiogram B NAL-NL2 targets, the mean REARs for the manufacturer’s First-Fit (NAL-NL2 with no programming changes), and the mean REARs for the autoREMfit. These values are for closed fittings; results in the three different panels are for inputs of 50 dB SPL, 65 dB SPL and 80 dB SPL (autoREMfit was conducted for the 65 dB input). As with Audiogram A, we see a poorer match to targets across all input levels with the manufacturer’s First-Fit than with the autoREMfit, along with a close fit-to-target for the 65 dB SPL input autoREMfit across frequencies.
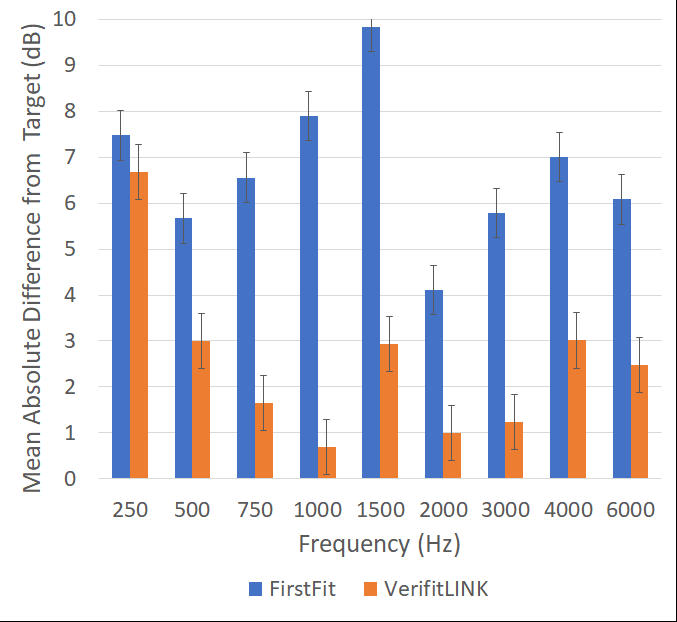
The frequency-specific fitting error for First-Fit and the autoREMfit with Audiogram B closed coupling using a 65 dB SPL input are shown in Figure 8. Note that the fitting errors for VerifitLINK autoREMfit are small, and substantially better than the manufacturer’s software First-Fit. Except for 250 Hz, no mean fitting error is worse than 3 dB, and for some frequencies, it is at or near 1 dB. If we compare these autoREMfit fitting errors to those for Audiogram A (see Figure 5), there is little difference. This suggests, at least for the audiograms selected for this study, the accuracy of autoREMfit does not vary significantly as a function of hearing loss. Of course, if we were to select an audiogram where the fitting targets exceeded the amount of gain possible from the hearing aids, or called for gain that would result in acoustic feedback, we would then expect the fitting errors to increase.
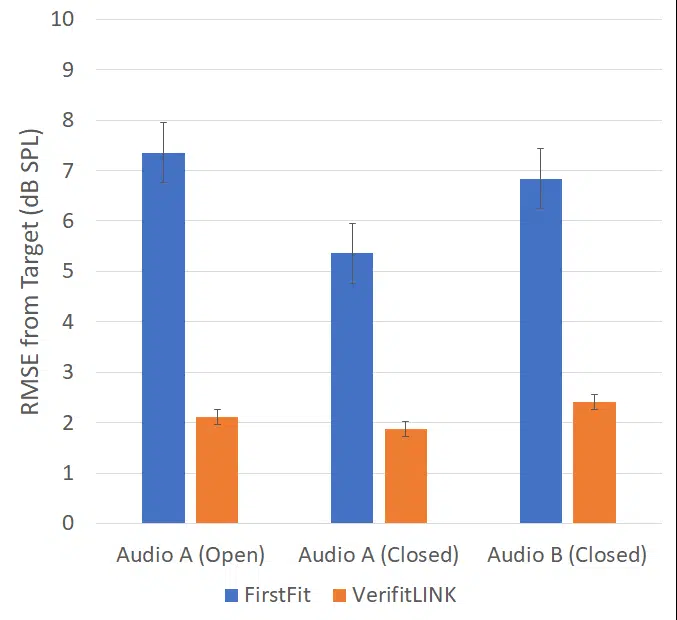
To summarize the fittings errors that were measured for the three different audiogram and coupling conditions, we calculated the mean root mean square (RMS) error for the key frequencies (500 to 4000 Hz) for the 65 dB SPL input. These values are shown in Figure 9 for both the First-Fit and for the VerifitLINK autoREMfit. The mean RMS error for the First-Fit was ~5-7 dB for the different audiogram/coupling conditions. This is consistent with the fitting error for the NAL-NL2 First-Fit shown in previous research,4,5 and also similar to the First-Fit RMS error reported by Folkeard et al14 for the DSLv5. The mean RMS error for the VerifitLINK autoREMfit procedure was at or near 2 dB for all three audiogram/coupling conditions —a very acceptable value for clinical practice.
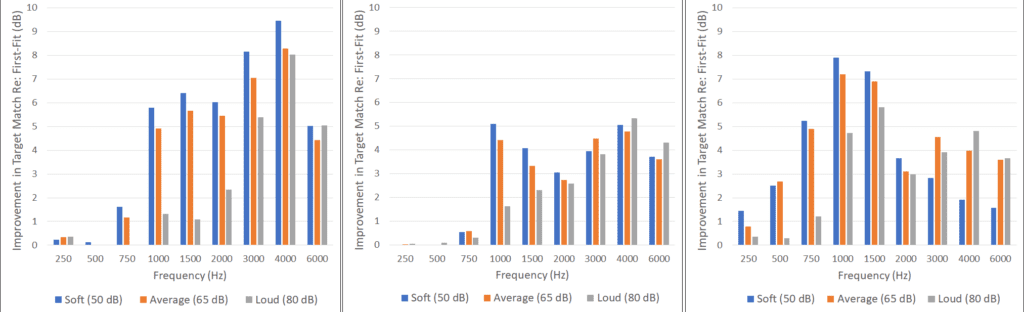
Improvement for 50 and 80 dB SPL inputs. Recall that in this Signia/VerifitLINK implementation, autoREMfit programming adjustments are based on target deviation for a 65 dB SPL input. We questioned if the improvement observed for 65 dB SPL fit-to-target relative to First-Fit would also be present for soft and loud inputs. Shown in Figure 10 is the frequency-specific fitting error benefit following autoREMfit for all three inputs for the three different test conditions. That is, how much smaller did the fitting error become as a result of conducting the autoREMfit procedure (compared to the NAL-NL2 First-Fit). Observe that for all three test conditions, the benefit that resulted from autoREMfit for soft inputs was equal to or greater than that for the 65 dB SPL input for most frequencies. In general, improvement for the 80 dB SPL input was the same or slightly less than that of the 65 dB SPL input, perhaps because the NAL-NL2 First-Fit was slightly closer to target for this input level.
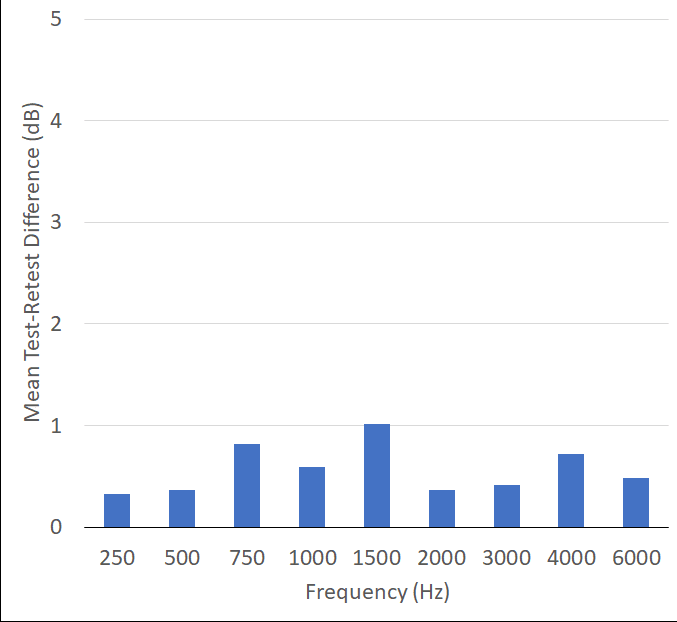
Test-retest for autoREMfit. To this point, we have shown that the VerifitLINK autoREMfit procedure provides a close fit to target, but we also wanted to assess the reliability. This question was examined for the Audiogram B closed coupling condition for the 65 dB SPL input level. Following the initial testing, the autoREMfit procedure was repeated beginning with detection of the devices while maintaining the probe tube placement. Mean frequency specific test-retest values are shown in Figure 11. These results reveal excellent test-retest for this autoREMfit implementation, with no values greater than 1 dB across frequencies.
Summary and Conclusions
The current study investigated a recent implementation of Audioscan’s VerifitLINK as integrated within Signia Connexx fitting software. Our results have shown that this VerifitLINK autoREMfit approach provides a very close match to NAL-NL2 prescriptive targets across frequencies, particularly for an average speech input. With a mean RMS error of only ~2 dB (see Figure 9), we believe this match-to-target is comparable, or possibly even better than what would be obtained by an experienced clinician. The autoREMfit procedure also was a much closer fit-to-target than what was obtained using the manufacturer’s NAL-NL2 First-Fit across all input levels evaluated.
Closer-to-target seems like a good thing, but it is reasonable to ask, how much difference (in dB fitting error) really makes a difference regarding patient performance in the real world? If we consider that speech recognition is the primary benefit resulting from hearing aid use, it has been suggested that the aided speech intelligibility index (SII) can be used to obtain an indication of the benefit that might be obtained, and perhaps also used to determine the appropriateness of a given fitting (see Scollie19 for review).
Using a given SII to predict speech understanding is not straightforward. Most background research was conducted with normal hearing adults and the function represents listening in quiet. Variance among patients with sensorineural hearing loss is greater, due to the nature and extent of the pathology. Also, the SII is considerably influenced by the speech recognition material, not to mention the proficiency of the talker and listener. Data are available showing predicted speech recognition as a function of the SII for several different types of speech material such as: digits, known sentences, novel sentences, monosyllables, and nonsense syllables.
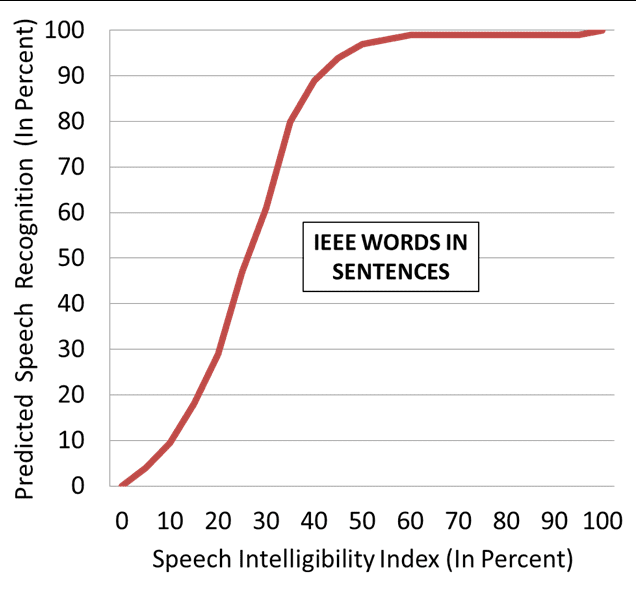
For the average hearing aid user, a common problem is understanding words in sentences, so that is the SII performance function we’ll use for our discussion here, illustrated in Figure 12. As shown, the slope of this function is relatively steep, with the 50% point at an SII of around 0.25, and near maximum performance (~98%) occurring at an SII of 0.60.
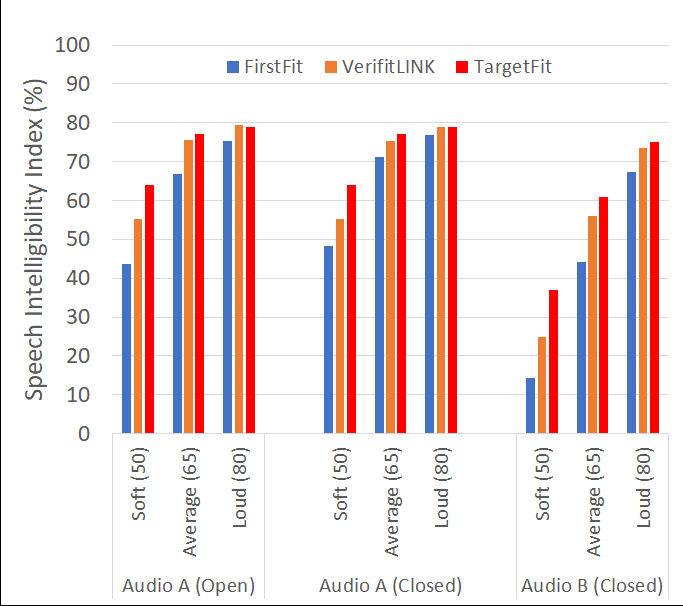
In Figure 13, we show the mean SIIs for the three different audiogram/coupling conditions in our study for the three different inputs. As expected based on the previously mentioned target matching behavior, we see an improvement in the mean SIIs for the autoREMfit relative to the First-Fit for all input levels across all conditions. If we look at the values for the moderate hearing loss, Audiogram B, we see that for average speech inputs, autoREMfit improved the SII by 12%–44% to 56%. Our performance function (see Figure 12), however, would suggest that this will not have a large impact on speech recognition for average-level inputs, simply because a 44% SII already gives us a predicted score of 94% correct. A much different picture emerges for soft speech inputs. Here we again see a 12% SII improvement (14% vs 26%), except now we would predict that this increase in audibility would provide a ~30% increase in speech understanding.
It is important to remember, that these predictions are for speech in quiet. Background noise, which is present in many everyday listening conditions, will alter the aided SII (see Killion and Mueller20 for discussion of the effects of noise and the SII). If we assume that most background noise is in the lower frequencies, and that most aided SII improvement is in the higher frequencies, then the SII improvement observed in quiet listening will be relatively similar when background noise is present. Going back to our earlier example for Audiogram B (65-dB-SPL input), if both of these SIIs were reduced by 15% because of background noise, then the benefit of the autoREMfit procedure for speech understanding (compared to First-Fit) would be about 35% (speech recognition of 60% compared to 95%). As we said, predicting speech recognition from the SII is not always straightforward, but it does provide some general guidance, and can be helpful in counseling. Thankfully, a number of verification system manufacturers generate unaided and aided SII values along with associated counseling tools to support the use of this measure in your fitting procedures and counseling.
In general, our findings lead to the following conclusions regarding the Signia/VerifitLINK autoREMfit implementation:
- The mean RMS fitting error (@ 65 dB SPL input) for the NAL-NL2 formula was small, at or near 2 dB. Mean test-retest was also very small—no greater than 1 dB at any frequency.
- The fitting error did not change significantly as a function of open vs. closed ear couplings for the same audiogram/NAL-NL2 fitting targets.
- The fitting error did not change significantly as a function of the degree of hearing loss, for the two different cases used in this study.
- While Signia’s implementation of VerifitLINK considers target deviation for the 65 dB SPL input, improvements in fit-to-target also were observed for soft (50 dB SPL) and loud (80 dB SPL) inputs.
- Overall, across frequencies and input levels, the VerifitLINK autoREMfit procedure revealed approximately 4–6 dB improvement compared to manufacturer’s First-Fit. Given the added advantage of being time-efficient, the autoREMfit implementation described above would appear to be a useful tool for HCPs who want to ensure that hearing aids are properly verified to prescriptive targets following best practice fitting guidelines.
Acknowledgement
The authors wish to acknowledge the data collection assistance of Navid Taghvaei, AuD, of Sivantos, Inc, and Rebecca Gomer, AuD, of Gomer Hearing Center, Allen, TX.
References
- Keidser G, Dillon H, Flax M, Ching T, Brewer S. The NAL-NL2 prescription procedure. Audiol Res. 2011;1:88-90.
- Scollie S, Seewald R, Cornelisse L, Moodie S, Bagatto M, Laurnagaray D, Beaulac S, Pumford J. The Desired Sensation Level Multistage Input/Output algorithm. Trends Amplif. 2005;9(4):159-197.
- Mueller HG, Ricketts TA, Bentler RA. Speech Mapping and Probe Microphone Measures. San Diego: Plural Publishing;2017.
- Sanders J, Stoody T, Weber J, Mueller HG. Manufacturers’ NAL-NL2 fittings fail real-ear verification. Hearing Review. 2015;21(3):24-32.
- Amlani AM, Pumford J, Gessling E. Real-ear measurement and its impact on aided audibility and patient loyalty. Hearing Review. 2017;24(10):12-21.
- International Society of Audiology. Good practice guidance for adult hearing aid fittings and services– Background to the document and consultation. 2005. Available at: https://www.yumpu.com/en/document/view/23519946/good-practice-guidance-for-adult-hearing-aid-fittings-and-services-
- British Society of Audiology. Guidance on the verification of hearing devices using probe microphone measurements. May 2018. Available at: https://www.thebsa.org.uk/wp-content/uploads/2018/05/REMS-2018.pdf
- Mueller HG, Picou EM. Survey examines popularity of real-ear probe-microphone measures. Hear Jour. 2010;63(5):27-32.
- Mueller HG. 20Q: Real-ear probe-microphone measurements–30 years of progress? January 13, 2014. Available at: https://www.audiologyonline.com/articles/20q-probe-mic-measures-12410.
- Mueller HG, Ricketts TA. Hearing aid verification: Will autoREMfit move the sticks? July 9, 2018. Available at: https://www.audiologyonline.com/articles/20q-hearing-aid-verification-226-23532
- Mueller HG. Probe-microphone measurements: 20 years of progress. Trends Amplif. 2001; 5(2):35-68.
- Mueller HG. Signia Expert Series: Is autoREMfit a reasonable verification alternative? August 21, 2019. Available at: https://www.audiologyonline.com/audiology-ceus/course/signia-expert-series-autoremfit-reasonable-32808
- Baumann J, Powers T, Branda E. Validity, reliability, and efficiency of the Signia AutoFit procedure. Hearing Review. 2018;25(9):26-30.
- Folkeard P, Pumford J, Abbasalipour P, Willis N, Scollie S. A comparison of automated real-ear and traditional hearing aid fitting methods. Hearing Review. 2018;25(11):28-32.
- Koehler EE, Kulkarni S. Fast and easy fitting and verification with integrated real-ear measurement. Hearing Review. 2014;21(10):36-40.
- Latzel M, Denys S, Anderson S, Francart T, Wouters J, Appleton-Huber J. An integrated REM system with proven accuracy and reliability. Hearing Review. 2017;24(10):36-39.
- Folkeard P, Pumford J, Pietrobon J, Scollie S. Evaluation of Probe Guide: Software-assisted probe tube placement in hearing aid fittings. Hearing Review. 2019;26(11).
- Pumford J. Considerations in real-ear measurement: Points to ponder. Canadian Audiologist. 2018;5(3). Available at: https://canadianaudiologist.ca/real-ear-measurement-feature/
- Scollie S. Using the Aided Speech Intelligibility Index in Hearing Aid Fittings. September 10, 2018. Available at: https://www.audiologyonline.com/articles/20q-aided-speech-intelligibility-index-23707
- Killion, MC, Mueller, HG. Twenty years later: A NEW Count-The-Dots method. The Hearing Journal, 2010; 63 (1): 10-17.
Citation for this article: Pumford J, Mueller HG. Using autoREMfit for hearing aid fitting and verification: Evidence of accuracy and reliability. Hearing Review. 2020;27(8):24-27.