Tech Topic: Hearing Aids | March 2014 Hearing Review
By Francis Kuk, PhD, Chi-Chuen Lau, PhD, Petri Korhonen, MS, and Brian Crose, MS 
Traditionally, hearing aid processing is evaluated at a conversational level input. The advent of wide dynamic range compression (WDRC) hearing aids has prompted the evaluation of hearing aid processing at levels above and below the conversational level.1 This change in test protocol (of testing at multiple input levels) allowed a more effective demonstration of WDRC hearing aids and facilitated the acceptance of such a technology.
This suggests that the evaluation of hearing aid benefits should not be restricted just to the conversational or typical levels. Furthermore, it demonstrated that the right test conditions must be used in order to properly evaluate the efficacy of a particular hearing aid feature.
Another example is the evaluation of the True Input Technology2 used in the Widex DREAM hearing aid. This paper summarizes our considerations in verifying the efficacy of this technology feature and the outcome of the evaluation.
Rationale of New Input Technology
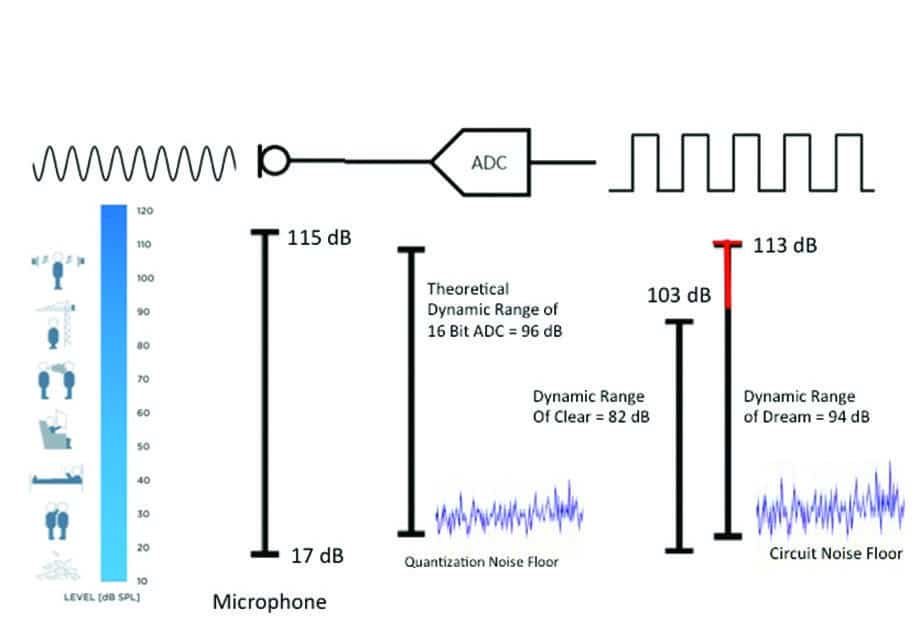
Baekgaard et al3 provided a detailed explanation on the True Input Technology used in the DREAM hearing aids. Briefly, this technology allows digital hearing aids that use a 16-bit analog-to-digital converter (ADC) to realize as much of the 96 dB theoretical dynamic range as possible.
Current digital hearing aids have an input limit that ranges from 96 dB SPL to 105 dB SPL. Input levels above this limit are either clipped or compressed. Typically, the higher limit is achieved at the expense of a higher noise floor.
True Input Technology doubles the input voltage through a patented “transformer” action without increasing the circuit noise level prior to the ADC. This allows the input limit to extend to 113 dB SPL without an increase of the noise level. Considering that today’s analog hearing aid microphones have a dynamic range from around 17-115 dB SPL, an ADC that has an input dynamic range of 17 to 113 dB SPL would have fully utilized the potential of current microphone and ADC technologies.
Figure 1 compares the dynamic ranges of everyday sounds, an analog hearing aid (HA) microphone, a 16-bit ADC (theoretical), a high-end digital hearing aid (CLEAR), and the DREAM hearing aid. An additional benefit of True Input Technology is a 20% reduction in current drain—bringing the current drain from 1.1 mA to 0.89 mA.
Potential Benefits
The extension of input limits from 103 dB to 113 dB SPL would suggest potential perceptual advantages at very high input levels. Thus, testing at a soft to conversational level (ie, under about 70 dB SPL) will probably only reflect insignificant perceptual differences between the DREAM hearing aid and any comparison hearing aids. This is especially the case when all commercial hearing aids have an upper limit above 96 dB SPL.
There are many meaningful real-life conditions that exceed 96 dB SPL. The most obvious is music perception. Chasin and Hockley4 reported that the crest factor of music is typically 20 dB whereas speech is around 12 dB. This suggests music that is played at an average level of 90 dB would have peaks at 110 dB SPL. This is enough to cause intermittent saturation at the input stage. Considering that many musical instruments are played close to the individual’s ears (eg, violin), it is no wonder that many musicians reported distortions such as a “crackling,” “raspy” quality from the hearing aids while playing their instruments.5 Chasin6 reported that a hearing aid with a 113 dB SPL input limit was more preferred than one with a 103 dB SPL input limit when listening to music played at a high intensity level.
An opera singer or a person speaking in a loud voice also may notice distortions from their hearing aids. Although one may expect that the average level of loud voice to be around 75-80 dB SPL to the average listener, it would register 95 to 100 dB SPL at the speaker’s ears.7 When one also considers that speech has a crest factor of 12 dB, the peaks of one’s own loud voice occur at 107 to 113 dB SPL at the speaker’s own ears. This level is sufficient to saturate the input stage of most digital hearing aids.
Many daily environments are loud and noisy. A typical walk in the streets of Manhattan could easily reach 90-100 dB SPL. A noisy restaurant could range in noise level from 90 to 105 dB SPL. A sports event could have noise levels ranging from 90 to 115 dB SPL. These levels are sufficient to saturate the input stage of most digital hearing aids and reduce the dynamic cues within the input signals.
Speech communication in these environments becomes more difficult. The high background noise level also requires that speech be produced at an equally (if not more) intense level because of the Lombard effect.8 Unfortunately, these higher speech levels saturate the input stage even more. This leaves the wearer with a completely “smeared” input and an impression of “muffled” sound quality and poor speech understanding.
This affects all hearing impaired persons, but can be especially problematic for those who need the temporal cues within the input signals for understanding9—including those with more than a moderate degree of hearing loss and those who may be cognitively challenged. Assessment of speech-in-noise (SIN) ability at high input level situations could be an approach to evaluate the efficacy of True Input Technology.
A distorted (temporally and spectrally) input signal at the input stage will remain distorted throughout the signal processing path of the hearing aid. No amount of digital signal processing (DSP) can restore the integrity of the input signal.
Unfortunately, the integrity of the input signal could affect the adaptive processing of the hearing aid at the higher input levels. This may be seen with the fully adaptive directional microphone. At a high input level, but with a low hearing aid input limit, the multichannel adaptive directional microphone remains in an omnidirectional mode. However, it adapts to the appropriate directional mode at the same high input level when the hearing aid input limit is not exceeded. This suggests that testing the directional microphone at a high input noise level may be an effective metric to evaluate True Input Technology.
These considerations prompted us to complete two separate studies at ORCA-USA using different tools/test conditions to demonstrate the efficacy of True Input Technology.
Figure 1. (Click image to enlarge.) Comparison of input dynamic ranges of everyday sounds, analog microphones, 16-bit ADC, CLEAR hearing aids, and DREAM hearing aids.
Study 1: Laboratory SIN Test to Demonstrate Speech Understanding at High Noise Levels
A total of 10 participants with a mild to moderately severe hearing loss participated in this study. They ranged in age from 27 to 81 years with an average of 64 years. Eight of the 10 were experienced hearing aid wearers.
In order to restrict the comparison to the effect of the input stage alone, we compared the laboratory performance between the DREAM 440-m-CB and the CLEAR440-m-CB models. Both are 15-channel wireless hearing aids with the identical electroacoustic characteristics and feature set. Although the CLEAR already has a high input limit of 103 dB SPL (which is higher than many high-end digital hearing aids as mentioned previously), the input limit of the DREAM is even higher (113 dB SPL). This consideration would require the speech stimuli to be presented above 103 dB SPL in order to demonstrate the advantage of the higher input limit.
Special considerations are required to evaluate at an input level exceeding 103 dB SPL. First, the loudspeakers used in most clinical and research facilities cannot deliver such a high output when measured at 1 m. Test subjects would need to be very close to the loudspeakers during testing. Second, it could be uncomfortable for subjects to listen at a high input level for any period of time. Considering that it is the effect of the input saturation that we are interested in measuring, and that audibility is not an issue at a high input level, one may record the output of the hearing aids and test subjects using the recorded output at a more tolerable level.
Procedure. The speech stimuli were recorded in an IAC Model 1205-A soundbooth (ambient noise level of 21 dBA) through either a CLEAR or a DREAM hearing aid placed on the Knowles Electronics Manikin for Acoustic Research (KEMAR) right ear. Each loudspeaker was placed at a distance of 40 cm from the center of KEMAR. The output of each hearing aid was recorded through a Zwislocki coupler (DB4005) and filtered through a diffuse field inverse (DFI) filter.
The full lists of the NU-6 word lists were used for speech testing in noise. The NU-6 test stimuli were presented from 0° and uncorrelated speech weighted noise (NU-6 speech spectrum) was presented at 90°, 180°, and 270°. The noise was presented at an overall level of 106 dBC. Speech was presented at 103, 106, and 109 dBC for three different signal-to-noise (SNR) ratios of -3, 0, and +3. The hearing aids were programmed with a 50 dB flat hearing loss, and two hearing aid conditions were recorded: 1) Omnidirectional microphone with no noise reduction, and 2) Directional microphone with classic noise reduction on. A different list was presented for each condition.
Neither the tester nor the participants were aware of the test conditions (ie, double-blinded). All stimuli were presented through TDH-50P supra-aural headphones. The output level of the hearing aid was typically within 1 dB of the input level. A short sentence on the CD allowed the tester to adjust the level of the sentence until it was “loud but not uncomfortable.” Typically, this level was between 5 and 10 dB off the maximum output level of the hearing aid (typically 90 to 95 dB SPL). Subjects took a 5 minute break after every word list (about 10-15 minutes/list).
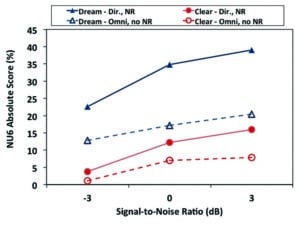
Figure 2. Average percentage correct on NU-6 at -3, 0, and +3 SNR for DREAM and CLEAR in two modes (omnidirectional, no NR) and (directional, NR).
Results. Figure 2 summarizes the absolute NU-6 scores of subjects across SNRs (-3, 0, +3) for the two hearing aid conditions (“omni, no NR” and “dir mic, NR”) for each of the hearing aids (DREAM and CLEAR). There are several immediate observations:
1) As expected, performance improved as SNR improved. For the CLEAR, it improved from less than 5% at -3 SNR to 15% at the +3 SNR in the directional mode (10% improvement). For the DREAM, it improved from 23% at -3 SNR to 38% at the +3 SNR in the directional mode (15% improvement).
2) The absolute scores of the DREAM, even in the “omnidirectional, no NR” mode (13% to 20% from -3 to +3 SNR), are higher than that of the CLEAR, even in its (directional, NR) mode (3% to 15% from -3 to +3 SNR). Indeed, the performance of the DREAM in the “omnidirectional, no NR” mode at a -3 SNR was comparable to the CLEAR in the “directional, NR” mode at a +3 SNR. This suggests a potential SNR improvement of greater than 6 dB! This supports the importance of a cleaner input signal to the DSP processor. A cleaner input, even in the absence of a directional microphone, can yield better performance than a distorted input to the DSP processor, even with a directional microphone.
3) The absolute scores from the CLEAR, even in the directional mode, ranged from 5% to 15%. This may explain why people with hearing loss have difficulties with speech understanding in loud noisy places even when wearing their hearing aids. In contrast, the performance with the DREAM ranged from 23% to almost 40% for the same conditions.
4) The separation in performance between the “omnidirectional, no NR” mode and the “directional, NR” mode (ie, the directional benefit) was much narrower for the CLEAR than the DREAM. The directional benefit for the CLEAR ranged from 1% at -3 SNR to 6% at +3 SNR. The directional benefit for the DREAM was about 10% at -3 SNR to 20% at 0 and +3 SNR. This suggests that the directional/NR mechanism in the CLEAR was compromised whereas the DREAM directional microphone was operational.
5) The benefit of the DREAM over the CLEAR across SNRs was about 20-25% in the directional mode and about 10% in the “omnidirectional, no NR” mode. If one compares the performance of the DREAM directional mode to the CLEAR omnidirectional mode (ie, across modes comparison), a difference of approximately 23% to 35% is realized.
Repeated-measures ANOVA were conducted for each SNR condition. The results showed a significant difference (p < 0.05) between hearing aids and among the hearing aid settings at all 3 SNRs. Results for the DREAM were always better than the results with the CLEAR. Results with the directional microphone were always better than the results with the omnidirectional microphone.
This study confirms that the use of recorded stimuli through the DREAM and CLEAR hearing aids is a practical way to demonstrate the difference in high level processing between two hearing aids. More specifically, it shows that the DREAM hearing aid with True Input Technology yielded consistently higher speech recognition scores than the CLEAR hearing aids under the same listening condition and hearing aid setting. Considering that the CLEAR already utilizes sophisticated signal processing and ADC schemes comparable to, if not better than, many high-end digital hearing aids, we expect similar observations when the DREAM is compared to other high-end hearing aids.
Study II: Real-world Questionnaire on Listening at High Input Levels
One may be interested to compare how the DREAM is perceived in everyday situations where the input sounds may be loud also. While many questionnaires include items that address listening at a high input level (eg, APHAB10), none is targeted to high input levels only.
Thus we created a questionnaire that is targeted to evaluate performance in everyday environments where the typical input sounds may be loud. The Listening at Loud Levels (LLL) questionnaire includes 20 items that cover listening at home, transportation, restaurants, music, and social situations. The hearing aid wearers evaluate how much difficulty they have in each situation. This could be difficulty on speech understanding, listening comfort, or sound quality (or distortion). They use a 7-category scale to judge the amount of difficulty in each situation. “A” would suggest “always (or 99% of time) having difficulty” and “G” would suggest “never having any difficulty.” The percentage score associated with each category was used to estimate performance. A higher score would represent greater difficulty. A copy of the questionnaire is included in Appendix A in the online version of this article at www.hearingreview.com.
Procedure. To examine the usefulness of the LLL questionnaire and to determine the real-life benefits of the DREAM hearing aid, we recruited 10 new subjects (2 male, 8 female) with a moderate to moderately severe hearing loss. None of these subjects classified themselves as musicians. The ages of the subjects ranged from 28 to 84 years with a mean age of 70.4 years (SD = 17.5 years).
Eight of the 10 subjects were experienced hearing aid wearers with an average of 12.4 years. Subjects’ own hearing aids included high-end hearing aid models from Phonak, Miracle Ear, ReSound, and Widex. Five of them wore open-ear BTEs (RICs), and 3 wore custom ITC models. Only the data from the 8 experienced wearers are reported here, since it involved a comparison with subjects’ own hearing aids.
Subjects completed the LLL questionnaire on their own hearing aids first. They were then fit binaurally with DREAM440 m-CB BTEs using thin tubes and custom hard CAMISHA shells. The default gain and feature settings (supergain, HD locator, and speech enhancer) were used. Subjects wore the hearing aids home for 1 month and were asked to complete the LLL questionnaire at the end of the month.
Results. Subjects wore the DREAM hearing aids for an average of 10.37 hours/day (SD = 4.49 hrs). Figure 3 summarizes the mean LLL difficulty scores based on the criteria of speech understanding, listening comfort, and distortion of sounds in loud, noisy environments. As a reference, a score of 50% would suggest “having difficulties half of the time” whereas a score of 25% would suggest “having difficulties occasionally.”
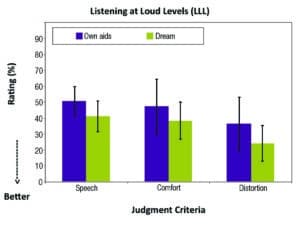
Figure 3. Mean LLL ratings for own aids and Dream hearing aids (n = 8) using judgment criteria of speech understanding (speech), listening comfort (comfort), and distortion.
There are two immediate observations:
1) The ratings for the DREAM are in general lower (or better) than the subjects’ own hearing aids across all criteria. For example, the mean rating for speech with own aids was 50 and it was 40 for the DREAM. The ratings for listening comfort were 47 for own aids and 38 for the DREAM. The ratings for distortion were 36 for own aids, and 22 for the DREAM. These ratings suggest that the DREAM reduced the amount of noted difficulties from “half the time” to somewhere between “half the time” and “occasionally.”
2) The rating decreased across the criteria of speech, comfort, and distortion, suggesting less difficulty with distortion than with speech understanding. For example, with the DREAM, an average rating of 40% was noted on the speech understanding criterion but only 25% on the distortion criterion. This suggests that speech understanding and listening comfort are rated with more difficulties than the perception of distorted sounds in daily loud listening situations.
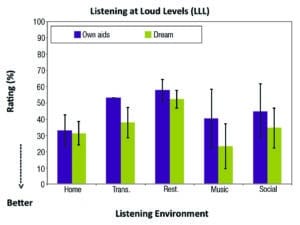
Figure 4. Mean LLL ratings for own aids and Dream hearing aids (n = 8) grouped according to the types of listening environments.
Figure 4 displays the average LLL ratings in each type of listening environment. Again, two observations are evident:
1) The DREAM hearing aid was rated lower (or better) than the subjects’ own aids in all situations. For example, the average rating for the home environment was 33 with own aids and 30 for the DREAM. For transportation, the rating was 53 for own aids and 38 for the DREAM. For restaurants, the own aid was rated at 58 and the DREAM was rated at 52. The mean rating for music was 40 with own aids and 23 for the DREAM. The mean rating for social situations was 50 with own aids and 35 for the DREAM. The greatest improvement was seen in the “transportation” and “music” categories.
2) The amount of rated difficulties also varied among situations. The greatest amount of difficulty was reported in “transportation” and “restaurant” followed by “social” and then “music” and “home.”
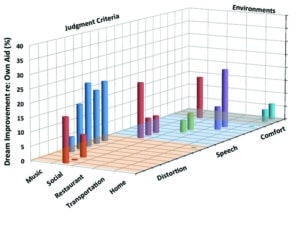
Figure 5. 3D plot of magnitude of improvement (DREAM minus own aids) across 5 listening categories using the criteria of speech understanding, listening comfort, and distortion.
Figure 5 displays the mean benefit (reduction of difficulty) of the DREAM hearing aid over the subjects’ own hearing aids for each item on the questionnaire grouped according to listening environments and judgment criteria. One observes that most benefits under the “social” category were improvements in the sound quality (distortion), listening comfort, and speech understanding. The improvements seen under the “music” category were all sound quality (distortion) in nature. The improvements seen “at home” were improvements in listening comfort. The improvements seen for the “restaurant” and “transportation” categories were in speech understanding.
Conclusions
These two studies illustrate how understanding the operation limits of the specific hearing aid feature helps in the design of studies. The potential benefit of a feature may be masked if the tools or test conditions used during the evaluation are inappropriate or sub-optimal. Under the optimal test conditions, the current studies demonstrate that the benefits of True Input Technology are not only applicable to music appreciation,6 but also extend to improved speech understanding and listening comfort in situations (both laboratory and real life) where the input levels are high or very high. This could include noisy restaurants and parties, traffic, theaters, etc.
Considering hearing aid satisfaction depends on the percentage of listening situations in which satisfaction is obtained,11 one would expect that True Input Technology, by virtue of the increased number of satisfied listening situations, improves real-life hearing aid satisfaction.
REFERENCES and APPENDIX A can be found in the digital edition of this article at http://hr.alliedmedia360.com
Original citation for this article: Kuk, F., L Chi-Chuen, P. Korhonen, B. Crose. Evaluating hearing aid processing at high and very high input levels. Hearing Review. 2014;21(3): 32-35.

