By Douglas L. Beck, AuD, David P. Speidel, MS, and Michelle Petrak, PhD
The auditory steady-state response (ASSR) can be thought of as an electrophysiologic response to rapid auditory stimuli. The goal of ASSR is to create an estimated audiogram from which questions regarding hearing, hearing loss, and aural rehabilitation can be answered.
Further reading: Developments in Auditory Steady-State Responses (ASSR)
ASSR allows the hearing care professional to create statistically valid audiograms for those unable or unwilling to participate in traditional behavioral tests. ASSR relies on statistical measures to determine if and when a threshold is present. ASSR design and functionality vary across manufacturers. Authors’ note: ASSR was previously referred to as SSEP (Steady State Evoked Potential) and/or AMFR (Amplitude Modulation Following Response).
This article offers a basic orientation to ASSR, using examples based on the most recent refinements and offerings from Interacoustics.
ASSR Compared to ABR
ASSR is similar to the Auditory Brainstem Response (ABR) in some respects. For example, ASSR and ABR record bioelectric activity from electrodes arranged in similar recording arrays. ASSR and ABR are both auditory evoked potentials. ASSR and ABR use acoustic stimuli delivered through inserts (preferably).
ASSR and ABR have important differences, too. Rather than depending on amplitude and latency, ASSR uses amplitudes and phases in the spectral (frequency) domain. ASSR depends on peak detection across a spectrum, rather than peak detection across a time versus amplitude waveform (see John and Picton1). ASSR is evoked using repeated sound stimuli presented at a high repetition rate, whereas ABR is evoked using brief sounds presented at a relatively low repetition rate.
ABR recordings are most often dependent on the examiner subjectively reviewing the waveforms and deciding whether a response is present. Determining the response becomes increasingly difficult as the ABR approaches true threshold—which is when the decision (response or no response) is most important. ASSR uses an objective, sophisticated, statistics-based mathematical detection algorithm to detect and define hearing thresholds.
ABR protocols typically use clicks or tone-bursts in one ear at a time. ASSR can be used binaurally, while evaluating broad bands or four frequencies (500 Hz, 1,000 Hz, 2,000 Hz, and 4,000 Hz) simultaneously.
ABR is useful in estimating hearing thresholds essentially from 1,000 Hz to 4,000 Hz, in typical (non-ski-slope) mild-moderate-severe hearing losses. ASSR can also estimate hearing thresholds across the same range as the ABR, but ASSR offers more spectral information more quickly, and can estimate and differentiate hearing within the severe-to-profound hearing loss ranges.
The ability to detect differences in these significant hearing loss categories is very important. For example, differentiating a 75 dB versus a 95 dB hearing loss may impact decisions such as fitting traditional hearing aids on a child with a 75 dB SNHL, or considering cochlear implant options for a child with a 95 dB SNHL.
Patient Population
As is true of ABR, ASSR can be used to estimate hearing thresholds for those who cannot or will not participate in traditional behavioral measures. Therefore, primary candidates for ASSR would include: newborn infants for screenings and follow-up diagnostic assessments, babies in the neonatal intensive care unit (NICU), unresponsive and/or comatose patients, people who are suspect due to the nature of their visit (ie, workers’ compensation, legal matters, insurance claims, etc), ototoxicity monitoring, and others.
ASSR Stimulation
Currently, there is no universal standard for ASSR instrumentation. Stimulus and recording parameters and methods are designed (and may vary) by each manufacturer.
Insert earphones. Insert earphones are the stimulation delivery system of choice. Insert earphones used with ASSR allow very loud (100 dBHL or more) presentation levels. However, stimulating at very loud levels may cause a vestibular response that is potentially indistinguishable from the auditory response (as ASSR does not show the waveform in a time-based domain). Additionally, stimulating at these very loud levels can be harmful to hearing.
Broadband and frequency-specific stimuli. ASSR can be recorded using either broadband (ie, frequency nonspecific) or frequency-specific stimuli. Broadband stimuli include clicks, noises, amplitude modulated noise, and chirps. Frequency-specific stimuli include filtered clicks, band-limited chirps, narrow-band noise bursts, tone bursts, amplitude modulated narrow-band noise, or amplitude and frequency modulated pure tones.
“Chirps” are a recent addition to the broadband family,2 offering unique and useful attributes. Some newer ASSR systems use special chirp stimuli.3 Band-limited chirps provide highly synchronized stimulation of specific frequency bands.4 Using chirps and newer detection algorithms allows faster data collection, approaching half the traditional ASSR data collection time.4,5
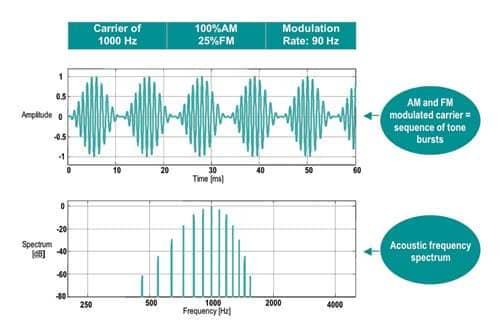
Test frequencies. Test frequencies of 500, 1000, 2000, and 4000 Hz are commonly used as ASSR carrier stimuli. These frequencies are modulated with respect to amplitude and frequency. A 100% amplitude modulation (AM) is often used at a high modulation rate (ie, >80-90 Hz). Some ASSR systems are capable of simultaneous, multiple-frequency binaural stimulation. When multiple frequencies are presented simultaneously, modulation typically occurs between 82 Hz and 106 Hz. Some manufacturers offer a 20% to 25% frequency modulation (FM), which, combined with AM, typically enhances the response as compared to AM-only.
Modulation rates. Higher modulation rates generate bioelectrical responses derived from the brainstem (like ABR) and are, therefore, less susceptible to patient state. Lower frequency modulation rates may be used (ie, 40 Hz) but do include components of the middle latency response (MLR) and are therefore influenced by test subject conditions (Figure 1).

|
| Figure 1. Example of a typical 1,000 Hz AM and FM modulated carrier stimulus and its associated spectrum. |
Analysis. ASSR analysis is based on the fact that related bioelectric events coincide with the stimulus repetition rate. Therefore, ASSR analysis is mathematically based.
The specific method of analysis will be dependent on the manufacturer’s statistical detection algorithm. ASSR analysis occurs in the spectral (ie, frequency) domain and is composed of specific frequency components that are harmonics of the stimulus repetition rate. Early ASSR systems considered the first harmonic only, whereas newer systems also incorporate higher harmonics in their detection algorithms.
For example, if the stimulus repetition rate is 90 Hz (ie, 90 stimuli per second), the ASSR will occur at 90 Hz, 180 Hz, 270 Hz, 360 Hz, etc (Figure 2). The first spectral response component (in this case, 90 Hz) will have the largest amplitude, and amplitude decreases as the harmonic number (1st, 2nd, 3rd, etc) increases. Detecting the presence of ASSR in the spectral domain means relying on amplitude and/or phase values (sometimes combined into a vector) of the first six to eight harmonics to distinguish the ASSR from ongoing random and biologic noise.

|
| Figure 2. FFT Spectral Analysis showing the detection of the modulation rate and harmonics in the presence of randomly occurring noise. |
Electrode placement. Electrode placement for ASSR is often the same or similar to traditional recording montages used for ABR recordings. The two active electrodes are placed at or near the vertex, and at the ipsilateral earlobe/mastoid, whereas the ground electrode is placed on the low forehead. If the instrument is collecting data simultaneously from both ears, a two-channel preamplifier is used to benefit from the binaural electrode montage. When a single channel recording system is used to detect activity from a binaural presentation, a common reference electrode may be located at the nape of the neck.
Filtering, amplification, and artifact reject. ASSR filter settings are not like ABR settings. For ASSR, depending on the specific situation, the high pass filter might be approximately 40 Hz to 90 Hz, and the low pass filter might be between 320 Hz and 720 Hz. Typical filter slopes are 6 dB per octave. Gain settings of 10,000 are common for ASSR. Artifact reject is left “on.”
As is true with ABR, it is advantageous to have manual “override” to allow the clinician to make decisions during the test, such as a change in stimulus level at individual frequencies. As data accumulates (Figure 3), the clinician may toggle between view modes to see how the estimated audiogram is progressing and may apply course corrections as needed.

|
| Figure 3. Sample of ongoing ASSR. Green indicates response, red indicates no response. |
Normative Data and General Trends
Most ASSR equipment provides correction tables for converting measured ASSR thresholds to estimated HL audiograms. In general, estimated ASSR-based audiograms provide similar information to behavioral-based audiograms.
Picton et al6 provided tables of corrective values indicating that ASSR thresholds are within 10 dB to 15 dB of audiometric thresholds. There are variances across studies, and actual correction data depends on many variables such as: equipment used, frequencies collected, collection time, age of the subject, sleep state of the subject, stimulus parameters used, and more.
Regardless of the equipment used, the clinician should refer to the data and references provided by the manufacturer when estimating audiograms.
Discussion
ASSR has been shown to be reliable and effective in predicting hearing thresholds. ASSR offers multiple auditory and electrophysiologic synergies previously unavailable.

|
| Figure 4. The Interacoustics System showing the dB test level of the ASSR recording compared to the estimated audiogram based on an established conversion table. |
Nonetheless, Jerger and Hayes’ “cross-check” principle7 is valid, wise, and recommended.8 In particular, ASSR results have been reported with significant stimulus artifacts in unusual situations (ie, low-frequency stimuli presented at 100 dB HL or above), and other artifacts have been noted, too (see Stapells et al9). Bone conduction studies are not yet definitive, and direct application of ASSR to various etiologies (eg, Meniere’s disease, acoustic neuroma, auditory neuropathy, etc) is under investigation across the globe.

|
| ABRs or ASSRs? The Application of Tone-Burst ABRs in the Era of ASSRs. by James W. Hall III, PhD, August 2004 HR. |
ASSR is an exciting technology that provides quick and reliable multiple frequency, ear-specific hearing threshold information. ASSR continues to “raise the bar” with regard to test speed and accuracy, and the systems are available from a handful of manufacturers.
In this article, we’ve offered examples based on the most recent refinements and offerings from Interacoustics. We anticipate further development and refinement, as continually improving protocols and accuracy become available in the future.
Acknowledgements
The authors thank Claus Elberling, PhD, for his knowledge, edits, and thoughtful comments and insight throughout the preparation of this manuscript.
References
- John MS, Picton TW. MASTER: a Windows program for recording multiple auditory steady-state responses. Comput Methods Programs Biomed. 2000;61:125-150.
- Elberling C, Don M, Cebulla M, Stürzebecher E. Auditory steady-state responses to chirp stimuli based on cochlear traveling wave delay. J Acoust Soc Am. In press.
- Stürzebecher E, Cebulla M, Elberling C, Berger T. New efficient stimuli for evoking frequency-specific auditory steady-state responses. J Am Acad Audiol. 2006;17:448-461.
- Elberling C, Cebulla M, Stürzebecher E. Simultaneous multiple stimulation of the ASSR. Paper presented at: ISAAR (International Symposium on Auditory and Audiological Research) Auditory Signal Processing in Hearing-Impaired Listeners; Denmark, 2007. In press.
- Cebulla M, Stürzebecher E, Elberling C. Objective detection of auditory steady-state responses: comparison of one-sample and q-sample tests. J Am Acad Audiol. 2006;17:93-103.
- Picton TW, Dimitrijevic A, Perez-Abalo M-C, van Roon P. Estimating audiometric thresholds using auditory steady-state responses. J Am Acad Audiol. 2005;16:140-156.
- Jerger JF, Hayes D. The cross-check principle in pediatric audiometry. Arch Otolaryngol Head Neck Surg. 1976;102:614-620.
- Joint Committee on Infant Hearing. Year 2000 position statement: Principles and guidelines for early hearing detection and intervention programs. Pediatrics. 2000;106:798-817.
- Stapells DR, Herdman A, Small SA, Dimitrijevic A, Hatton J. Current status of the auditory steady-state response and tone-evoked auditory brainstem response for estimating an infant’s audiogram. In: Seewald RC, Bamford JM, eds. A Sound Foundation Through Early Amplification 2004. Basel, Switzerland: Phonak AG; 2004:43-59.
This article was submitted to HR by Douglas L. Beck, AuD, director of professional relations at Oticon Inc, Somerset, NJ; David P. Speidel, MS, director of audiology services, and Michelle Petrak, PhD, audiologist and product manager at Interacoustics, Eden Prairie, Minn. Correspondence can be addressed to [email protected] or Douglas Beck at Oticon Inc, 29 Schoolhouse Road, Somerset, NJ 08875-6724; e-mail: .
Recommended Reading
- Cohen LT, Rickards FW, Clark GM. A comparison of steady-state evoked potentials to modulated tones in awake and sleeping humans. J Acoust Soc Am. 1991;90:2467-2479.]
- Cone-Wesson B, Dowell RC, Tomlin D, Rance G, Ming WJ. The auditory steady-state response: comparisons with the auditory brainstem response. J Am Acad Audiol. 2002;13:173-187.
- Cone-Wesson B, Parker J, Swiderski N, Rickards F. The auditory steady-state evoked response: full-term and premature neonates. J Am Acad Audiol. 2002;13:260-269.
- Cone-Wesson B, Rickards F, Poulis C, Parker J, Tan L, Pollard J. The auditory steady-state response: clinical observations and applications in infants and children. J Am Acad Audiol. 2002;13:270-282.
- Dimitrijevic A, John MS, van Roon P, et al. Estimating the audiogram using multiple auditory steady-state responses. J Am Acad Audiol. 2002;13:205-224.
- Dimitrijevic A, John MS, van Roon P, Picton TW. Human auditory steady-state responses to tones independently modulated in both frequency and amplitude. Ear Hear. 2001;22:100-111.
- John MS, Dimitrijevic A, van Roon P, Picton TW. Multiple auditory steady-state responses to AM and FM stimuli. Audiol Neurootol. 2001;6:12-27.
- John MS, Purcell DW, Dimitrijevic A, Picton TW. Advantages and caveats when recording steady-state responses to multiple simultaneous stimuli. J Am Acad Audiol. 2002;13:246-259.
- National Institutes of Health Consensus Development Conference Statement. Early Identification of Hearing Impairment in Infants and Young Children. NIH Consensus Statement Online. March 1-3, 1993;11(1):1-24.
- Rance G, Beer DE, Cone-Wesson B, et al. Clinical findings for a group of infants and young children with auditory neuropathy. Ear Hear. 1999;20:238-252.
- Rance G, Rickards F. Prediction of hearing thresholds in infants using auditory steady-state evoked potentials. J Am Acad Audiol. 2002;13:236-245.
- Rickards FW, Clark GM. Steady-state evoked potentials to amplitude-modulated tones. In: Nodar RH, Barber C, eds. Evoked Potentials II: The Second International Evoked Potentials Symposium. Boston: Butterworth; 1984:163-168.
- Small SA, Hatton JL, Stapells DR. Effects of bone oscillator coupling method, placement location, and occlusion on bone-conduction auditory steady-state responses in infants. Ear Hear. 2007;28:83-98.
- Small SA, Stapells DR. Artifactual responses when recording auditory steady-state responses. Ear Hear. 2004;25:611-623.
- Small SA, Stapells DR. Multiple auditory steady-state response thresholds to bone-conduction stimuli in young infants with normal hearing. Ear Hear. 2006;27:219-228.
- Stapells DR, Linden D, Suffield JB, Hamel G, Picton TW. Human auditory steady state potentials. Ear Hear. 1984;5:105-113.
- Stelmachowicz PG. How do we know we’ve got it right? Electroacoustic and audiometric measures. In: Seewald RC, ed. A Sound Foundation Through Early Amplification 1998. Stäfa, Switzerland: Phonak AG; 2000:109-118.
- Stürzebecher E, Cebulla M, Elberling C. Automated auditory response detection: statistical problems with repeated testing. Int J Audiol. 2005;44:110-117.
- Vander Werff KR, Brown CJ, Gienapp BA, Schmidt Clay KM. Comparison of auditory steady-state response and auditory brainstem response thresholds in children. J Am Acad Audiol. 2002;13:227-235.
Citation for this article: Beck DL, Speidel DP, Petrak M. Auditory steady-state response: A beginner’s guide. Hearing Review. 2007;14(12)[Nov]:34-37.


