By James Jerger, PhD, with Foreword by Ross J. Roeser, Phd
At first glance, the audiogram is upside-down; the values on the vertical axis become smaller, rather than larger, as they move from the bottom to the top of the graph. Here is the story of the evolution of the audiogram, the three great researchers who shaped it, and how the audiogram came to be upside-down.
| Foreword by Ross Roeser, PhD:
Is Higher Really Better and Lower Worse? In the following article, originally published in the March 2013 edition of the International Journal of Audiology,1 Jim Jerger, PhD, provides us with an historical perspective on one of the most often used and valued diagnostic tools in audiology: the audiogram. In his article, Dr Jerger describes the beginnings of the development of the audiogram and, based on traditional scientific graphics, how it became backwards or upside-down. Before reading this article, I personally never questioned the way the data on the audiogram appears, because this is the way it was presented to me when I was first introduced to audiometry and the audiogram—it never occurred to me to think that it was backwards. But, based on conventional logic, Dr Jerger makes the point clear that the audiogram truly can be considered upside-down. Along these lines, one thing that has always been confusing is the terms used to describe results from pure-tone threshold audiometry. Some use “higher” and “lower” to represent the symbols that appear on the audiogram form, so that higher means poorer hearing and lower means better hearing. However, psycho-acousticians tend to use the term “lower” to mean better hearing and “higher” to mean poorer hearing. As a result, one can totally miss the meaning of information that uses higher or lower when describing audiometric thresholds. When such terms are used, it is always best to ask for clarification. Otherwise, the audiologist who is pleased to know that a patient’s thresholds are higher will be disappointed to learn that hearing has worsened, rather than improved. Better yet, to prevent confusion on these terms, the convention should be to avoid using them, and refer to either better or poorer hearing or thresholds. That way, there is no confusion about the intended meaning. No matter how we view the audiogram, even with its known limitations, it is considered the “gold standard” for audiological diagnosis. Virtually every patient undergoing diagnostic audiological testing has pure-tone threshold audiometry, and data are displayed on the audiogram. Dr Jerger’s article now gives us a clear historical understanding of how the audiogram is the way it is, and makes us think more carefully about how it is displayed. —Ross J. Roeser, PhD, Editor-in-Chief, IJA |
In every new generation of audiology students and otolaryngology residents, at least one or two inquisitive individuals invariably ask why the audiogram is upside-down.
Students spend years studying science textbooks in which two-dimensional graphs are virtually always portrayed such that the numbers on the vertical scale increase as they move from the bottom to the top of the page; then they encounter audiograms and wonder why the “HL in dB” numbers increase in a downward rather than an upward direction. Basically, the audiogram is upside down; the values on the vertical axis become smaller, rather than larger, as they move from the bottom to the top of the graph.
How this anomaly came about is the story of an interesting collaboration among three remarkable individuals: Edmund Prince Fowler, Harvey Fletcher, and R.L. Wegel.
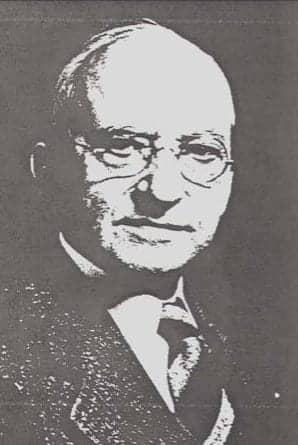
Figure 1. Edmund Prince Fowler (1872-1966) was a giant in otology during the first half of the 20th century and is perhaps best known for his discovery of loudness recruitment. |

Figure 2. Harvey Fletcher (1884-1981) was a physicist who joined Bell Laboratories and became a pioneer in speech and hearing sciences. |
Edmund Prince Fowler (Figure 1) was an otolaryngologist who practiced in New York City. He received his MD degree from the College of Physicians and Surgeons of Columbia University in 1900, then became a member of the Manhattan Eye, Ear, & Throat Hospital staff and, ultimately, Professor at the College of Physicians & Surgeons. Fowler was one of the giants of otology during the first half of the 20th century. He is perhaps best known to audiologists for his discovery of loudness recruitment, but his investigative nature took him into many other aspects of hearing and hearing loss.
Harvey Fletcher (Figure 2) was a physicist who earned his PhD degree from the University of Chicago in 1911, and then taught physics at Brigham Young University in Utah for 5 years. In 1916, he moved to the New York City area to join the Bell Telephone Laboratories. Fletcher was an early pioneer in the speech and hearing sciences, and his 1953 book, Speech and Hearing in Communication,2 was a virtual bible for serious researchers throughout the second half of the 20th century.
R.L. Wegel (whose photo we were not able to locate) was a physicist who earned his AB degree from Ripon College in 1910. From 1912 to 1913, he worked as a physicist in the laboratory of Thomas A. Edison. In 1914, he joined the Engineering Department of the Western Electric Company in New York City. He worked mainly in the area of telephone transmitters and receivers, but developed an interest in hearing and hearing disorders as a result of his own intractable tinnitus.3 Wegel is perhaps best known to auditory scientists for his collaboration with C.E. Lane on an early study of tone-on-tone masking.4
| The First Audiometers & Audiograms
The first audiometer in the United States was developed by Cordia C. Bunch when he was a graduate student at the University of Iowa (Dean & Bunch 1919).6 Bunch’s audiometer, however, was not commercially available; its use was essentially limited to the study of the patients of one otologist, Dr L.W. Dean. Bunch collected what must have been many hundreds of audiograms, analyzed them in relation to the patient’s complaints, history, and associated otological findings, and wrote 22 papers on a broad range of topics, based solely on his analyses of air-conduction thresholds (eg, Bunch 1928).7 In 1941, Bunch accepted an invitation to become Research Professor in the Education of the Deaf at Northwestern University, and to teach courses in hearing testing and hearing disorders. There he mentored a young faculty member in speech science, Raymond Carhart, who many now acknowledge as the “Father of Audiology.” The year 1919 also saw the introduction of the first electronic audiometers in Europe, They were presented independently, at a meeting of the German Otological Society, by Schaefer & Gruschke and by Greissmann & Schwartzkopf.8 Subsequent efforts to find agreement on a method for displaying audiograms in Europe are interesting but beyond the scope of this article. |
Genesis of the Audiogram Form
The trio—Fowler, Fletcher, and Wegel— came together in the New York City area in the years immediately following World War I. Their common interest was the development and evaluation of the first commercially available audiometer in the USA, the Western Electric Model 1-A, designed jointly by Fletcher and Wegel for the American Telephone and Telegraph Company (AT&T) and employed clinically in the otologic practice of Dr Fowler (for more about the history of audiometers, see sidebar).
Throughout World War I, the research resources of AT&T were focused on underwater sound transmission and detection, but when the war ended, interest returned to the basic study of the hearing and speech processes, and, tangentially, hearing loss, all important to telephone communication. AT&T turned, therefore, to its engineering wing, the Western Electric Company, and to its research wing, the Bell Telephone Laboratories, for the development of an instrument to measure hearing loss. R.L Wegel of Western Electric and Harvey Fletcher of Bell Labs took responsibility for the task. When the 1-A audiometer was ready for clinical evaluation, Wegel and Fletcher found a willing collaborator in Edmund Prince Fowler. (Fowler had previously worked with Fletcher and Alexander Nicholson of Western Electric in the development of a group phonograph audiometer for screening the hearing of schoolchildren.5)
The Saga of the Vertical Scale
It is difficult to imagine from our present-day vantage point the terra incognita in which this trio worked. Prior to the invention of the vacuum tube by Lee De Forest in 1906, there was really no satisfactory way of controlling and calibrating the amplitude of a pure tone. Tuning forks could produce a range of frequencies, but their use in measuring degree of hearing loss was restricted either to a temporal measure (ie, how long could the patient hear the fork in relation to how long the examiner could hear it), or to a distance measure (ie, how far away from the examiner could the patient still hear him).8 Thus, tuning forks interjected a truly mind-boggling number of uncontrolled variables.
Use of the intensity dimension—the faintest intensity at which the patient can just hear the tone—had never been successfully exploited until the electric audiometer became available to clinicians. (As Alberto Behar9 has emphasized, the exact definition of “intensity” in physical acoustics is a complex issue; the term is used here mostly in the popular general sense of “strength of sound.”) Now it was possible via a telephone receiver to produce a pure tone of known sound pressure level, which could be systematically varied to facilitate a threshold search separately for each ear.
As the Western Electric 1-A audiometer came into clinical use, our trio of Fowler, Fletcher, and Wegel began to wrestle with the issue of how to standardize the reporting of audiometric thresholds. Fowler and Wegel’s first attempt was presented to otologists in 1922 at the 25th annual meeting of the American Laryngological, Rhinological and Otological Society in Washington, DC.10 It was concerned primarily with how to represent thresholds graphically.
There was never a serious issue concerning representation of the frequency scale; the well-established musical scale, in which octave intervals are equally spaced, was readily adopted for the horizontal dimension of the graph. But the vertical dimension, the representation of threshold intensity, underwent a number of iterations.
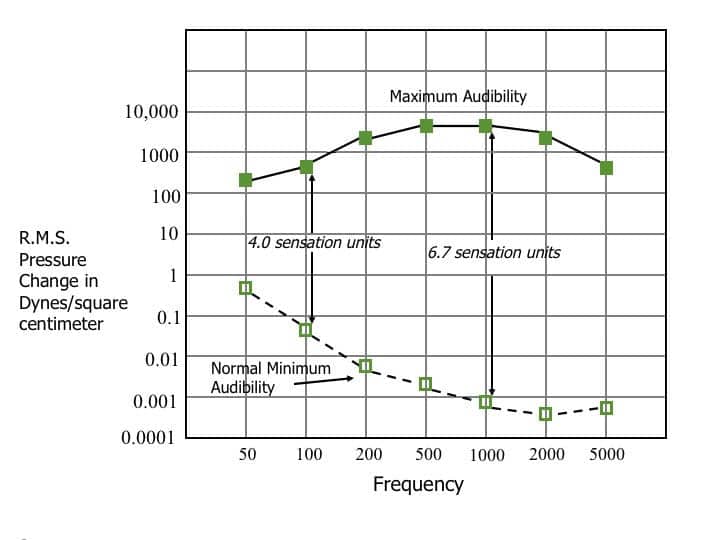
In a 1922 publication, Wegel11 had published a graph of the “auditory area”—the area between threshold audibility and the sensation of “feeling” across the audible frequency range. I have recreated this historic graph in Figure 3. Frequency was represented horizontally at approximately equally spaced octave intervals; intensity was represented vertically on a logarithmic scale of sound pressure level change, ranging from 0.0001 to 10,000 dynes/cm2. A logarithmic scale of sound intensity was already widely accepted in the 1920s, based on the earlier studies of the great German psychologists, Ernst Weber and Gustave Fechner.8 It was well agreed, among students of audition, that the “strength of sensation” dimension should be represented logarithmically. From the standpoint of scientists like Fletcher and Wegel, the sound pressure level, expressed in dynes/cm2, and increasing logarithmically from small numbers at the bottom to large numbers at the top of the graph, was consistent with scientific tradition.
But the story does not end here. Indeed, it has hardly begun. After studying graphs like Figure 3, Fowler noted that when sound intensity was represented logarithmically, in which each successive step represented a pressure change ratio of 10:1, slightly less than 7 such steps separated the threshold of audibility from the threshold of feeling in the mid-frequency (1000 to 3000 Hz) region. Fowler described this as the range of “sensations” characterizing the human auditory system and arbitrarily defined each step as a “sensation unit.”
From here, it was only a short jump to the concept that the hearing loss of a hearing-impaired person could be represented as a loss in sensation units; if the normal sensation range, from just-heard to just-felt, was 6.7 sensation units, and the patient’s threshold of audibility was 2.1 units above the normal threshold of audibility, then one could say that the patient had a loss in sensation units of 31% (2.1/6.7). In other words, one could convert any patient’s threshold of audibility to a “percentage loss” by this arithmetic maneuver.
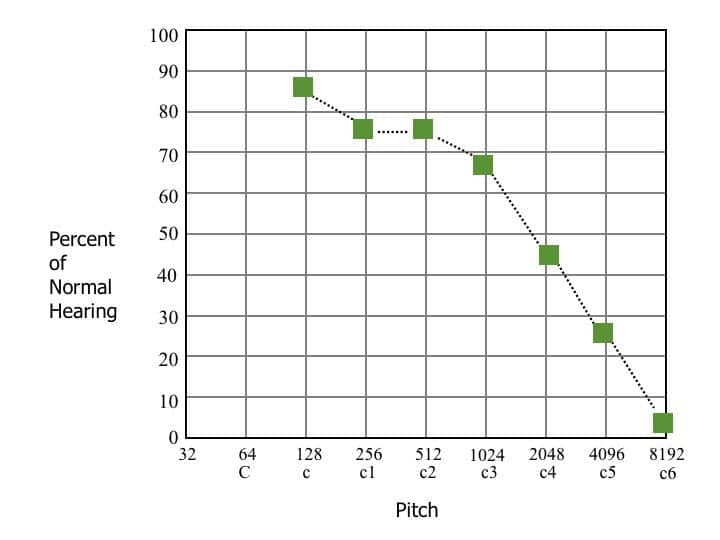
It was possible to take this one step further, reasoned Fowler, by subtracting the percentage loss from 100 to achieve “percent of normal hearing”(100% -31% = 69%). Figure 4 is based on Figure 3 of the Fowler and Wegel (1922) paper.10 The filled squares show the hypothetical audiometric contour of a person with a high-frequency hearing loss. This chart, thought Fowler, gave you the numbers you needed to counsel patients. In his own words:
“This chart gives, perhaps, the most practical and logical answer to the question so often asked by the patient. ‘How much hearing have I left?’ This can be read for single frequencies from the chart. The physician, as well as the patient, is usually interested in the loss, or amount retained, of sensory capacity.” [p 110]10
Interestingly, a similar graphic representation was advanced in 1885 by the German otologist A. Hartmann of Berlin.8 He displayed duration of hearing at each tuning fork frequency as a percentage of normal duration. The percentages on the vertical scale ranged from 100% at the top of the graph to 0% at the bottom.
Alea Jacta Est!
The die is cast! Julius Caesar uttered this famous phrase to indicate that crossing the Rubicon was an irrevocable act. However, Edmund Prince Fowler could not have known that placing the 100%-of-normal-hearing line at the top of the audiogram form was a similar irrevocable act.
Fowler’s influence in the otologic community in the decade of the 1920s was so pervasive that no one ventured to challenge it; indeed, his colleagues seemed to applaud the concept. The vertical scale satisfied the notion that the numbers ought to increase from bottom to top of the graph.
We can see in Figure 4 that, if Fowler’s original concept had been followed, the graph of audiometric results, which came to be called the “audiogram,” would have followed standard scientific usage; the values on the vertical scale (percent of normal hearing) would, indeed, have moved upward from the lowest to the highest numbers. At this point, the die had been cast. The line that came to be called “zero HL in dB” was fixed at the top of the graph and would never change thereafter.
But Harvey Fletcher, a physicist, not a clinician, clearly did not agree with the percent-loss approach. In a lecture and demonstration given before the American Academy of Ophthalmology and Otolaryngology in Chicago in 1925,13 he made the following argument:
“In a paper presented before the American Triological Society by Fowler and Wegel (Audiometric Methods and Their Applications, May 1922), a hearing scale was proposed which has been objected to by some otologists because it is dependent on the threshold of feeling as well as the threshold of hearing. On this scale the percent hearing loss is the number of sensation units from the normal to the patient divided by the number of sensation units from the normal to the feeling point for a person of normal hearing. It is undoubtedly the best answer to the practical question as to what is the percent hearing loss, and is very useful in expressing general results. It is particularly useful for describing to the patient his degree of hearing. However, for an accurate expression of the degree of hearing loss, it seems desirable to express results in terms of sensation units rather than percent hearing loss.”[p 167]13
In 1923, Fletcher presented audeograms [sic] of patients with typical deafness in which the intensity dimension was presented in just exactly that fashion. An example is shown in Figure 5. The filled squares reflect the data of the same hypothetical contour shown in Figure 4. Audiologists who deal with the frequency-response data of amplification devices will recognize how much more easily the response of the impaired ear and the response of the hearing aid could have been compared over the past half-century if this representation of audiograms had been retained.
Clearly, physicist Fletcher was more comfortable with a purely physical scale of sound intensity than with the percentage concept based on the range between “just audible” and “just felt.” But when he had convinced Fowler to abandon the “percent-of-normal-hearing” concept, he failed to follow through on the approach illustrated in Figure 5. Instead, he renamed Fowler’s vertical scale “sensation units” in which each unit represented not a percentage change but a 10:1 change in sound pressure, but left the zero line at the top rather than moving it to the bottom of the graph. He simply changed the 100% line at the top of the graph to 0 sensation loss and renumbered so that increasing loss moved downward on the vertical scale. The audiogram was now doomed to be upside-down forever.
Implicit in Fowler’s original concept of “sensation units” was the principle that intensity, or hearing loss, was plotted relative to average normal hearing rather than relative to a physical baseline; at each frequency, the straight line at 100% on Figure 4 was simply the threshold of audibility straightened out to eliminate the fact that the sound pressure level corresponding to that 100% level varies with frequency. This concept quickly took hold, leading to the terminology “Hearing Loss in Sensation units.”
By 1926, Fletcher was publishing audiograms in which the vertical scale was “Hearing Loss–Sensation Units.” By 1928, Fowler had abandoned his “Percent of Normal Hearing” measure and now plotted audiograms with intensity progressing downward from 0 to 120, and labeled “Sensation Loss.”
| How Did Audiograms Get the dB Notation?
The evolution of the decibel notation is, itself, an interesting story.15 Prior to 1923, the unit for expressing telephone transmission efficiency was the “mile of standard cable,” but in that year the Bell system adopted a new concept, the “Transmission Unit” or TU, defined as 1/10 log P/Po, where P and Po are pressure levels in the ratio of 10:1. A year later Bell scientists decided that a more workable unit should be defined as 10 transmission units or, simply, log P/Po. They proposed to name this new unit the bel, after Alexander Graham Bell, founder of Bell Laboratories, and to introduce the concept of 1/10th of a bel, the decibel. In effect, they traded “transmission unit ” for “decibel.” This decibel notation was readily adopted by Harvey Fletcher to supplant the sensation unit on the intensity scale of the audiogram. Years later, the International Union of Pure and Applied Physics evolved the rule that the first letters of physical units named after persons should be capitalized. Since the bel was named after an actual person, Alexander Graham Bell, it became the Bel, and decibel became dB. |
Introduction of the Decibel Notation
In the original conception of the sensation unit, slightly less than 7 units covered the range from audibility to feeling in the most sensitive portion of the auditory area. Fletcher13 thought this range too small for making meaningful distinctions among different degrees of hearing loss. In the Western Electric 1-A audiometer, he and Wegel redefined hearing loss as:
HL = 10 log I/Io = 20 log P/Po , where…
I is the patient’s threshold power level, Io is the threshold power level of the average normal ear, P is the patient’s threshold pressure level, and Po is the pressure level of the average normal ear.
They adopted what we now know as the decibel notation, thereby increasing the range on the vertical dimension from slightly less than 7 sensation units to about 120 decibel (dB) units. As a result of Fletcher’s influence, over the next decade, “sensation units” and “sensation loss” slowly gave way to “Loss in Decibels.” In a 1943 publication14 by Fowler’s son, Edmund Prince Fowler Jr, the vertical scale in one of his figures [Figure 1a, p 393] is clearly labeled “Hearing Loss in Decibels.”
Some years later, in a move toward terminological purity, Hallowell Davis, at Central Institute for the Deaf in St Louis, pointed out that “loss” can only be expressed relative to a known previous status of the patient rather than relative to average normal hearing. The term “Hearing Level in dB” (dB HL) was deemed more appropriate for the vertical scale. This brings us to contemporary usage.
And that is the interesting story of how the audiogram came to be upside down.
Reflections
What lessons might we derive from this saga? First, it seems clear that relating a patient’s degree of hearing loss to the physical characteristics of amplification devices would have been greatly simplified if Fletcher’s scheme for the format of the audiogram (see Figure 5) had ultimately survived. Both sets of data would have been based on the same physical reference at all frequencies rather than the present situation in which one is based on sound pressure levels that vary across the frequency range according to the variation in “average normal hearing” (the audiogram), while the other is based on the same reference sound pressure level (0.0002 dynes/cm2 or 20 ?Pa) at all frequencies (amplification characteristics).
Second, Fowler’s notion of “…amount of retained sensory capacity” as quantified by “percent of normal hearing” may not have been such a bad idea. It had the virtue that it yielded a number, at each test frequency, easily understandable as a percentage rather than a decibel value. It also had the property that the numbers on the vertical scale increased, rather than decreased, from the bottom to the top of the recording form.
Fletcher’s discomfort with the threshold of feeling as a point of reference may have stemmed from the perception that “feeling” must be quite variable across individuals with and without hearing loss. In fact, however, the variability of the threshold of feeling in young adults with normal hearing is less than the variability of the threshold of audibility.16 It has the additional property that it is the same in persons with varying degrees of hearing loss, both conductive and sensorineural, and in persons with total deafness.17,18
Additionally, a measure of loss based on the range of useful hearing at each frequency (range from just audible to felt), rather than the range of all possible sound pressure levels above the audibility threshold, has a certain face validity. The fact that the usable range of hearing varies across the frequency range is a fundamental property of the auditory system but is not evident from the contemporary audiometric display.
In any event, two quite sensible ways of recording audiometric threshold data emerged in the early 1920s, Edmund Prince Fowler’s scheme, illustrated in Figure 4, and Harvey Fletcher’s scheme, illustrated in Figure 5. Either would probably have been better than the present system, and would have preserved scientific tradition relative to the ordinates of graphs.
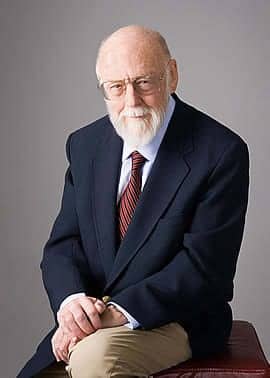
|
Acknowledgments
The author is grateful for the many helpful suggestions of Susan Jerger, Michael Stewart, and Richard Wilson.
This article originally appeared in the March 2013 edition of The International Journal of Audiology,1 and is adapted and reprinted here with permission from the publisher. HR thanks IJA Editor-in-chief Ross Roeser and Managing Editor Jackie Clark for their help in the preparation and republishing of this article.
References
1. Jerger J. Why the audiogram is upside-down. Int J Audiol. 2013;52:146-150.
2. Fletcher H. Speech & Hearing in Communication. 2nd ed. New York: Van Nostrand; 1953.
3. Wegel R. A study of tinnitus. Arch Otolaryngol. 1931;14:158-165.
4. Wegel R, Lane C. The auditory masking of one pure tone by another and its probable relation to the dynamics of the inner ear. Phys Rev. 1924;23:266-285.
5. Fagen M. A History of Engineering and Science in the Bell System. Vol II, National Service in War and Peace (1925-1975). Murray Hill, NJ: Bell Telephone Laboratories Inc; 1975.
6. Dean L, Bunch C. The use of the pitch range audiometer in otology. Laryngoscope. 1919;29:453.
7. Bunch C. Auditory acuity after removal of the entire right cerebral hemisphere. J Am Med Assn. 1928;90:2102.
8. Feldmann H. A History of Audiology. Vol 22: Translations of the Beltone Institute for Hearing Research. Chicago: The Beltone Institute for Hearing Research; 1970.
9. Behar A. Sound intensity and sound level. Canadian Hearing Report. 2012;7:26-27.
10. Fowler E, Wegel R. Audiometric methods and their applications. In: 28th Annual Meeting of the American Laryngological, Rhinological, and Otological Society, Washington, DC, May 4-6, 1922. Omaha, Neb: American Laryngological, Rhinological, and Otological Society [now Triological Society]; 1922:98-132.
11. Wegel R. Physical examination of hearing and binaural aids for the deaf. Proc Nat Acad Sci. 1922;Wash 8:155-160.
12. Fletcher H. Audiometric measurements and their uses. Transactions of the College of Physicians of Philadelphia. 1923;45:489-501.
13. Fletcher H. New methods and apparatus for testing hearing. Ann Otol, Rhinol & Laryngol. 1926;35:165-180.
14. Fowler E Jr. Audiogram interpretation and the fitting of hearing aids. Proc Royal Soc Med. 1943;36:391-402.
15. Martin M. Decibel—the new name for the Transmission Unit. The Bell System Technical Journal. 1929;8:1-2.
16. Durrant J, Lovrinic J. Bases of Hearing Science. Baltimore: Williams & Wilkins; 1977.
17. Reger S. The threshold of feeling in the ear in relation to artificial hearing aids. Psych Monographs. 1933;44:74-94.
18. Lierle D, Reger S. Threshold of feeling in the ear in relation to sound pressure. Arch Otolaryngol. 1936;23:653-664.


