Tech Topic | January 2016 Hearing Review
As noted in a previous paper, both generic and proprietary prescriptions have changed recently. This led Widex researchers to ask if their own fitting rationale should be changed. Here is how they evaluated the fitting method and what they concluded.
In a previous paper,1 we described how generic and proprietary gain prescriptions have changed since the late 1990s. Generic prescriptions, such as the DSL and NAL, have generally decreased their recommended gain—in particular in a broad frequency range around 1 kHz. A similar trend is seen for proprietary prescriptions.
Widex has for a long time used a default prescription which, for speech signals, is similar to NAL-NL1. In the current paper, this default prescription is compared to an alternative prescription with more NAL-NL2-like characteristics. The research was prompted by the introduction of a new hearing aid, UNIQUE.2 Some of the implemented features in the new hearing aid change the output from the hearing aid (compared to previous Widex models) in particular sound environments. For example, the Soft-Level Noise Reduction reduces soft unmodulated noise, while preserving gain for soft modulated sounds. While developing the new hearing aid, and in light of recent prescription changes, it was judged important to evaluate our default gain prescription with regard to speech intelligibility and sound quality.
Widex Fitting Rationale: Development Over Time
Widex Fitting Rationale (WFR) is based on two basic principles: equalization and normalization of loudness across frequency. Equalization of loudness is used for speech sounds in order to maximize speech intelligibility. Normalization of loudness is used for low-level sounds in order to create audibility, and for high-level sounds in order to give normal perception of the dynamics of sounds.
Loudness density equalization means that each auditory filter band of an input speech signal should be amplified to approximately equal loudness in the frequency range most important to speech (approximately 500-4000 Hz). Because of the spectral characteristics of speech—with a lot of energy in the low frequencies and less energy in the high frequencies—such strategy means that more gain will be given to high-frequency sounds than to low-frequency sounds in order to equalize the speech loudness across frequency. On top of this equalization, which only depends on the spectral characteristics of the speech signal, hearing loss compensation is added. This principle also underlies the original NAL prescription3 and more recently developed prescriptions from Brian Moore’s group in Cambridge.4,5
When the NAL group developed their first prescription for nonlinear hearing aids (NAL-NL1), the goal was still to create a prescription that led to good speech intelligibility. This was achieved by maximizing the Speech Intelligibility Index (SII) in quiet. It turned out that, for a mid-level speech signal, the two strategies (equalizing speech loudness across frequency as in the NAL-R prescription and maximizing SII as in the NAL-NL1 prescription) led to very similar results; it therefore seems as if loudness density equalization is an appropriate strategy for making speech intelligible.
For sounds outside the level range of speech, the WFR is instead based on loudness density normalization, which means that each auditory filter band of an input signal should be amplified to restore normal loudness density. This means that the spectral shape of various sounds will be similar to that of a normal-hearing listener.
The WFR focus on loudness density equalization for speech sounds has resulted in a prescription that is similar to NAL-R and to NAL-NL1. This can be seen in Figure 1, where measured ear simulator gain for Widex DREAM is compared to NAL-NL1 prescribed gain for a sloping moderate sensorineural audiogram (for details, see Smeds et al, 20151).
WFR is similar to NAL-NL1 in the 1-3 kHz range (1-6 kHz for the 50 dB SPL input, Figure 1, left panel). Less gain than NAL-NL1 is prescribed above 3 kHz for 65 and 80 dB SPL input. In the low-frequency range, WFR generally provides more gain than NAL-NL1.
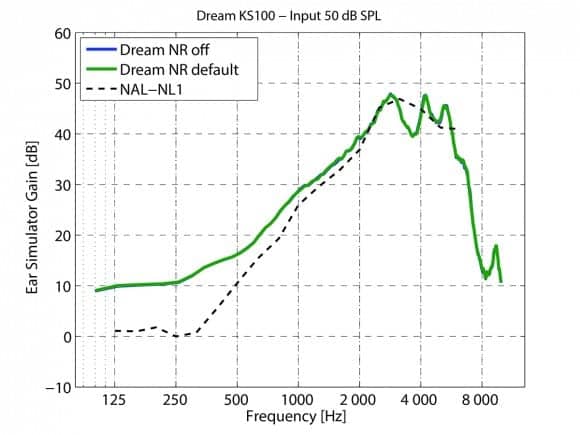
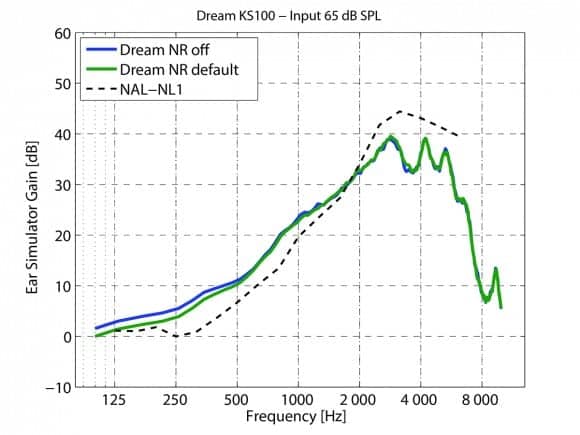
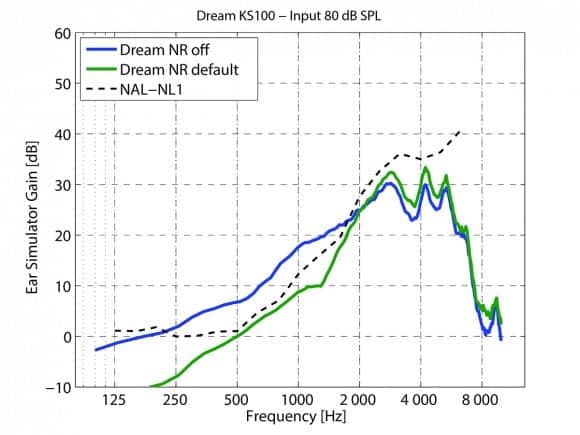
Figure 1a, b, c. Measured DREAM ear simulator gain for a sloping sensorineural audiogram. Blue curve is with the noise reduction (NR) switched off, and green curve is with the noise reduction switched on. The left panel shows the data for speech in quiet at 50 dB SPL, the middle panel for speech in speech-shaped stationary noise (SNR=9 dB) at an overall level of 65 dB SPL, and the right panel for speech in speech-shaped stationary noise (SNR=3 dB) at an overall level of 80 dB SPL. In each panel, the appropriate NAL-NL1 prescribed gain is added for comparison (dotted line).
Sound-quality aspects have governed the decision to provide more gain at low frequencies in order to achieve a “fuller” sound.6 However, if the low frequency gain is too high, there might be problems with upward spread of masking in situations where speech is present in background noise. This is dealt with in Widex hearing aids by the use of an SII-based noise reduction, which effectively reduces the gain in the low frequencies when background noise is present. This is illustrated in the right panel in Figure 1, where the effect of the noise reduction is clearly seen. In this case, WFR and NAL-NL1 are very similar up to 3 kHz (the attenuation shown for DREAM below 500 Hz would not be achieved in real life when a vented earmold is used).
In 2011, the new NAL-NL2 prescription was introduced. The most prominent difference in gain-frequency response shape between NAL-NL1 and NAL-NL2 was that NAL-NL2 introduced a gain reduction in a broad range around 1 kHz. The change was mainly a result of a modification in the SII function used for the derivation of the new prescription.7
This means that, in the frequency range where the WFR and NAL-NL1 prescriptions are very similar, a change was made when NAL-NL2 was developed. We were therefore interested in comparing two prescriptions: our standard prescription, with NAL-NL1 similarities, and an alternative prescription, with NAL-NL2 similarities. The comparison focused on speech intelligibility and sound quality, and the purpose of the study was to decide if it is time for a prescription change in Widex hearing aids.
Study Method
A total of 20 hearing-impaired listeners compared two gain prescriptions in the field and in the laboratory. Some comparisons were also made with the participants’ own hearing aids.
Hearing aid and fitting. UNIQUE hearing aids in a prototype version (BTE-RITE) were fitted bilaterally. The hearing aids were individually programmed using two prescriptions, called WFR and WFR2. None of the participants required fine-tuning, but a traditional volume control (rather than the UNIQUE preference control) was active and the use of the volume control was logged. The Sound Class Technology was switched on and other features were set to default.
WFR is the prescription that has been used in Widex hearing aids for a long time. Some of the new features introduced in UNIQUE2 slightly lowers the output from the hearing aid in comparison to the DREAM hearing aid. The difference is small for speech sounds, but larger for some sounds outside the speech-level range.
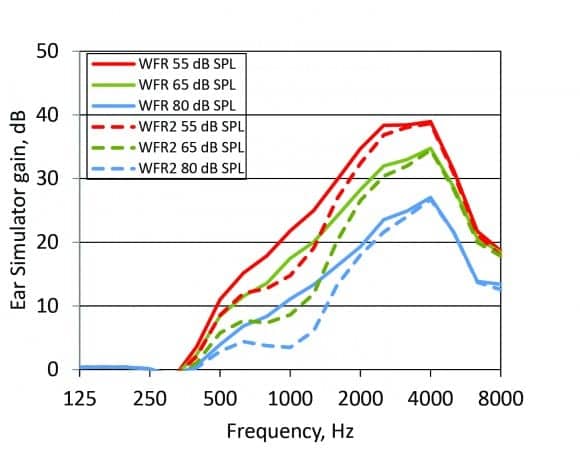
Figure 2. Ear simulator gain for WFR and WFR2 for one participant with an audiogram similar to the audiogram used for the measurements in Figure 1.
The experimental WFR2 prescription was changed, relative to WFR, by introducing a gain reduction in a broad frequency range around 1 kHz (to mimic the most prominent change from NAL-NL1 to NAL-NL2). Figure 2 shows the measured WFR and WFR2 gain for a sloping sensorineural mild-to-moderate hearing loss.
Participants. Twenty participants were recruited from the ORCA Europe database, 8 women and 12 men. Their average age was 74 years. All participants had a symmetrical, sensorineural, mild-to-moderate hearing loss within the fitting range of the UNIQUE hearing aid. Figure 3 shows the measured pure-tone thresholds for the participants’ left ears.
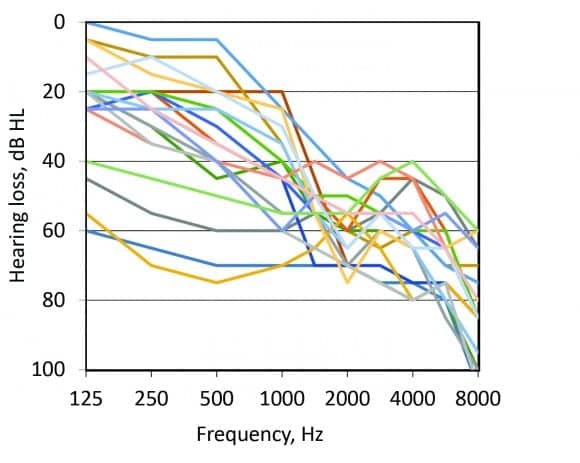
Figure 3. Audiometric thresholds for the participants’ left ear.
All participants were experienced hearing aid users (average 13 years of hearing-aid use, range: 6-25 years). They were all familiar with hearing aid brands other than Widex: 8 people used Phonak or Unitron devices, 5 used Oticon devices, 3 used ReSound devices, and the remaining 4 used devices of other brands. Ten of the participants had been fitted with their latest hearing aids within an 18-month period prior to the study (range: 0-6 years).
Field test. During the 2-week field test, the participants were encouraged to visit a variety of acoustic environments and to compare the hearing aids’ two programs (WFR and WFR2). They used a written diary for momentary ecological assessment. They stated their preferred program and commented what governed the preference. The hearing aid logged the volume control setting and how much the two programs had been used. After the field test, an interview was performed.
Speech test setup. Speech testing was performed both with the participants’ own hearing aids (before the field trial) and with the UNIQUE prototype with the two WFR settings (directly after the field-trial period). The measurements were performed in a sound-proof booth. Four loudspeakers were placed at 1.0 m distance from the center of the listener’s head. Speech was presented at 0° azimuth and noise from three loudspeakers at 90°, 180°, and 270°.
Prior to the speech testing, the participants were asked to set their own hearing aids to the program and volume control setting they normally would use for speech communication in noise. For UNIQUE, the hearing aid volume control was set to default and the Sound Class Technology was temporarily locked to “Party + Speech” in order to match the test condition.
HINT. Adaptive speech testing, using a Swedish version of the Hearing In Noise Test (HINT)8,9 was performed with a female speaker and speech-shaped noise. Two test conditions were used, using noise at 55 and 70 dB SPL. The speech level was adaptively adjusted (using whole-sentence scoring and a 2-dB up-down procedure) to yield 50% correct.
ORCA nonsense syllable test. A Swedish version of the ORCA nonsense syllable test10 was also used. The test consists of nonsense words, spoken by a female. The speech was presented at 65 dB SPL and stationary noise was presented at 55 dB SPL (SNR=10 dB). Scoring was performed for each phoneme, and both consonant and whole word scores will be presented below. The ORCA nonsense syllable test was also performed unaided.
Study Results
Field test. In the interview following the field test, the participants were asked which of the two WFR settings they preferred. A total of 9 people preferred WFR, and 11 people preferred WFR2. Fifteen people were satisfied or very satisfied with the sound when the hearing aids were fitted with WFR, 13 people answered the same for WFR2 (Figure 4, left panel).
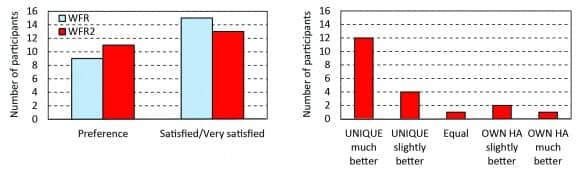
Figure 4. Main interview results. Left panel: Number of participants who preferred WFR and WFR2 and number of participants who were satisfied or very satisfied with WFR and WFR2. Right panel: Result of the comparison between the UNIQUE prototype (with the preferred setting) and the participants’ own hearing aids (HA).
Many participants commented that WFR led to higher loudness than WFR2. The comments were mainly positive, such as “I have heard a fly for the first time in many years,” and “I can hear someone approaching me from behind.” However, there were also people who described the higher loudness as tiring after using the hearing aids for a whole day. Five people thought WFR provided too much gain.
The data log showed that the participants had used their preferred UNIQUE program slightly more than the other program. The logged volume control settings showed that the prescribed gain had been used 70% of the time for both programs and that the volume control had only been adjusted a couple of dB, up and down with equal frequency for both prescriptions.
In the interview, the participants were also asked how well their preferred WFR program worked compared to their own hearing aids. The UNIQUE prototype was preferred by 16 participants (Figure 4, right panel). The most commonly mentioned reasons to select the test hearing aids were: better sound quality (9 people), better speech intelligibility (8 people), better performance when talking on the phone (6 people), and less wind noise (4 people).
Three participants preferred their own hearing aids, and one participant thought his/her own hearing aids worked equally well as UNIQUE (Figure 4, right panel). Two of these participants thought their own hearing aids provided better sound quality, and one thought the speech intelligibility was better with his/her own hearing aids. Two participants also commented that their own voice sounded worse with the test hearing aid, probably due to a more closed fitting during the field trial than they were normally used to.

Figure 5. HINT results for noise at 55 dB SPL (upper panel) and 70 dB SPL (lower panel). The results for the participants own hearing aids (Own HA), WFR and WFR 2 are plotted. Lower values indicate better results. The box illustrates the interquartile range. The whiskers extend to the highest/lowest value within 1.5 times the interquartile range. Values outside this range are marked as outliers (+).
HINT. The results of the HINT test are shown in Figure 5 (where lower values indicate better results). When noise was presented at 55 dB SPL (Figure 5, upper panel), the median SNR for 50% correct was 1.3 dB for the participants’ own hearing aids, -0.9 dB for WFR, and 0 dB for WFR2. The performance was generally better with a noise level of 70 dB SPL (Figure 5, lower panel) with medians at -1.6 dB for the participants’ own devices, -3.3 dB for WFR, and -3.6 dB SNR for WFR2. The difference between WFR and WFR2 was statistically significant (p<0.05, paired t-test, double-sided) for noise at 55 dB SPL, but not at 70 dB SPL. The difference between WFR or WFR2 and the participants’ own device was significant (p<0.05) at both noise levels.
ORCA nonsense syllable test. The results from the ORCA nonsense syllable test are shown in Figure 6. For the consonant scores (Figure 6, upper panel), the median score in the unaided situation was 43%, using the participants’ own hearing aids 64%, WFR 80%, and WFR2 76%. Similar results were seen for the word scores (lower panel). The difference between WFR and WFR2 was not statistically significant (p<0.05, paired t-test, double-sided), but the difference between WFR or WFR2 and the participants’ own device was statistically significant. The difference between all aided situations and the unaided situation was statistically significant.
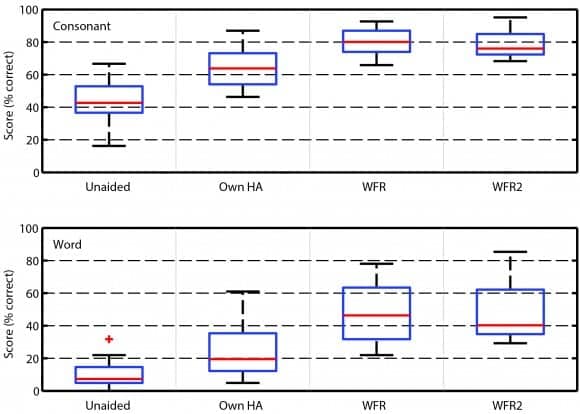
Figure 6. ORCA nonsense syllable test results for the consonant scoring (upper panel) and the whole word scoring (lower panel). The results for the Unaided condition, the participants own hearing aids (Own HA), WFR and WFR 2 are plotted. Higher values indicate better results. Box characteristics as in Figure 4.
Discussion
Widex default prescription, WFR (with NAL-NL1 similarities) was compared to a new prescription WFR2 (with NAL-NL2 similarities). The two prescriptions basically performed equally well, both in speech tests and in subjective ratings. WFR, which provided more gain around 1 kHz, led to better speech test results for low-level speech (Figure 5), but was judged to be too loud by a number of participants.
The most remarkable finding was the large difference between the UNIQUE prototype (in either setting) and the participants’ own hearing aids. The speech test results were clearly better with UNIQUE than with the participants own hearing aids. It is usually difficult to demonstrate such large differences in speech scores, since fairly large variations in gain-frequency response shape can lead to similar speech test results.11
Also, when subjectively comparing the UNIQUE with the participants own hearing aids after the 2-week field trial, 16 of the 20 participants said UNIQUE performed better or much better than their current hearing aids. Better sound quality and better speech intelligibility were the most common explanations for the participants’ preference. The preference for the UNIQUE prototype was especially positive considering that the participants initially had described themselves as “satisfied” or “very satisfied” (11 people) or “neither satisfied nor dissatisfied” (7 people) with their own hearing aids.
The difference between the UNIQUE and the participants’ own hearing aids were explored. First, two methodological issues—placebo and learning effects—were discussed, followed by an analysis of the acoustical differences between the UNIQUE and the participants’ own hearing aids.
Placebo effect. In a situation where test participants think one “test” hearing aid represents a markedly new product, whereas their own hearing aids represent something more “conventional,” there is reason to think that the placebo effect will affect subjective ratings of the two hearing aids. Placebo might also have a small effect when performing speech tests.12 The placebo effect might have influenced the current results, in particular the subjective comparison between the UNIQUE and the participants’ own hearing aids after the field test. However, the differences in speech test results were considerably larger than would be expected if the effect was based purely on placebo.
Learning effect. The speech tests using the UNIQUE prototype were performed after the 2-week field trial, which served as a short acclimatization period. The speech tests for the participants’ own hearing aids were performed when the participants were used to their own hearing aids, before the UNIQUE prototype was fitted. This meant that the test order was not balanced and a learning effect could be present.
For HINT, each test list was only used once for each participant. When comparing the WFR and WFR2 results (measured in the same session, but not immediately after each other), the learning effect was 0.3 dB. After a 2-week interval, which was the time between the testing with the participants’ own hearing aids and the UNIQUE, the learning effect should be even smaller.
For the ORCA nonsense syllable test, there is only one set of words (presented in random order), which might lead to a larger learning effect. However, the difference in results between the participants’ own hearing aids and the UNIQUE was very large, and the performance for the participants own hearing aids so low that it is unlikely that the participants would “remember” the nonsense words they had listened to with their own hearing aids when they tested the UNIQUE two weeks later. When comparing the WFR and WFR2 results in a similar way as for the HINT results, the learning effect was found to be 2 percentage points.
It is therefore not likely that the differences in speech test results are only due to a test order effect.
Gain difference between hearing aids. It seems as if the differences in gain and signal processing between the UNIQUE and the participants’ own hearing aids is the main reason for the differences found in the speech test results and in the subjective evaluation. Ear simulator gain was measured using a speech signal13 at 55, 65, and 80 dB SPL. The results are presented in Figure 7 together with the prescribed NAL-NL1 and NAL-NL2 gain.

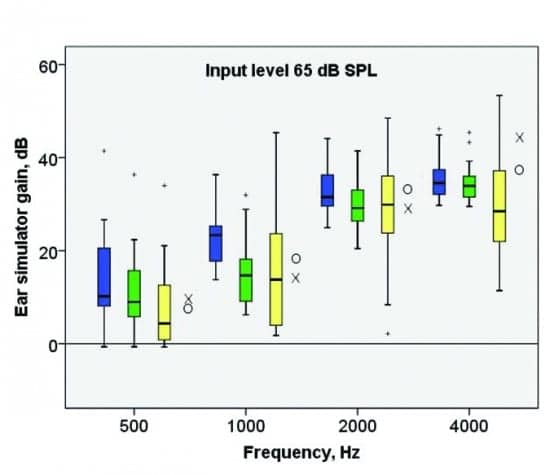
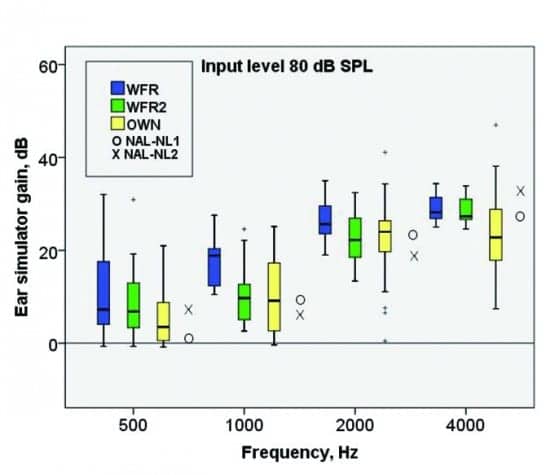
Figure 7a, b, c. Measured ear simulator gain for WFR (blue), WFR2 (green), and the participants’ own hearing aids (yellow), using speech at 55, 65, and 80 dB SPL. Measured gains for the left ear are presented in four third-octave bands. Box characteristics as in Figure 4. Median prescribed gain (across the 20 participants’ left ear) for NAL-NL1 (O) and NAL-NL2 (X) is added for comparison.
For the participants’ own hearing aids, there is a large range of measured gain, which is to be expected since many different hearing aids were used and since the measured gain may include fine-tuning adjustments based on subjective preference. The participants’ own hearing aids were generally fitted with less gain than the UNIQUE prototype, in particular in the high-frequency range, and in particular in comparison with WFR. The median gain for the participants’ own hearing aids was closer to NAL-NL2 than NAL-NL1 prescribed gain, except in the high-frequency range, where the participants usually were fitted with considerably less gain than prescribed by NAL-NL2.
We cannot conclude that the gain difference between UNIQUE and the participants’ own hearing aids is the only, or even the most important, reason for why they objectively performed better on the speech tests and subjectively preferred UNIQUE. Other signal-processing differences could have influenced sound quality and speech intelligibility in UNIQUE’s favor.
Conclusions
Twenty hearing-aid users compared two hearing aid settings—WFR (with NAL-NL1 similarities) and WFR2 (with NAL-NL2 similarities)—in the field and in the laboratory. There were only small differences in outcomes for the two settings. WFR produced better speech tests results for low-level speech, but a number of participants indicated that it provided excessive loudness.
We did not see a reason to radically change our prescription. It was decided to keep the gain-frequency response shape of the WFR, but to reduce the overall gain slightly. WFR, which prescribes more gain than NAL-NL2 for low and middle frequencies, provided very good sound quality, reported by the participants after the UNIQUE field trial. Speech intelligibility in noisy situations (when UNIQUE WFR is combined with the SII-based noise reduction) was superior to the speech intelligibility measured using the participants’ own hearing aids.
References
-
Smeds K, Dahlquist M, Paludan-Müller C, Larsson J, Hertzman S, Båsjö S. Proprietary hearing aid gain prescriptions: Changes over time. Hearing Review. 2015;22(5)[May]:16-22. Available at: https://hearingreview.com/2015/04/proprietary-hearing-aid-gain-prescriptions-changes-time
-
Kuk F, Schmidt E, Jessen AH, and Sonne M. New technology for effortless hearing: A “Unique” perspective. Hearing Review. 2015;22(11)[Nov]:32-36. Available at: https://hearingreview.com/2015/10/new-technology-effortless-hearing-unique-perspective
-
Byrne D, Dillon H. The National Acoustic Laboratories’ (NAL) new procedure for selecting the gain and frequency response of a hearing aid. Ear Hear. 1986. 7(4):257-65. doi: http://dx.doi.org/10.1097/00003446-198608000-00007
-
Moore BC, Glasberg BR, Stone MA. Use of a loudness model for hearing aid fitting: III. A general method for deriving initial fittings for hearing aids with multi-channel compression. Br J Audiol. 1999. 33(4):241-58.
-
Moore BC, Glasberg BR, Stone MA. Development of a new method for deriving initial fittings for hearing aids with multi-channel compression: CAMEQ2-HF. Int J Audiol. 2010. 49(3):216-27. doi: 10.3109/14992020903296746.
-
Gabrielsson A, Hagerman B, Bech-Kristensen T, Lundberg G. Perceived sound quality of reproductions with different frequency responses and sound levels. J Acoust Soc Am. 1990. 88(3):1359-66.
-
Keidser G, Dillon H, Flax M, Ching T, Brewer, S. The NAL-NL2 prescription procedure. Audiol Res. 2011. 1(e24):88-90. doi: http://dx.doi.org/10.4081/audiores.2011.e24
-
Nilsson MJ, Soli SD, and Sullivan JA. Development of the Hearing In Noise Test for the measurement of speech reception thresholds in quiet and in noise. J Acoust Soc Am. 1994. 95(2):1085.
-
Hällgren M, Larsby B, and Arlinger S. A Swedish version of the Hearing In Noise Test (HINT) for measurement of speech recognition. Int J Audiology. 2006. 45(4): p. 227-237.
-
Kuk F, Lau CC, Korhonen P, Crose B, Peeters H, Keenan D. Development of the ORCA nonsense syllable test. Ear Hear. 2010. 31(6):779-95. doi: 10.1097/AUD.0b013e3181e97bfb.
-
van Buuren RA, Festen JM, and Plomp R. Evaluation of a wide range of amplitude-frequency responses for the hearing impaired. J Sp Hear Res. 1995. 38:211-221.
-
Dawes P, Powell S, Munro JK. The Placebo effect and the influence of participant expectation on hearing aid trial. Ear Hear. 2011;32(6):767-774.
-
Holube I, Fredelake S, Vlaming M, and Kollmeier B. Development and analysis of an International Speech Test Signal (ISTS). Int J Audiol. 2010. 49(12):891-903. doi: 10.3109/14992027.2010.506889.
Karolina Smeds, PhD, is director at Widex research group ORCA Europe, Stockholm, Sweden, where Martin Dahlquist, MSc, and Florian Wolters, BSc, are research engineers, and Josefina Larsson, BSc, and Sofia Hertzman, BSc, are research audiologists.
Correspondence can be addressed to HR or Dr Smeds at: [email protected]
Original citation for this article: Smeds K, Dahlquist M, Wolters F, Larsson J, Hertzmann S. Widex Fitting Rationale: A Need for a Change? Hearing Review. 2016;23(1):24.?