One of the most reasonable expectations for the role of digital signal processing (DSP) in commercially available hearing is a product feature that simply cannot be employed in analog devices. Although the commonly mentioned desires in advanced technology products include noise reduction and directionality, there are a variety of perhaps less apparent—but equally important—features that are now available. Although not necessarily addressing the main audiological dimensions, these secondary dimensions account for many of the side effects that hinder the successful adaptation to amplification.1-3
For example, continuously active acoustic feedback algorithms can now be implemented due to the availability of DSP platforms. These approaches allow for the elimination of feedback without sacrificing any gain in the hearing aid response. Interestingly, this functionality has been used in an even more intriguing manner in a new product by Oticon called Adapto. The effectiveness of the feedback cancellation circuitry is used to offer patients nearly open fittings, thereby significantly reducing the occurrence of one of the most bothersome side effects of a hearing aid: the occlusion effect. Due to an extremely short processing time through the DSP circuitry (3 ms), the products can be fit with very large vents. Because of these short processing times, there is no perceptible echo effect as natural, direct sound mixes with the amplified signal. The Dynamic Feedback Cancellation circuit is designed so that patients can use greater than 30 to 35 dB of insertion gain in the high frequencies without acoustic feedback.
The new two-channel DSP instrument also incorporates a signal processing approach that allows fully prescribed amplification when speech is present, and a more comfortable processing mode when speech is not present. This new processing approach, called VoiceFinder, was developed to reduce the long-term fatigue and annoyance associated with wearing a hearing aid all day every day.
Adapto incorporates a two-stage architecture: seven independent response shaping bands followed by two channels of fully adjustable compression. The frequency response and gain and compression characteristics are prescribed based on one of four proprietary fitting rationales. The selection of the rationale is based on a variety of input variables in addition to the audiogram.
This selection process is based in a large part in data presented by Gatehouse.4 For example, evidence suggests that patients with flat audiograms and wide dynamic ranges prefer a more linear setting of the compression characteristics, as long as their daily sound environments were not too dynamic. Older patients whose cognitive system has begun to act less efficiently tend to perform best with slower acting compression characteristics.
The fitting of the product includes extensive use of multi-media material to enhance the demonstration, training, and fine-tuning of the product.
Clinical Evaluation
In order to verify the expected benefits of the new DSP-mediated features, a program was developed to track the initial dispenser and patient experiences with this new brand of custom products. Part 1 of this research program was to have the patients provide their impressions of the effectiveness of the new product after at least 2-3 weeks of use. Part 2 of the program was designed to give hearing health care professionals who have accumulated a significant amount of fitting experience with these products, the opportunity to express their overall impression of the effectiveness of the devices and software. The dimensions evaluated were specifically designed to touch on the new features of the product and determine if the expected benefits are actually perceived by the dispensing professional. These expected benefits include:
- Less occurrence of acoustic feedback;
- Less occurrence of occlusion;
- Better sound quality (due to direct natural sound);
- Less long-term annoyance (due to VoiceFinder function); and
- Better acceptance of initial fit (due to side-effect reduction and more precise selection of fitting rationales)
|
Table 1. Previous User Questionnaire |
|
|
|
|
For Part 1, 40 clinics were asked to fill out a questionnaire on the first five patients fit with a custom (non-BTE) version of Adapto between 2-3 weeks after the initial fitting. The questionnaire covered areas such as speech understanding, comfort, sound quality, etc. (Tables 1 and 2, see page 52). Both first-time users and experienced hearing instrument users were included. First-time users made direct ratings. Experienced users made ratings compared to their most recent hearing aid. Data were collected from a total of 195 patients fit between November 2001 and January 2002. The sample consisted of 99 first-time and 96 experienced hearing aid users. Prior to the Adapto fittings, the experienced users were using a broad range of available technology, from simple linear devices (26%), to programmable (18%), and digital (56%) technology.
|
Table 2: New User Questionnaire |
|||||
1. Cosmetic appeal of the instrument(s):
|
|||||
2. The physical comfort of these hearing aids are:
|
|||||
3. Clarity of speech in quiet:
|
|||||
4. I have experienced whistling when wearing these instruments:
|
|||||
5. Understanding speech in noise was:
|
|||||
6. Wearing the hearing aids with no speech present, ambient sound, such as traffic noise are:
|
|||||
7. My own voice is:
|
|||||
8. Overall sound quality:
|
|||||
9. Overall, my performance with these hearing aids is:
|
|||||
10. Adjustment to amplification was:
|
For Part 2 of the research, the primary staff member from 67 clinics that performed at least 10 Adapto fittings was asked to complete the questionnaire shown in Table 3.
|
Table 3: Clinic Questionnaire |
|||||
1. Size of instruments:
|
|||||
2. Size compared to other manufacturers:
|
|||||
3. Ease of using fitting software:
|
|||||
4. Immediate patient acceptance of amplification (reduction of side effects counseling):
|
|||||
5. Overall patient satisfaction:
|
Results
Experienced Users. Figure 1 provides the data from the experienced users. For each dimension, the category shown on the left (ie, red bar) represents the response “Own hearing aid much better” and the category shown on the right (dark green bar) represents “New hearing aid much better.” On all parameters, except “Cosmetics” and “Physical Feel,” more than 50% of the responses indicated that the new device was either “better” or “much better.” The proportions in favor of the new devices were greatest for “Overall Sound Quality” and “Overall Preference.” Less than 20% of the respondents indicated that their own hearing instruments were “Better” or “Much Better” than the new device in any of the parameters. Statistically, the proportions of responses in favor of “Own device” were compared to the proportions favoring “New device”. On all nine dimensions, a significantly (p<.01) greater number of responses were in favor of the new device.
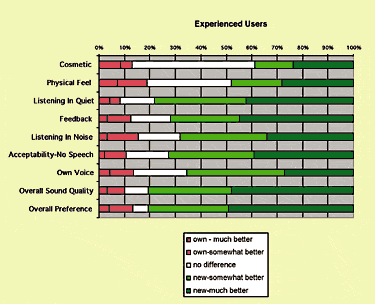
Figure 1. Experienced users responses to various parameters relative to their preference for their own/previous hearing aids vs the test instrument. |
An analysis was performed to determine if the differences between “Own" device and “New” device were affected by the class of technology the patients were previously using. Although the trend indicated that previous users of non-digital devices report a greater proportion of response in favor of the new device, this trend did not reach statistical significance.
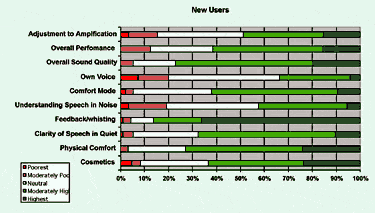
Figure 2. New users responses to various parameters relative to their preference for their own/previous hearing aids vs the test instrument. (Scales varied for some items; see note in text and Table 2.) |
New Users. Figure 2 provides the questionnaire results for new users of hearing instruments. As can be seen in Table 2, the scale varies for each item. However, in general, the first two categories on the left (ie, red and pink bars) represent poor ratings, and the two categories on the right (ie, green and dark green bars) represent positive ratings. As can be seen, on all scales except “Own Voice” and “Speech in Noise,” the positive ratings account for over 50% of the responses. On no scale do the negative ratings account for more than 20% of the responses. The proportion of responses in the poor categories were statistically compared to the proportion of responses in the positive categories. For all scales except “Own Voice,” a significantly (p<.01) greater proportion of responses were positive. On the “Own Voice” dimension, the proportion of positive response was statistically greater than negative responses at the p<.05 level of significance.
The “Own Voice” ratings provide an interesting contrast between experienced and first-time users. Individuals who have been using amplification for some time realize the problems with occlusion, and thus can easily identify the improvements with the new device and the Open Ear Acoustics concept. However, first-time users are less cognizant of the negative effects that occlusion can pose in traditional hearing aid fittings. Therefore, their ratings of “Own Voice” are generally neutral. These findings are consistent with unstructured comments that hearing health care professionals have made since actively dispensing this product: Experienced users are impressed by the new instrument because they understand the potential negative side effects in traditional fittings, whereas new users are generally happy with the new product, but simply are not experienced enough to appreciate the occlusion-reduction technology.
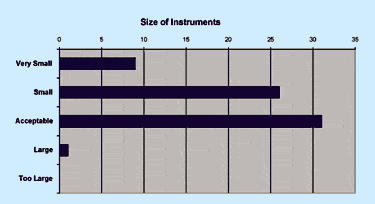
Figure 3. The physical size of the test instrument, as rated by dispensing professionals. |
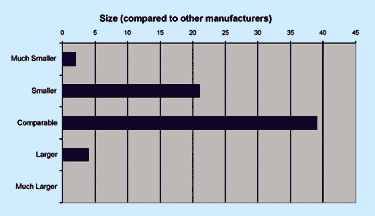
Figure 4. The size of the test instrument compared to other hearing instruments, as rated by dispensing professionals (in %). |
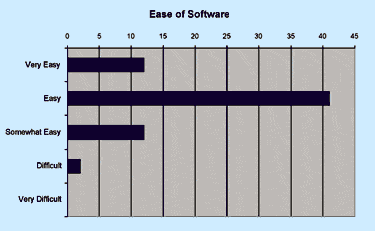
Figure 5. Ease of use of the software (Genie) as rated by dispensing professionals (in %). |
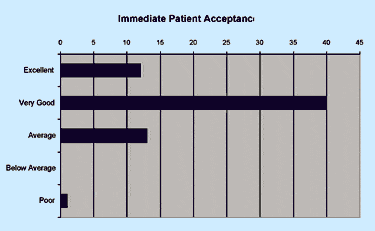
Figure 6. Immediate patient acceptance, as rated by dispensing professionals. |
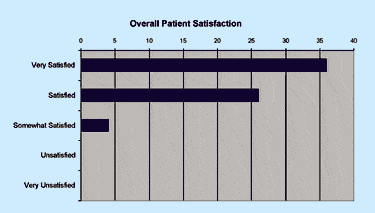
Figure 7. Overall patient satisfaction, as rated by dispensing professionals. |
Dispensing Professionals’ Views. Figures 3-7 provide data from Part 2 of the research in which the hearing health care professionals rated various aspects of the product and fitting software. Figures 3 and 4 indicate a general agreement that the size of the instrument was acceptably small, especially compared to other manufacturers. Figure 5 indicates that the Genie fitting software was rated as “Easy” or “Very Easy” by the vast majority of professionals. Most importantly, Figure 6 and 7 indicate that most professionals feel that their patients have “Very Good” immediate acceptance and are “Satisfied” or “Very Satisfied” with the fittings.
Given the difficulties of the hearing industry in penetrating the large population of patients who choose not to use amplification, these high rates of immediate acceptance and overall satisfaction are encouraging.
Summary
Despite important advances in hearing aid technology over the past decade, the hearing aid fitting experience still tends to be a process of problem-solving. The lack of individualization in prescriptive techniques and the presence of significant side effects require patients to balance the pros-and-cons of using hearing aids.
An attempt to resolve some of the immediate barriers (ie, feedback and occlusion) to immediate user acceptance has been made with the Adapto instrument, and the fitting process has been designed to be more engaging and personalized. The patient and family are pulled into the process and a solution is developed. Results from this initial investigation indicate that hearing health care professionals will have to spend less time trying to solve problems that have historically been inherent in the fitting process.
This article was submitted to HR by Donald J. Schum, PhD, vice president of audiology & professional relations, and Randi R. Pogash, MS, manager of clinical product evaluation, at Oticon Inc, Somerset, NJ. Correspondence can be addressed to HR or Donald Schum, Oticon Inc, 29 Schoolhouse Rd, Somerset, NJ 53711-2497; email: [email protected].
References
1. Dillon H, Birtles G, Lovegrove R. Measuring the outcomes of a national rehabilitation program: normative data for the Client Oriented Scale of Improvement (COSI) and the Hearing Aid User’s Questionnaire (HAUQ). J Amer Acad of Audiol. 1999;10:67-79.
2. Kochkin S. MarkeTrak V. “Why my hearing aids are in the drawer”: the consumer’s perspective. Hear Jour. 2000;53:34-42.
3. Schum D. Annoyance and hearing aids. Audiology Online. Available at: www.audiologyonline.com/audiology/newroot/articles/arc_disp.asp?id=247&catid=1. Accessed January 17, 2001.
4. Gatehouse S. Auditory ecology and its influence on the benefits of non-linear signal processing in hearing aids. Paper presented at: Oticon Human Link Conference; November, 2000; Ft Lauderdale, Fla.


