Although digital hearing instrument technology is being used in an ever increasing percentage of hearing aid fittings, scientific measurement of key digital performance features (either in a test box or on the patient’s ear) is still rarely a part of the typical digital hearing aid fitting process. Since key digital performance features are not being tested or measured as part of the fitting process, their benefits are not being verified, either for the clinician or for the patient. As a result, digital hearing aid fittings continue to yield the industry’s highest, and most expensive, return-for-credit percentages.
Recent advances in test signal formulation, measurement technology, and measurement methodology now offer even busy clinics an effective way to measure key digital hearing instrument features, thus verifying their functionality and providing the patient with a much better understanding and appreciation for what they are purchasing.
Today’s Hearing Aid Fitting Realities
In his annual year-end report, Strom1 chronicled that 45% of all hearing aids sold in 2002 were digital aids, compared to 27% in 2001, and this percentage will increase to nearly 80% by the end of 2004. It is clear that, within the past 4 years, digital hearing instrument sales growth as a percentage of total hearing aid sales has been staggering. Yet, even with this rapid increase in digital technology penetration, the overall sales of hearing aids in the United States during the last 5 years has been relatively stagnant, if not in decline.
One rational explaining the decrease in overall hearing aid sales in the presence of increased digital market share is the unique “price vs. value” mismatch digital hearing aids have introduced into the hearing aid buying decision. The mismatch is between the higher purchase prices that digital hearing aids command and the purchaser’s perception of their commensurate performance value. To lend credence to the “price vs. value” mismatch theory, one can look at the return-for-credit (RFC) statistics for digital products in comparison to other hearing aid technologies. Strom1 reports that over 25% of the digital hearing instruments purchased in 2003 were returned to the manufacturers for credit. This compares to a 17% RFC for programmable devices, and a 13% RFC for conventional devices. This RFC data indicates that, once a consumer has had a chance to use a hearing aid, they are twice as likely to return a digital product as they are a conventional product.
Certainly this disparity is not because digital hearing aids are poorer performers than conventional products. Rather, the traditional methods by which consumers learn to understand and experience the various performance advantages digital products are designed to offer does not provide them with a value perception that equals the cost.
The main issue facing hearing health care providers today is that the alleged value of digital technology cannot readily be quantified or verified in the clinical setting—either for the caregiver or for the patient. This is largely due to the fact that advances in digital hearing aid design and performance function have (until only recently) outpaced advances in measurement equipment design and measurement standards—especially measurement equipment that can be used at the clinical “patient care” level. As Robert Sandlin, PhD, has stated, “There is an overwhelming need for audiologists to [incorporate] new test batteries [into their clinical procedures] to assess the advantages of DSP hearing instruments.”2
What Valid Clinical Verification Should Accomplish
Valid clinical verification of digital performance functions must answer the fundamental questions of both the clinician and the patient. For the clinician, the most fundamental questions to answer is, “Does it work? Do the unique signal processing functions of this digital hearing aid (ie, its directionality, noise reduction, feedback suppression, etc.) actually do what the manufacturer has indicated they are supposed to do?” In order to answer this question, the clinician will want to conduct scientifically valid measurements of the aid—both in the test box and on the patient’s ear—to verify that its digital functions are operating as expected. And, since these measurements must be made in a busy clinical practice, they must by necessity be clinically expedient measures.
For the patient, the most fundamental question to answer is, “Is It Valuable? Does this digital hearing aid system provide me with capabilities and functions that I cannot get any other way, and are these capabilities and functions worth what I am being asked to pay for them?” In order to answer this question, the patient will need to acquire a meaningful understanding of the new capabilities and advantages being provided. As is true in any process of understanding, visual and auditory demonstrations of these capabilities will increase the likelihood of their having meaningful clarity and value. And, if these auditory and visual demonstrations are scientifically founded, they move the patient’s value equation from subjective judgment to objective awareness.
The Four Key Digital Features
Today, there are literally hundreds of different digital hearing aid circuits, designs, and models available for the hearing health care professional to choose from. Although manufacturers may use differing approaches and signal processing strategies in designing their digital hearing aid solutions, at present these solutions generally fall into four main performance categories:
- The “Audibility Window” and Precise Recruitment Accommodation through multi-band wide dynamic range compression or digital filtering;
- Enhanced Directionality through digitally controlled sensitivity patterns;
- Noise Reduction through speech modulation detection, and either enhancement of speech or suppression of noise (or both);
- Feedback Control through active or passive notch filtering or phase canceling.
Valid clinical verification of digital hearing aid performance should scientifically (and expediently) measure each of these main digital performance functions. In so doing, the clinician should be able to determine if these digital features are working, and the patient should be able to determine if these digital features are providing appropriate value. Part 1 of this two-part article examines how to properly attain a fitting that considers both the “audibility window” and recruitment characteristics of the patient.
Key Tools of Digital Verification Science
In order to measure these various digital performance features, the clinician needs to use the following tools:
- Real speech stimuli at various intensity levels with perceptually-relevant analysis to assess wide dynamic range compression effectiveness;
- Noise stimuli to assess the noise reduction properties of the instrument;
- Simultaneous response measures from multiple input source locations to assess the real world directional properties of the instrument;
- Real-time spectral analysis to assess the interactive properties of the instrument;
- Coupler measurements to verify functionality without the patient’s involvement;
- Real-ear probe microphone measurements to verify functionality on the patient’s ear.
With this toolbox, it is possible to analyze and quantify each of the four main digital performance features in the clinical setting.
The “Audibility Window” and Precise Recruitment Accommodation
Multi-channel wide dynamic range compression (WDRC) was originally introduced in conventional analog hearing aid technology as a means to address the frequency-specific non-linearity (recruitment) associated with moderate to moderately severe sensorineural hearing loss. In programmable aids, this analog signal processing function was refined to include an increased number of independently adjustable and overlapping compression bands.
Through digital signal processing, the number of adjustable bands, the magnitude of their overlap, the precision of their compression ratio settings, and the range of their knee points have been even further refined. As a result, a primary feature of digital hearing aid design is multi-channel WDRC for precise recruitment accommodation.
Using speech as the input signal for testing WDRC or digital filtering performance. Multi-channel WDRC or digital filtering both deliver a complex and ever-changing array of frequency-specific nonlinear amplification. Moment by moment, the gain and frequency responses of these instruments adjust in response to the changing levels and shape of the input signal received by the instrument. Thus, an input test signal that provides a multi-frequency spectrum of varying and rapidly changing intensity should be used to properly “challenge” the performance and effectiveness of these interactive processors. Speech is the multi-frequency, rapidly changing input these systems were designed to process, and thus is the most appropriate signal for assessing WDRC or digital filtering functionality.
To characterize a dynamic hearing aid’s signal processing features (ie, WDRC or digital filtering) as it is being driven by a dynamic input signal (ie, speech), the output SPL in narrow frequency bands must be sampled every few milliseconds, producing a series of time-varying spectra. In order for the analysis of this data to correlate with perceptual measures, both the width of the analysis bands and the analysis interval within each band should approximate those within the auditory system.
Historically, 1/3-octave bands have been used as an approximation of the critical bands of the auditory system, with analysis times of 120 ms-128 ms to approximate normal integration times. Using such analysis parameters, the resulting output peak measurements can be compared with threshold to determine audibility, with narrow-band MCL measures to determine comfort, and with narrow-band UCL measures to determine discomfort. In addition, the long-term average level in 1/3-octave bands (ie, the long term average speech spectrum, or LTASS) can be used to calculate the resulting speech intelligibility index, and to match amplified LTASS targets generated by fitting methods such as DSL[i/o] and NAL-NL1.
Although some might suggest that speech is too variable across many talkers to justify the use of a single voice recording to generate the LTASS, statistical measures of LTASS produced by a variety of talkers are remarkably consistent. Cox, Matesich & Moore3 reported LTASS standard deviations of 1-2 dB across 60 talkers including both male and female voices, and Byrne et al.4 reported a standard deviation in the LTASS of under 4 dB (200-4000Hz) across approximately 300 talkers, both male and female, speaking 12 different languages!
The output difference between speech stimuli and pure-tone stimuli. When measuring hearing aid performance using real-time spectral analysis, different input signals produce very different output results, even in the presence of the same dial setting.
Figure 1a-b. Top (1A): Output results obtained on two different WDRC hearing aids in the presence of four different input stimuli, all presented at 70 dB HL; Bottom (1B): Output results obtained on two more WDRC hearing aids in the presence of four different input stimuli, all presented at 70 dB HL.
Figures 1A-B (Page 32) depict the output measures of four different WDRC hearing instruments obtained using real-time spectral analysis. The blue line in each graph represents the output measured when the instrument was stimulated with a 70 dB sweep frequency pure tone. The red line in each graph represents the LTASS output measured when the instrument was stimulated with a 70 dB speech signal. Some of this difference can be accounted for by the RMS difference between 70 dB pure-tone stimulation and 70 dB speech stimulation. (This difference is identified when comparing the 70 dB pure-tone line with the pink 70 dB speech-weighted pure tone line in the figures.) The remaining difference is due to the way speech itself interacts with the WDRC system. It is clear that pure-tone tests will consistently over-estimate the output result of a WDRC instrument when that same instrument is used to process speech.
Measuring aided eardrum SPL instead of insertion gain. This output performance difference between speech and pure-tone input stimuli becomes even more important to consider when gain is used as the targeting criteria.
Figure 2. Insertion gain measures of the same hearing aid on the same ear to 70 dB pure-tone sweep frequency stimulation and 70 dB long-term averaged speech stimulation.
Figure 3. Same two measurements depicted in Figure 2, but the measurement scale is changed from insertion gain to output SPL.
Figure 2 depicts the insertion gain curves obtained when measuring a WDRC hearing instrument first with 70 dB pure-tone stimulation, and then with 70 dB speech stimulation. On an insertion gain scale these two curves look reasonably similar. However, when these same two measures are compared using an output scale rather than an insertion gain scale (as shown in Figure 3), there is a dramatic output level difference. The question then becomes, can insertion gain measures be reliably used to predict the audibility of WDRC amplified speech? This output difference data suggests that they cannot. Thus, in order to effectively measure the WDRC instrument’s ability to deliver speech energy at audible levels, the aided eardrum SPL produced by the WDRC instrument must be directly measured and compared to the patient’s SPL-based auditory area as defined by their SPL pure tone thresholds and UCL’s.
Using “audibility” as a fitting target instead of insertion gain. Audibility is both a legitimate and a preferred fitting target when compared to insertion gain targets. Clearly, the primary goal of any hearing aid fitting is to deliver audibility for signals that are naturally audible in the presence of normal hearing. Since gain measures cannot be used as a reliable predictor of delivered audibility, output then becomes the preferred fitting scale. Modern fitting systems, like the Verifit system manufactured by Etymonic Design, are designed to directly measure hearing aid output in the patient’s ear and to display the output that is measured against the patient’s SPL-based auditory area.
Figure 4 is an example of an output-scaled and SPL-based display of audiometric threshold and UCL data. Using this type of system, audiometric threshold and UCL data can be acquired using either TDH-styled supra-aural headphones, insert phones, or sound field, then the data is converted into an SPL equivalent display using either an average or measured real ear to coupler difference (RECD) correction. Scollie et al.5 have verified that the RECD can be reliably used as a level-independent transform from HL to SPL in place of direct in-situ audiometric procedures. Thus, standard audiometric test results can be easily converted to output-scaled and SPL-based audiometric data by applying the RECD.
SPL-based threshold and UCL measures define the “audibility window” or “dynamic range” associated with the patient’s hearing loss. In order for the output of the hearing aid to be both audible and tolerable, it must produce energy that falls within these two boundaries. For expediency, predicted UCL measures can be displayed (after pure-tone threshold data has been entered) using study-based average data like those calculated from the DSL (Desired Sensation Level) studies.6 With some systems (eg, Verifit), targets for the amplified LTASS for 70 dB speech, as predicted by DSL and the NAL-NL1 methods, can also be displayed within the output-based “audibility window.”
Once the patient’s SPL-based audibility window is displayed, the output of any hearing aid stimulated by speech can be measured and compared to this audibility window. In the event that amplified speech peaks are found to be above threshold, then speech detection has been verified. If the LTASS is above threshold, then the 50%-correct level has likely been reached. If the entire speech dynamic range is above threshold, then total speech audibility has likely been achieved.
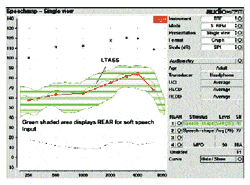
Figure 5 includes a display of the measured aided output spectrum produced at the eardrum by the fitted hearing instrument when stimulated with recorded soft speech energy (55 SPL in dB) in soundfield, and measured with a real-ear probe microphone. The programmable settings of the aid have been adjusted so that the aided LTASS falls just above threshold. There are three long-term average lines that define the soft speech aided energy envelope that is displayed. The middle line is the LTASS itself, and represents long-term average speech output of this aid in the presence of soft speech input. The top line is “L1”, representing the long-term average maxima (where measured output SPL was exceeded 1% of the time). The bottom line is “L70”, representing the long term average speech minima (where measured output SPL was exceeded 70% of the time).
L1 and L70 help to define the long-term average output “energy envelope” as delivered to the eardrum by the measured hearing aid, and the middle line defines the location of the aided LTASS within the patient’s auditory window. The goal when fitting a hearing aid in the presence of soft speech input is to have the middle line (LTASS) fall just above the patient’s threshold for as broad a range of frequencies as possible. Typically, this would be accomplished by adjusting the band-specific gain controls of the aid being programmed while monitoring the effects of these adjustments on the real-time spectrum being displayed on the screen.
Once this fitting goal has been achieved, then the long-term average measurement is stored to obtain the LTASS result. Both audibility and the perception of soft speech energy through this hearing aid have been verified when this fitting goal has been reached.
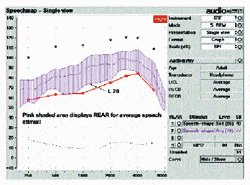
Verifying the fitting relative to threshold and UCL. To verify that the patient’s recruitment is being adequately accommodated by the frequency-specific non-linear functions of the hearing aid, a second audibility measurement can be made using average speech energy (70 SPL in dB) as the input stimulus. In the presence of this input stimulus, the compression ratio (or high-level gain) controls for each band would be adjusted until the L70 line hovers around the patient’s audible threshold (Figure 6). When this has been achieved, then maximum audibility for average speech has been verified.
It is important when conducting audibility measurements in the presence of average speech energy to ensure that L1 does not exceed the UCL line. The audibility of L70 may need to be reduced in an effort to make sure that L1 does not exceed the UCL.
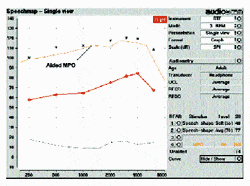
To help ensure that the output maximum of the hearing aid being fit does not produce an output that could exceed the patient’s UCL, a Real Ear Saturation Response (RESR) can also be obtained (Figure 7). This is done by stimulating the hearing aid with 85 dB tone bursts and measuring the resulting eardrum SPL with a probe microphone. The reason why a pure-tone is used for this measurement is to minimize simultaneous activation of overlapping compression bands, thus creating an acoustic environment where the hearing instrument will generate its greatest possible output levels for the gain and compression settings currently being utilized. By adjusting independent output limiting controls, such as AGC-O settings or peak-limiter settings, the hearing instruments output maxima can be positioned to stay below the patient’s UCL markers without affecting the WDRC settings used earlier to accommodate the patient’s recruitment.
By verifying that the aided output in the presence of soft and average speech inputs falls appropriately within the patient’s “audibility window,” the clinician can confirm scientifically that their fundamental goal of delivering meaningful audibility to the patient has been achieved. In addition, by using the visual instruction tools that the measurement screen provides, the patient can gain a much better understanding and appreciation for the value and benefit of digital WDRC technology.
Part 2 of this two-part series examines directional functionality, noise reduction features, and feedback suppression in digital hearing instruments.
| This article was submitted to HR by David J. Smriga, MA, a clinical audiologist and the founder and president of AuDNet, Burnsville, MN. Smriga also serves as a consultant for AudioScan, a division of Etymonic Design, Dorchester, Ont. Correspondence can be addressed to HR or David Smriga, AuDNet, PO Box 1995, Burnsville, MN 55377; email: [email protected]. |
References
1. Strom K. Looking back to move forward: The hearing instrument market in the new digital age. Hearing Review. 2003;10(3):18-25
2. Sandlin RE. Hearing Aid Amplification. San Diego: Singular Publishing; 2000.
3. Cox R, Mateisch J, Moore J. Distribution of short-term rms levels in conversational speech. J Acoust Soc Am. 1988;84(3):102-107.
4. Byrne D, Dillon H, Tran K, Arlinger S, et al. An international comparison of long-term average speech spectra. J Acoust Soc Am. 1994;95(4):2108-2120.
5. Scollie S, Seewald R, Cornelisse L, Jenstad L. Validity and repeatability of level-independent HL to SPL transforms. Ear Hear. 1998;19(5):407-413.
6. Cornelisse L, Seewald R, Jamieson D. The Input/Output (i/o) Formula: A Theoretical To the Fitting of Personal Amplification Devices. J Acoust Soc Am. 1995;97(3):1854-1864.


