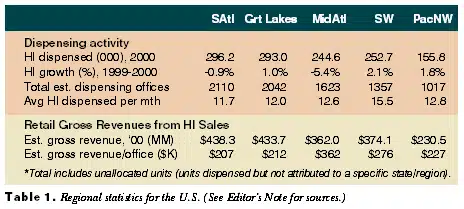
The picture that emerges from a regional analysis of hearing instrument sales in 2000 is not particularly good or bad. For the most part, it’s just flat. There was a net total of 1.73 million hearing instruments dispensed in the U.S. when disregarding sales to the Dept. of Veterans Affairs (VA), or 0.3% more than in 1999 (Table 1). When including sales to the VA, hearing instruments dispensed in the U.S. during the year 2000 totalled 1.93 million units for a 2.0% increase over 1999 sales figures.
Looking at year 2000 hearing instrument unit sales by state and by region, it can be seen that there were only nominal changes from the previous year:
|
|||
| Southwest Pacific Northwest & Mtn South Central Great Lakes South Atlantic North Central New England East South Central Mid-Atlantic |
2.1% 1.8% 1.2% 1.0% -0.9% -1.2% -2.2% -3.6% -5.4% |
||
With the exception of the Mid-Atlantic region, which experienced a sales shortfall of -5.4%, most of the other regions were relatively flat relative to sales gains/losses. In general, the southern states fared slightly better than the northern states. The top-five dispensing states, which account for more than one-third (36.4%) of all hearing instruments dispensed in the U.S., and have historically served as a good indicator for overall sales, tell much of the story for 2000:
| State | units | %change |
| CA | 182,869 | 1.4 |
| FL | 145,965 | -1.1 |
| PA | 105,372 | -2.4 |
| TX | 96,961 | 1.5 |
| NY | 90,617 | -2.6 |
| Total | 621,784 | -0.4 |
The five-largest hearing instrument dispensing states experienced a net sales loss of about 2600 units, for a -0.4% decrease, compared to the total market’s gain of 0.3% (not including VA sales). None of these states experienced a sales gain of more than 2% or a loss of more than 3%.
The regions below are grouped to conform to U.S. Census Bureau information, and the statistics for each region come from figures reported by the Hearing Industries Assn.( HIA).


South Atlantic
The South Atlantic region comprises about 18.3% of the U.S. population and accounts for 17.3% of all hearing instruments dispensed. The past three years have not been particularly kind to this region, and hearing instrument sales growth has been virtually non-existent. In 2000, unit sales went down by a percentage point (-0.9%). Florida, which comprises about half of the region’s hearing instrument sales volume, has experienced zero or negative sales in the past three years, with a -1.1% loss in 2000, preceded by a -1.7% loss in 1999 and no gain (0.0%) in 1998.
| South Atlantic (WV, MD, DE, VA, NC, SC, GA, FL) Past five years Unit Sales Gain/Loss (from prev. yr) |
||||||||||
|
Dispensing activity in Georgia (2.3%), Delaware (3.1%) and North Carolina (3.5%) were the bright spots in the region, while sales in Virginia (-2.1%), Maryland and DC (-2.6%) and South Carolina (-0.6%) fell slightly below 1999 levels. West Virginia, one of the smaller dispensing states in the U.S. with only about 110 dispensing offices, saw its hearing instrument sales fall by 9.0%.
Great Lakes
Hearing instrument sales in the Great Lakes region increased by 1% in 2000 after virtually no sales gains/losses in the previous two years. Indiana (6.8%) and Michigan (5.2%) posted healthy sales increases during 2000, following an increase of 2.0% and a decrease of -0.6% respectively in 1999. Wisconsin (-5.8%) experienced the worst sales shortfall in the region during 2000, while smaller losses were witnessed by Illinois (-2.0%) and Ohio (-0.7%).
| Great Lakes (WI, IL, IN, MI, OH) Past five years Unit Sales Gain/Loss (from prev. yr) |
||||||||||
|
The region comprises about 16.2% of the U.S. population and accounts for 17.2% of U.S. hearing instrument sales.
Mid-Atlantic
In 1998, the Mid-Atlantic states accounted for nearly half of all the hearing instrument sales gains in the U.S. After strong sales growth between 1995-98, this region experienced the worst regional sales loss in the U.S. during 2000 (-5.4%). The biggest surprise was a 15.4% unit volume decrease in sales for New Jersey (the second worst decrease in the country after Vermont’s -17.8%).
| Mid-Atlantic (NY, NJ, PA) Past five years Unit Sales Gain/Loss (from prev. yr) |
||||||||||
|
While HR dispensing office estimates are based on circulation figures and can vary considerably, there was a sizable decrease in dispensing offices for the state, which may have something to do with the poorer sales. Whatever the reason, the slight sales decreases in Pennsylvania (-2.4%) and New York (-2.6) look minor in comparison.
Southwest and HI
The Southwest is the only region during the year 2000 in which every state witnessed hearing instrument sales gains. The region experienced a net unit volume increase by 2.1% over 1999 sales. Leading the pack were New Mexico (7.8%), Arizona (3.9%) and Hawaii (3.4%), while California (1.4%) and Nevada’s (1.3%) sales were relatively flat. This region still has tremendous growth potential as it has more than 5000 adults over age 55 per office in each state, and the population growth of seniors in Arizona, New Mexico and Nevada is burgeoning.
| Southwest & HI (CA, AZ, NM, NV, HI) Past five years Unit Sales Gain/Loss (from prev. yr) |
||||||||||
|
Pacific Northwest, Mountain States and AK
A consistent region in terms of overall market growth, some states in the Pacific Northwest experienced large hearing instrument unit volume gains. The states of Idaho (16.1%) and Colorado (15.6%) posted the largest unit volume gains in the country during 2000, while Wyoming (4.2%) and Montana (4.5%) experienced solid market growth.
| Pacific NorthWest & Mtns. (WA, OR, ID, MT, WY, UT, CO, AK) Past five years Unit Sales Gain/Loss (from prev. yr) |
||||||||||
|
Unfortunately, unit sales in the larger dispensing states of Washington (-5.2%) and Oregon (-2.2) counterbalanced these gains. Alaska (the smallest dispensing state) witnessed a 13.4% decline in its sales—the third worst in the U.S. during 2000. Overall, the region saw its sales increase by 1.8%.
North Central and Midwest
The Midwest saw hearing instrument unit volumes decrease slightly (-1.2%) after being the only region to have a significant sales decrease (-6.5%) in 1999. In 2000, Missouri, the region’s largest dispensing state, saw sales rise by 4.6% and Kansas (2.9%) also witnessed a slight sales upturn after both states experienced poor sales during 1999 (-7.9% and -5.7% respectively).
| North Central & Midwest (MN, IA, NE, KS, MO, ND, SD) Past five years Unit Sales Gain/Loss (from prev. yr) |
||||||||||
|
The comparatively smaller dispensing states of Iowa (-1.9%), North Dakota (-2.4%), Nebraska (-3.2%) and South Dakota (-3.4%) witnessed sales fall modestly. Minnesota (-6.9%) continued to experience poor unit volume levels after a large decrease (-10.8%) in 1999.
South Central
The South Central states experienced a hearing instrument sales increase of 1.2%, and have posted positive sales gains going back to 1995. Texas, which is the country’s fourth largest dispensing state and comprises 64% of the South Central region’s sales, witnessed a small unit volume increase of 1.5%.
| South Central (TX, OK, AR, LA) Past five years Unit Sales Gain/Loss (from prev. yr) |
||||||||||
|
The rest of the region’s sales were similarly flat. Louisiana (2.5%) and Oklahoma (0.4%) had comparatively small sales gains, while Arkansas had a sales decrease of -1.1%.
New England
Historically, New England has been one of the most steady achievers among regions, continually posting moderate hearing instrument unit gains of 4-5% each year. Unfortunately, the streak came to an end in 2000 with a slight sales decrease of -2.2%. Only the smaller dispensing states of New Hampshire (6.4%) and Rhode Island (4.4%) saw sales increase in 2000.
| New England (VT, NH, ME, MA, CT, RI) Past five years Unit Sales Gain/Loss (from prev. yr) |
||||||||||
|
The comparatively larger dispensing states of Massachusetts (-2.9%) and Connecticut (-1.2%) posted mild sales decreases. Vermont experienced the worst sales decline (-17.8%) in the U.S. during 2000, although it should be acknowledged that it is the third smallest state (after AK and WY) in terms of the number of dispensing offices. Maine experienced a sales downturn of -3.5%.
East South Central
Hearing instrument unit volume sales in the East South Central region took a 3.5% fall during 2000 after posting the largest gain of any region in 1999 (5.4%). Every state in the region saw sales declines in 2000: Tennessee (-6.1%), Kentucky (-3.3%), Mississippi (-2.9%) and Alabama (-0.7%).
| East South Central (KY, TN, MS, AL) Past five years Unit Sales Gain/Loss (from prev. yr) |
||||||||||
|
Overall, the East South Central states have been witnessing steady sales growth, although HR figures indicate that the region still lags behind others in dispensing offices per capita and market penetration.
| Editor’s Note: The statistics in this article are derived from the quarterly statistics of the Hearing Industries Assn. (HIA) and represent hearing instrument manufacturer net unit sales to dispensers. All figures in this survey do not include unallocated units or sales to the government (i.e., VA) unless noted. Retail gross revenue estimates based on the average price of hearing instruments as reported in the annual HR survey (June 2000) and extrapolated to HIA state-by-state sales figures. Because the majority (76%) of dispensing professionals “bundle” their testing, service and follow-up fees with hearing instrument costs, the gross revenues represent more than charges for the hearing instruments only. Thus, revenue figures are presented as a relative gauge of the hearing instrument market at the retail level (i.e., third party discounts, leasing programs, etc., are not included in the calculations). |
Karl Strom is editor of The Hearing Review. Correspondence can be addressed to Karl Strom, Hearing Review, 4131 E. Superior St., Duluth, MN 55804; email: [email protected].
