How the “observer effect” can present a challenge for accurately measuring the acoustic properties of closed domes in the ear.
By Friso van Noort, Oleg Antoniuk, PhD, and Yakup Kilic, PhD
Whenever we refer to the observer effect, we probably have associations with quantum mechanics and not with hearing health. The observer effect occurs when observing a situation or phenomenon necessarily changes it, as mentioned by Baclawski.1 An example of the observer effect from classical mechanics would be measuring the pressure in an automobile tire. This is difficult to conduct without letting out some of the air, thus altering the pressure. Could the presence of a probe tube (PT) lead to a similar effect during real ear measurement (REM) when closed and double domes are used?
Traditional hearing aids rely mostly on ear shells made according to the shape of a silicone impression taken from the individual’s ear. Next to acoustic performance, such an earpiece should also provide enough wearing comfort and retention to keep everything in place.
The use of domes instead of custom earpieces has become more popular over the last two decades. The dome is an “instant fit” earpiece made from silicone materials or silicone like materials. Until recently, little research has been done on the acoustical effects of fitting these instant ear tips. Newly published research work by Cubick et al2 gives audiologists (AuDs) and hearing care professionals (HCPs) a better understanding of various dome types and their acoustic effect in the ear.
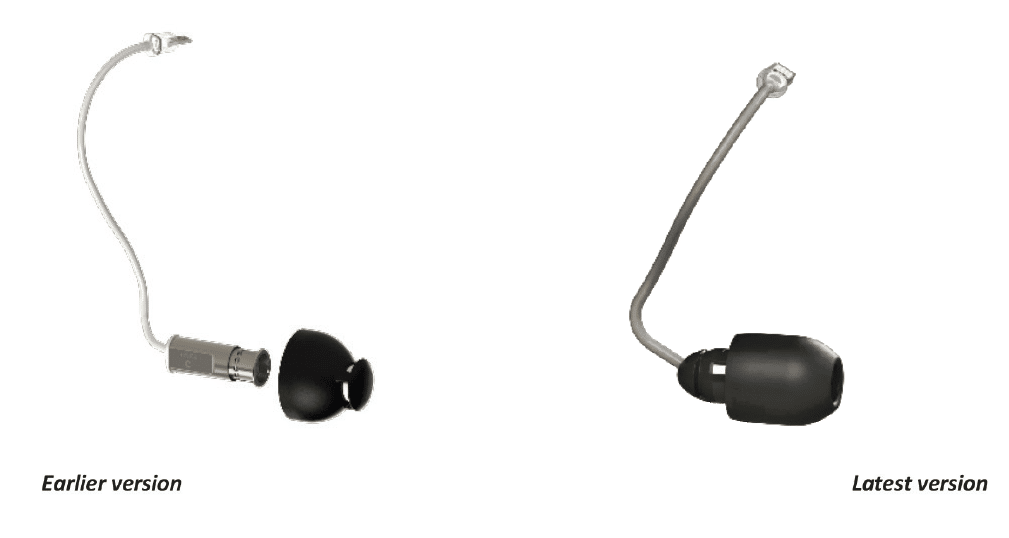
At Sonion, we noticed the complexity when we tried to classify the acoustic effects of closed domes during the development of our recent valve receiver-in-canal (VRIC), which can switch between an open and a closed state (Figure 1).
When it comes to fitting this product mechanically and acoustically in the ear canal, our in-house lab results contradict REM outcomes from other published results. Because of this mismatch, we have reason to believe that an essential fact about REM with closed domes is consistently overlooked. We point to the situation where we aim for a well sealing (closed) dome. In the latest research,2 it is referred as a double dome. We suspect that during their measurements, the PT presence in the ear canal acts as a temporary vent effect due to alteration of the mechanical state. In a paper by Berger,3 the author mentions this vent effect, but no measurement data is presented to quantify the amount of the unintentionally created leak.
In this work, we aim to investigate if the probe tube indeed leads to a vent effect in REM measurements and how significant it is. To this end, we designed the following three experiments to prove or disprove the hypothesis.
Experiment 1
Setup
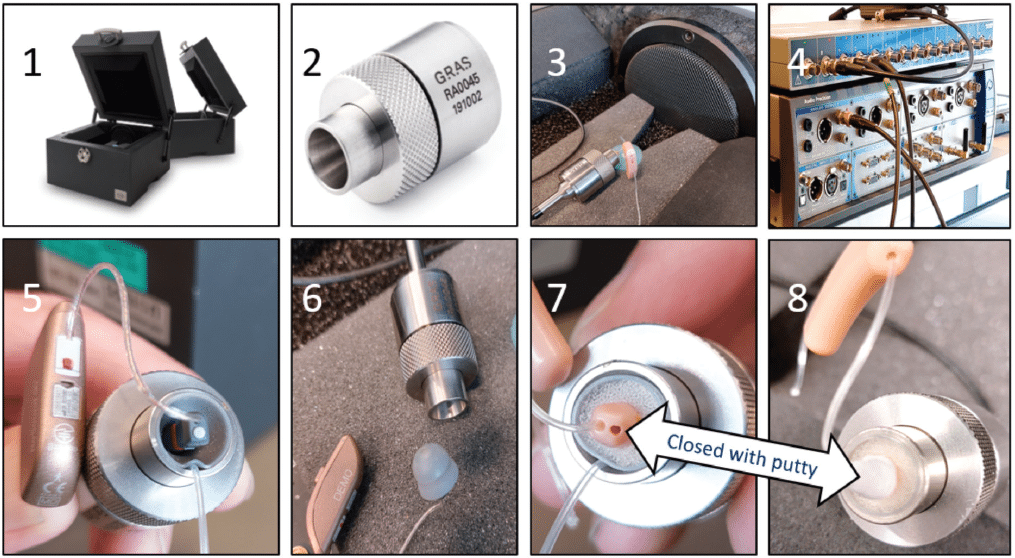
This experiment is to explore how efficiently a closed dome isolates an ear simulator from ambient sound. To calculate the seal, we compare an open-ear simulator to an occluded one. For this measurement, we use the following equipment (Figure 2):
- Interacoustics TBS25 hearing aid test box
- GRAS ear simulator RA0045
- Amplifier Sonion TE681 connected to a loudspeaker in the TBS25
- Audio Precision B series
We use two different sample RICs for our test (Figure 2). - OEM RIC with a large double dome with PT in coupler
- OEM RIC with a large double dome
- VRIC prototype (dummy) with a 10 mm dome size with PT in coupler
- VRIC prototype (dummy) with a 10 mm dome with vent channel closed with putty
Methodology
The ear simulator is placed inside the Interacoustics measurement box TBS25 (1), and a tone sweep is presented. The sound pressure level of the tone sweep is 95 dB SPL. The ear simulator microphone records the sound pressure in dBV in the open ear simulator (A2Eopen) (2). The abbreviation A2E stands for ambient to ear. The Audio Precision instrument (4) records the ear simulator microphone signal while it simultaneously drives the internal loudspeaker inside the TBS25 (3) through a Sonion amplifier.
We place our sample in the ear simulator and measure the closed simulator response (A2Eclosed) in dBV (3). The sound pressure level of the tone sweep is again 95 dB SPL.
We place a probe tube between the dome and the ear simulator entrance. The tubes we use in all experiments are from the manufacturer Etymotic. These are widely used and represent real-world conditions. A visual inspection shows that the ear simulator seal is not 100% anymore (5 and 7). We repeat the measurement, and we observe an acoustic vent effect due to this probe tube placement. We call this A2Eprobe tube. The valve RIC (VRIC) has a printed probe tube channel running through the prototype (dummy) (7). We make sure that during the measurements in the ear simulator, this vent channel is closed with putty (8). The PT is sealed with glue at the tip.
Results
We use the terms insertion loss (IL) and seal (S) somewhat loosely, while the correct real ear measurement lingo is Real Ear Occluded Insertion Gain (REOIG).
We calculate the IL (closed) = A2E closed / A2E open (dB) and IL (probe tube) = A2E probe tube / (A2E open (dB)
Experiment 1 conclusions
Both samples provide a reasonable amount of flat seal over the complete bandwidth in case the probe tube is absent. The PT presence in the ear simulator acts as a low pass filter with a corner frequency between 400 Hz – 500 Hz. The PT presence significantly affects the acoustic seal at low frequencies, and it has high similarities with REOIG double domes curves.2 The seal for the VRIC is ~25dB (250 – 500 Hz), and the seal for the OEM RIC double dome is ~37dB (250 – 500 Hz) (Figure 3).

Experiment 2
Setup
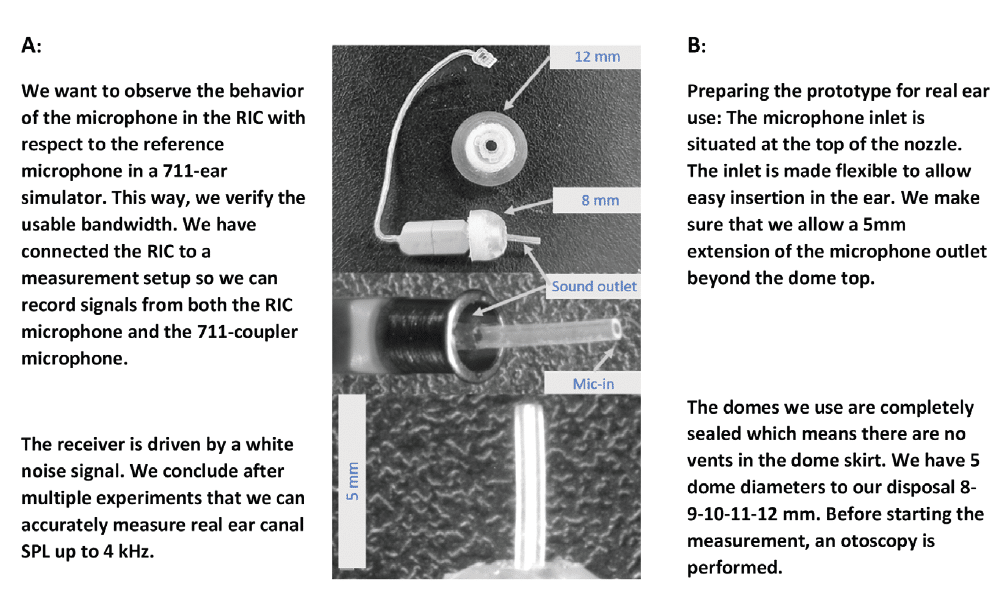
This experiment is the investigation of PT presence using a prototype in the ear canal with a 3100 BA receiver equipped with an embedded microphone (MEMS TDK T4064) placed inside the receiver’s back volume. Instead of using the PT as a measuring device, we only use the PT as a mechanical disturbance. Ten subjects (Sonion colleagues) volunteered to take part in this experiment. None of them have experience in wearing hearing aids, and before commencing, an otoscopy was performed.
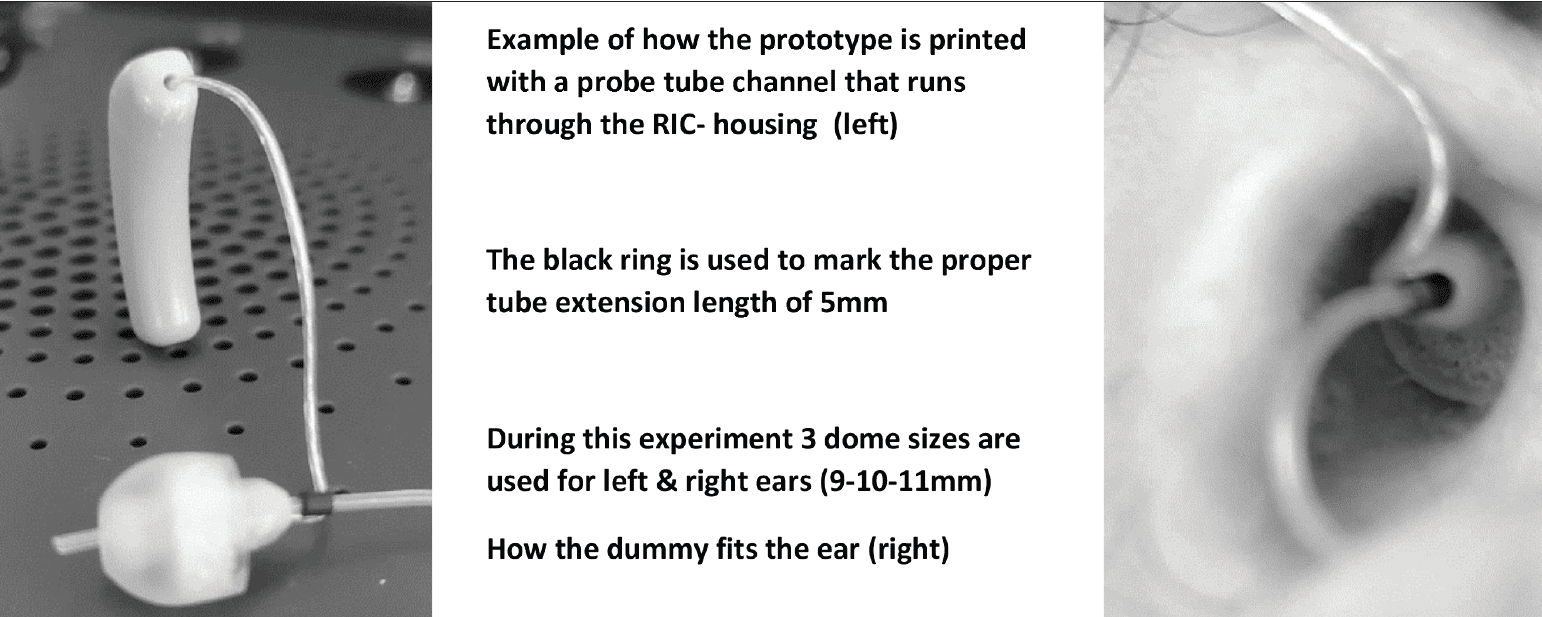
We make sure that we allow a 5mm extension of the microphone outlet beyond the dome top to avoid a proximity effect of the narrow acoustic outlet (Figure 4) as discussed in the paper by Burkhard et al.4
Methodology
The following steps are followed during the dome size selection: The dome is typically placed around the second bend of the ear canal (Figure 5).
- We select the best fitting dome based on our previous fitting knowledge, and /or the initial judgment is based on the fitting done by a hearing care professional (HCP).
- We apply +/- 1mm variant for every subject when possible. We record all the measurements with different sizes.
- We select the best sealing dome based on the lowest vent effect observed. This is calculated from the SPL slope measured with the prototype while it generates a signal inside the ear canal.
Dome selection is now the result of following a specific procedure. Normally audiologists follow a more intuitive selection of the dome size. This will be fine for starting the fitting process but an unsuitable procedure for this experiment.
We perform 30 measurements with and without the probe tube present. One subject is used to try out the procedure and is also included in the data. This brings us to 62 curves in total.
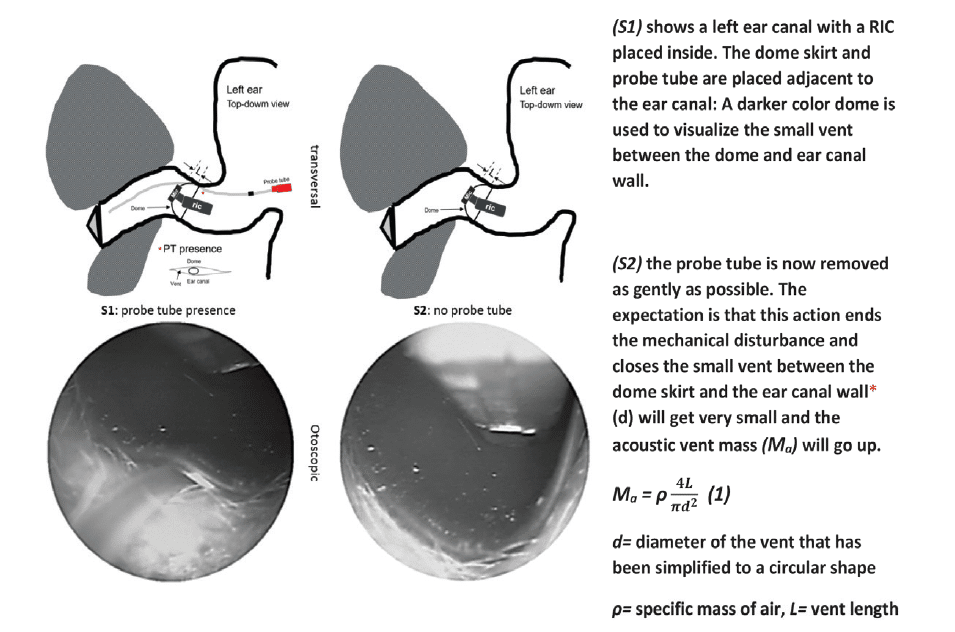
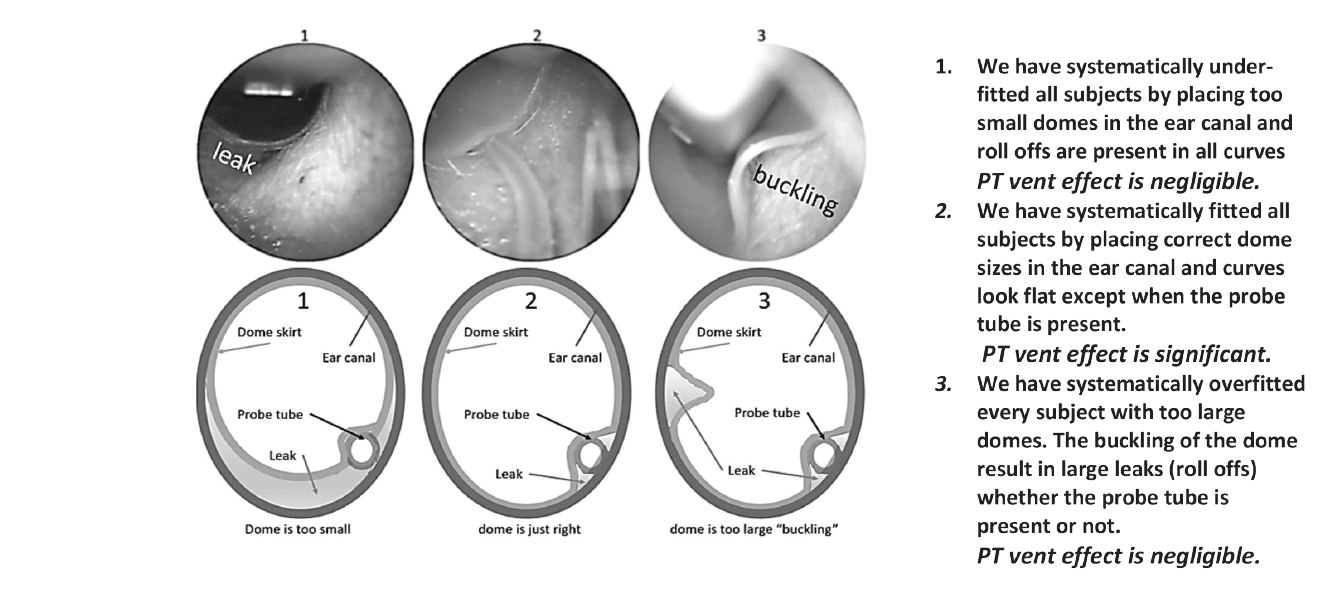
Three hypotheses are shown in (Figure 6) for how the mechanical dome fitting would influence the PT presence.
Results
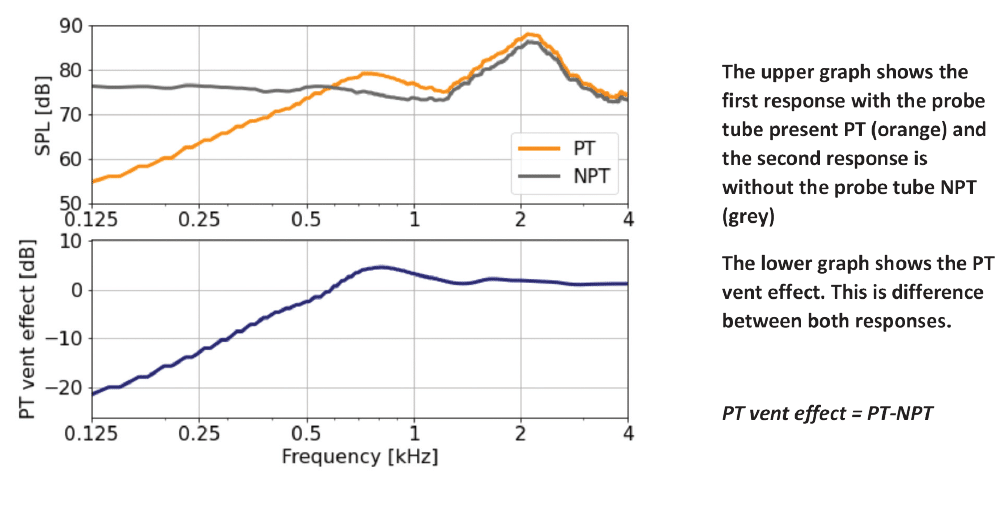
Figure 7 shows how we calculate the PT vent effect. Figure 8 shows the vent effect for 31 measurements. The measured vent effect is significant, so it points to Hypothesis 2 (Figure 6). Without the probe tube, the curves look flat, and with the probe tube in place, the curves show different roll-offs.
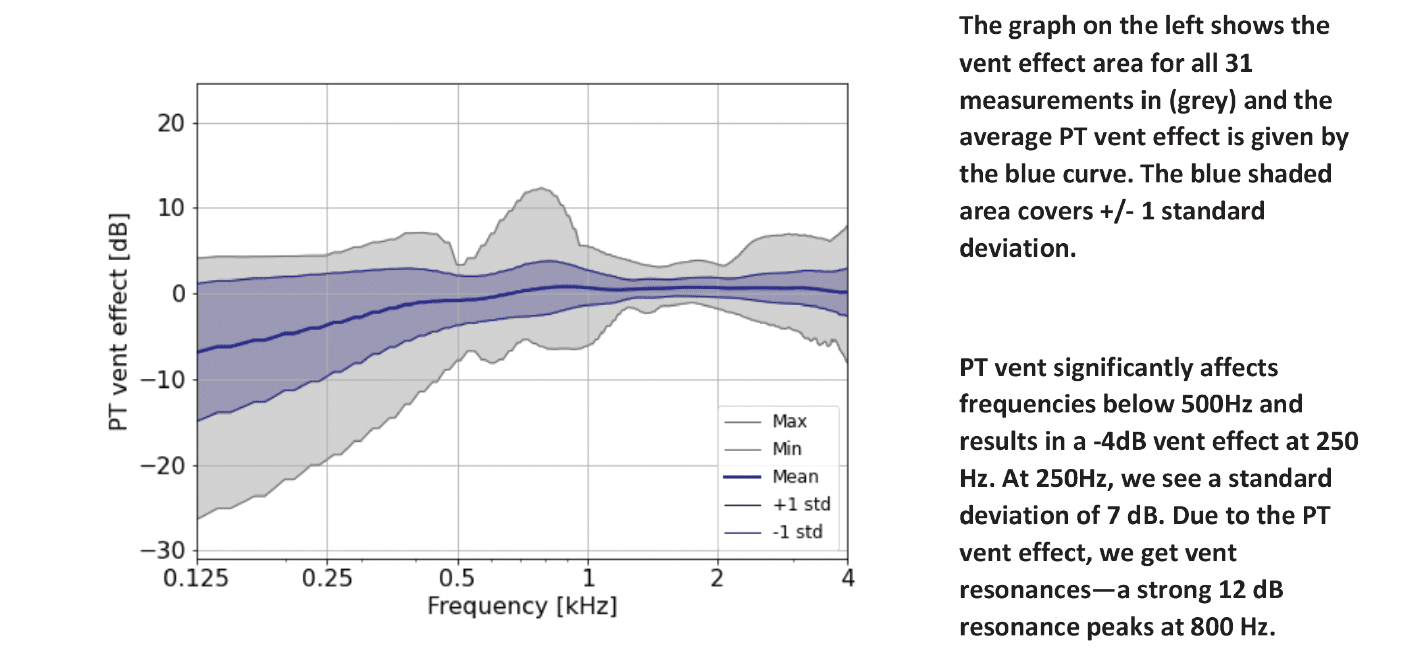
We observe different roll offs due to the probe tube vent effect. The difference between PT/NPT decreases as we go to higher frequencies (Figure 8). The histogram (Figure 9) shows the measurement accuracy at 250 Hz. Seven out of 31 cases show a high vent effect between -20 dB to -5 dB range. We also note that 6 subjects fall in this high impact range.
Interesting is how the probe tube vent effect spread is distributed, (Figure 9) shows the histogram and gives further interpretation.

Experiment 2 conclusions
From this experiment, we can conclude:
- PT vent effect is significant and more likely to add acoustic leak than to reduce it.
- We did not anticipate the reverse PT vent effect. Therefore, we assume that as we removed the PT, the dome did not fill the air gap. This results in a larger vent than the previous condition, or the tube fills a natural gap between the ear canal and the dome skirt.
- The PT presence is temporarily affecting the hearing aid gain frequency response to an unknown extent, mainly for low frequencies. There is a risk of overfitting low-frequency gains once the PT is removed. This could contribute to unnecessary loss of speech intelligibility due to the upward spread of masking discussed by Carter et al.5 Upward spread of masking is masking of higher frequency components by lower frequency components.
- There is a considerable chance the PT presence is affecting the hearing aid sound quality, as we may not provide the correct loudness once the probe tube is removed and the gains were previously matched on target.
Experiment 3
Setup
Research Institute Hörzentrum Oldenburg Germany invited (n=9) users with (n=18) ears. These subjects were previously selected for VRIC fit rate study at their clinic (Table 1). These subjects have been fitted and selected with 10 mm domes. The subjects are used to wearing hearing aids and qualify for the next “experiment.”

The REM equipment used at Hörzentrum for insertion loss measurements is Natus Otometrics (Freefit).
Methodology
The VRIC prototypes are designed in such a way that the PT of the REM system can be protruded through the sample housing. This way, we avoid mechanical disturbance due to PT. We can select the dome diameter for the prototype RICs (9-10-11mm).
Note: Prototypes are printed with a vent channel diameter of d = 0.95mm, so the probe tubes have a snug fit (Figure 10). Different OEM probe tubes used at Hörzentrum did not fit the printed vent channel in the prototype because of the tight tolerances.
All measurements at Oldenburg Germany, are done by HCPs. The HCPs could get familiar with the measurement setup before the actual test data was gathered. After each measurement the tube is checked to inspect for accidental clogging. Subjects are positioned at 0-degree azimuth within 1 meter in front of the loudspeaker. A pink noise stimulus of 70 dB SPL with a 10-second interval and 1/3 octave band filtering is used.
While measuring the seal quality, we compare the sound pressure level difference in SPL in (dB) in the ear canal close to the tympanic membrane to the reference microphone. This is done for the open ear canal situation versus one occluded situation. Every REUG is done once for the left and the right ear. Every REOG is done three times for every dome size. This brings us to 20 measurements for both ears for every subject. These 20 measurements are used to calculate 18 insertion loss curves for every subject. In total, we collected 156 measurements. Subject VP09 could not fit every dome size. The measurement data is then processed with MATLAB.
Results
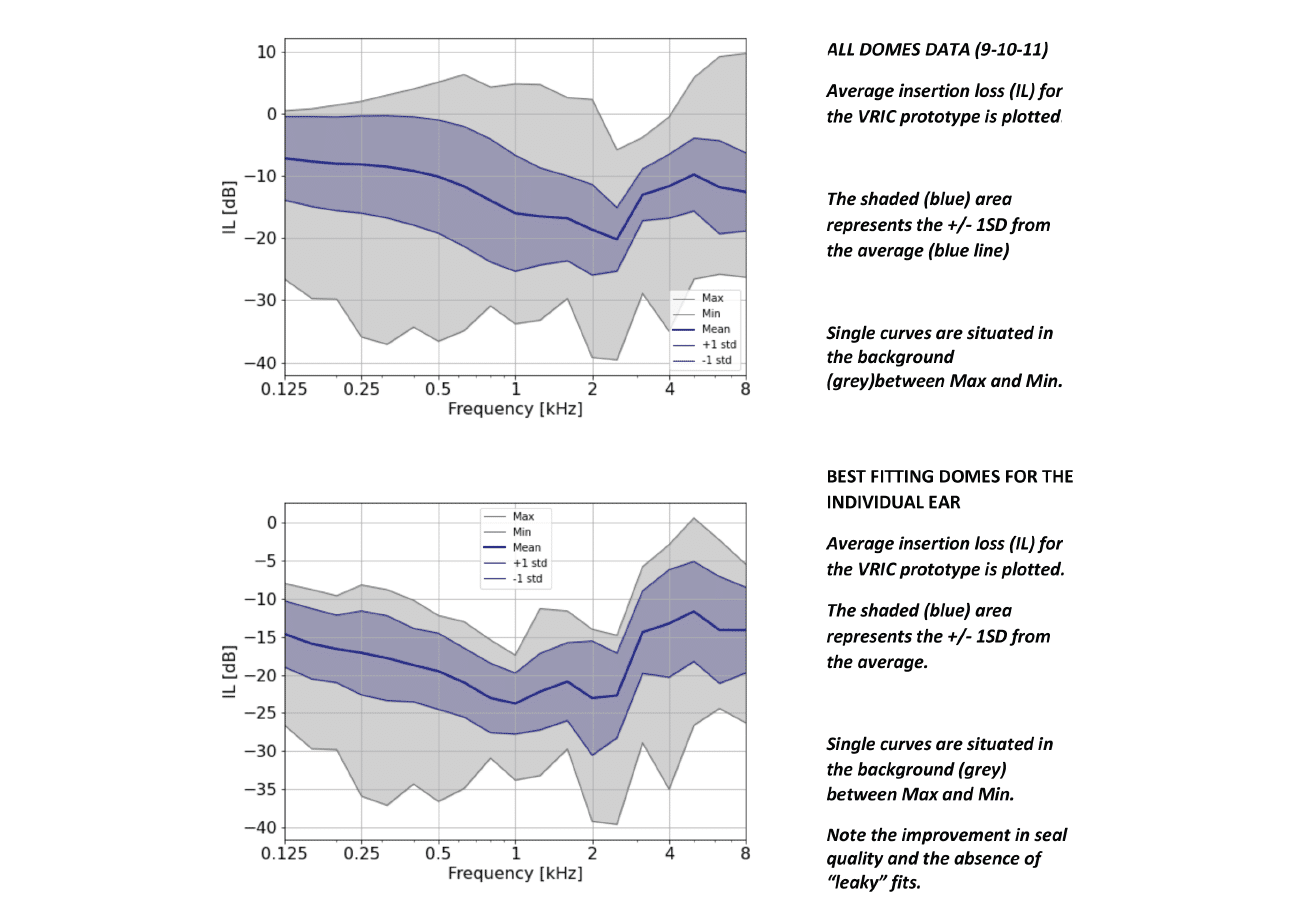
The Hörzentrum insertion loss measurements are given in the graph in (Figure 11). We plot the insertion loss results for the all-dome sizes used for all ears in the top graph. After optimization, we get the lower graph. The dome optimization criterium is based on the maximum (IL) over three measurements over a frequency range 100 – 1000 Hz for a particular dome size. The average insertion loss (IL) for the VRIC is plotted where the shaded (blue) area represents the +/- 1SD from the average.
Experiment 3 conclusions
Hörzentrum Oldenburg results show very different insertion loss outcomes than Cubick et al.2 The best-fitting domes per individual ear (Figure 11, bottom) shows how efficiently we can occlude the ear canal with the sleeve dome prototypes. To a lesser extent, this is also true for the average of all size domes together (156 measurements). We believe that these results also reflect the use of similar double domes available on the market.
The circular versus elliptical shape argument is discussed by Blau et al.6 The authors theorize on the reason why they measure a lower-than-expected low-frequency output. They explain this by the difference between the shapes of the typical dome and double dome coupler (circular) and the shape of most ear canals (elliptical). However, experiment 1 also shows that there is an alternative explanation and experiment 2 shows flat response curves are also possible in real ears. If we have a probe tube in the ear (coupler), we create a low-pass filter. This small vent with a very low acoustic mass and short length makes it easy for low-frequency sound to penetrate or escape the ear (coupler). On the other hand, this PT presence impact decreases as the parallel vent length increases. This is the case for most custom shells.
Besides the quality of the mechanical fitting process, the PT presence provides the simplest explanation with the least of assumptions to explain the observed mismatch between real-world data and our own lab results. Hence, our reference to the observer effect.
The evidence is provided by:
- Experiment 1: Ear simulator
- Experiment 2: Receiver + microphone in the ear canal
- Experiment 3: Sonion & Hörzentrum test (comparison with real-world data)
Implications for fitting hearing aids with closed or double domes
- The PT presence significantly affects the insertion loss measure by acting as a low pass filter according to the curves in experiment 1 and the data in experiment 3. This vent effect is causing a misleading result when we want to measure the REOIG or IL.
- The PT presence is affecting the hearing aid’s low-frequency gain response. Data from experiment 2 suggests this can be as high as 20 dB at 250 Hz. This means that correct loudness cannot be guaranteed once the tube is removed.
■ Gatehouse et al7 have suggested a range as guidance on how closely hearing aid gain and rationale targets should match. They recommend a tolerance of +/- 5 dB at 250, 500, 1000, and 2000 Hz and a tolerance of +/- 8 dB at 3000 and 4000 Hz.
■ A tolerance of +/-5 dB is recommended at frequencies between 250 Hz and 6000 Hz by the British Society of Audiology.8 - When calibrating the hearing aid feedback suppression system, the outcome may be affected by the PT. The outcome without the PT could help the dome selection process as well.
Discussion
We, the authors, wonder how this study affects earlier published work with a related scope. For example, the article, “Effects of probe tubes inserted through earmold vents on real-ear probe microphone measurements,” is investigated by Painton et al.9 The authors conclude that the presence of the PT between the ear canal and the earmold seemed to show a slit leak. This implies the PT vent effect is not exclusively associated with closed or double dome only.
New technologies such as a valve (active vent) receiver have a micro-mechanism that can switch from an open to a closed state. It is aiming to take advantage of better speech in noise hearing aid performance while in the open mode; it enables to take advantage of residual hearing and high own voice acceptance.
Additionally, future implementation of technologies as active noise canceling or active occlusion reduction strongly depends on a good understanding of the insertion loss measures and the important role acoustic couplings play.
These are example applications of a microphone in the ear canal as a logical next step for hearing aid innovation. This will enable new use cases and make hearing aid fitting much easier.
Acknowledgment:
The authors would like to thank Michael Schulte and his team from Hörzentrum for their help with experiment 3.HR

Friso van Noort is a research audiologist and has a background as a hearing care professional. Oleg Antoniuk, PhD, is a product development engineer and specialist in modeling and simulations. Yakup Kilic, PhD, is a product development engineer and a data scientist. Sonion Research & Technology, Netherlands.Correspondence to: Friso van Noort at [email protected].
References:
- Baclawski K. The observer effect. Proceedings of IEEE Conference on Cognitive and Computational Aspects of Situation Management (cogSIMA). 2018; 83-89.
- Cubick J. et al. The acoustics of instant ear tips and their implications for hearing-aid fitting. Ear and Hearing. 2022;43(6):1771-1782.
- Berger E. Preferred methods for measuring hearing protector attenuation. 2005.
- Burkhard MD. Sachs RM. Sound pressure in insert earphone couplers and real ears. J. of Speech Hear.. Res.1977;20(4):799–807.
- Carter N, Kryter K. Masking of pure tones and speech. Journal of Auditory Research. 1962;66-98.
- Blau M et al. Acoustics of open fittings. The Journal of the Acoustical Society of America. 2008;123(5):3011-3011.
- Gatehouse S et al. Good practice guidance for adult hearing aid fittings and services. British Association of Audiological Scientists Newsletter. 2001.
- British Society of Audiology. Guidance on the verification of hearing devices using probe microphone measurements. Practice Guidance. 2018. Available at: https://www.thebsa.org.uk/wp-content/uploads/2018/05/REMS-2018.pdf.
- Painton SW, Sweeney T. Effects of probe tubes inserted through earmold vents on real-ear probe microphone measurements. The Hearing Review. 2019;26(9):24-28.