Tech Topic: Sound Quality | March 2014 Hearing Review
By Charlotte T. Jespersen, MA
 Sound is inarguably a powerful aspect of human life. Not only is verbal language communication dependent on producing and receiving sound, we rely on sound to convey the nuances and subtleties of emotion, to orient ourselves and navigate in our environment, and for enjoyment and entertainment. The quality of the sound we hear is an essential part of the human experience.
It follows that sound quality must also be an essential consideration in hearing instruments. The sound delivered by the hearing instrument shapes how the user experiences their world. In light of this, research showing that aspects of sound quality such as clarity and naturalness of sound are highly correlated with satisfaction with hearing instruments is not surprising.1 It is also not surprising that hearing-impaired listeners may reject a hearing instrument on the basis of its perceived sound quality. Thus, it is of great significance to the successful use of hearing instruments that a listener’s first experience be positive in terms of sound quality.
Despite its importance, sound quality can be difficult to define for the hearing instrument wearer. This is because hearing instrument processing strategies significantly change the incoming sounds as they aim to compensate for lost auditory function. For example, the prescriptive fitting formulae we typically use to adjust the frequency response of hearing instruments will always result in a weighting of gain in certain frequency regions, thereby negating the idea of an acoustic signal that is an exact reproduction of the original.
For hearing instrument wearers, it may be more appropriate to think of sound quality as describing how amplified sounds fit within their range of hearing, whether sounds are distorted, and the degree to which undesired sounds such as background noises, acoustic feedback, or signal processing artifacts are heard and found annoying. This is consistent with the way in which various dimensions of hearing instrument satisfaction in the MarkeTrak surveys are grouped as relating to sound quality, including not only “better sound quality,” but also “less whistling and buzzing,” “more soft sounds audible,” and “loud sounds less painful.”1
Quantifying Sound Quality
To quantify sound quality for hearing instrument users is equally as challenging as defining it. Unlike outcome measures that help quantify benefit and satisfaction with hearing instruments, methods for impartially assessing sound quality are lacking.
For one thing, sound quality is perceptual. While some objective measurements of physical properties, such as distortion, may correlate to some extent with sound quality judgments, they do not tell the whole story. To complicate matters further, varying dimensions of sound quality, such as “brightness” or “naturalness,” may be weighted differently in importance among individuals. Finally, auditory memory limitations make it difficult for hearing instrument wearers to fairly assess the fine details between different hearing instruments.
Hearing aid sound quality has been assessed in many different ways without a fully implemented and adopted standardized procedure. It has generally been measured using either paired comparison or absolute ratings.2 Each of these approaches has its pros and cons.
When applying paired comparison, the listener is presented with two different stimuli with a short interval in between, and then has to select one of them based on a preference specified beforehand such as comfort, naturalness, or pleasantness. Paired comparison is a fast and easy-to-use method that can be used in a clinical setting. The disadvantage is that this method does not provide any specific information about how good the sound quality is; it only offers information about whether it is better or worse relative to a more-or-less defined reference point.
This problem can be solved by applying an absolute rating approach. Here the listener is presented with a sound sample and has to rate it on a scale in relation to a specified sound characteristic such as comfort, naturalness, etc. The advantage of this approach is that a long series of stimuli can be compared without having to compare them directly. However, it is a more time-consuming procedure that lacks the simplicity of the paired comparison.
Gabrielsson and Sjögren3 established a systematical sound quality measure based on a number of absolute rating scales pertaining to different dimensions of sound quality. They used tape-recorded sound samples—music, speech, and various sounds from daily life—which were played back over headphones to predominately normal-hearing listeners, and for a few hearing-impaired listeners over hearing aids and earmolds. The listeners were asked to judge perceived sound quality according to one of two methods.
One method involved adjective ratings wherein the listeners were asked to rate how well each descriptor on a list of adjectives characterized the sound sample. They wrote a number from 0 to 9 next to the adjective, where 0 meant that the sound sample had nothing of the quality denoted by the adjective, and 9 that the sound sample had a maximum of that quality. The adjectives on the list had been chosen on the basis of results from questionnaires to 30 audiologists and 105 hearing-impaired individuals. The other method involved similarity ratings where the listeners judged perceived similarity between sound samples presented in pairs with a silent interval between the pairs.
The disadvantage of Gabrielsson and Sjögren’s methods is that they are based on predominately normal-hearing listeners.
Acknowledging the challenge in documenting good sound quality, ReSound enlisted DELTA SenseLab, an independent test laboratory specialized in performing listening tests in a variety of domains, to evaluate sound quality in ReSound’s hearing instruments compared to other hearing aid manufacturers’ hearing instrument sound quality. This paper describes the sound quality evaluation method used, and provides documentation of the excellent sound quality provided in ReSound hearing instruments.
Method for Evaluation of Sound Quality
The method used by DELTA for evaluation of hearing instrument sound quality is inspired by the food and fragrance industry, which uses sensory panels consisting of trained assessors evaluating products based on methodologies that are well established within food science. The idea is that methodologies used to assess taste and smell sensory domains can be transferred to other sensory domains like sound and hearing.
A total of 18 assessors from Delta’s hearing-impaired listening panel participated in the study. All assessors had a moderate hearing loss within a ±10 dB deviation from the mild-to-moderately sloping N3 hearing loss4 and were experienced hearing instrument users.
The assessors had all qualified for participation in the sound quality evaluation via performance on various discrimination tests.5 A possible source of bias when using hearing instrument wearers as assessors is that they have a preference for the sound processing of their own hearing instruments. The assessors in this study were previously shown not to be biased toward the sound quality in their own hearing instruments that they have experience with.5 Ten assessors were male and 8 female. The average age was 73 years with an age range between 64 and 80 years.
The assessors evaluated the sound quality of six different hearing instruments programmed for the N3 hearing loss4 and used in the main hearing instrument program with default feature settings. Four of the instruments were premium technology hearing instruments from other hearing aid manufacturers than ReSound. Two of the hearing instruments were ReSound instruments; one premium technology instrument from 2012 and one premium technology instrument from 2013.
The hearing instrument sound quality was evaluated through different soundfield recordings selected to be representative for different hearing instrument user environments. The sound scenario recordings were female talker, male talker, speech babble, pop music, kitchen work, moderate traffic noise, and small spring in the forest.
The seven sound scenario recordings were recorded through each of the six hearing instruments placed on a Brüel & Kjær Head and Torso Simulator (HATS) placed in the center of a calibrated multichannel loudspeaker setup in DELTA’s standardized listening room. The loudspeakers were calibrated individually to have a flat frequency response and equal overall levels measured at listener’s (HATS) position. To ensure that the hearing instruments were fully adapted to the sound scenario, each scenario was repeated twice in the recording phase to let the hearing instrument adapt during the first presentation and then only use the recording from the second repetition for the product evaluations. The recordings were compensated for the HATS ear canal (ERP-DRP) and headphone frequency response.
The hearing instrument sound quality evaluations were based on the HATS recordings reproduced at calibrated level over Sennheiser HD650 headphones and with the assessors seated in a single-walled IAC audiometric booth with background noise levels below NR15.
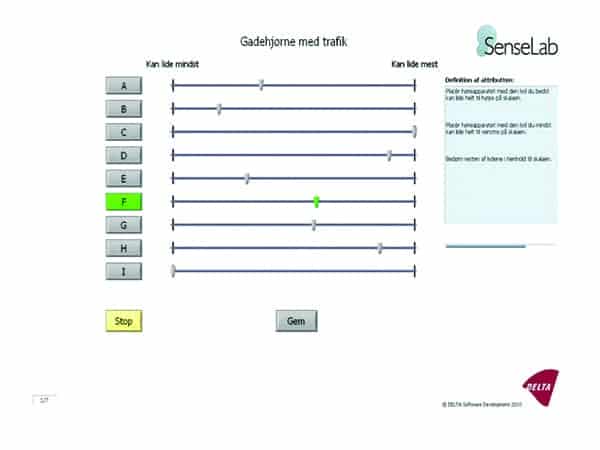
Figure 1. Software interface of the preference test, with ratings from “Like least” to “Like most.”
In the preference test (Figure 1), the assessors were required to evaluate all six hearing instruments on a “Like least—Like most” method where the task for the assessor was to identify the instrument he/she finds least preferred and most preferred, and mark them at the most left and most right on the scale. The remaining instruments are rated according to the scale. Each assessor was instructed prior to the evaluation both in writing and verbally in order to ensure a correct understanding of the task. This method has similarities to Gabrielsson and Sjögren’s similarity ratings method,3 but with the difference that hearing-impaired assessors were used in the current evaluation.
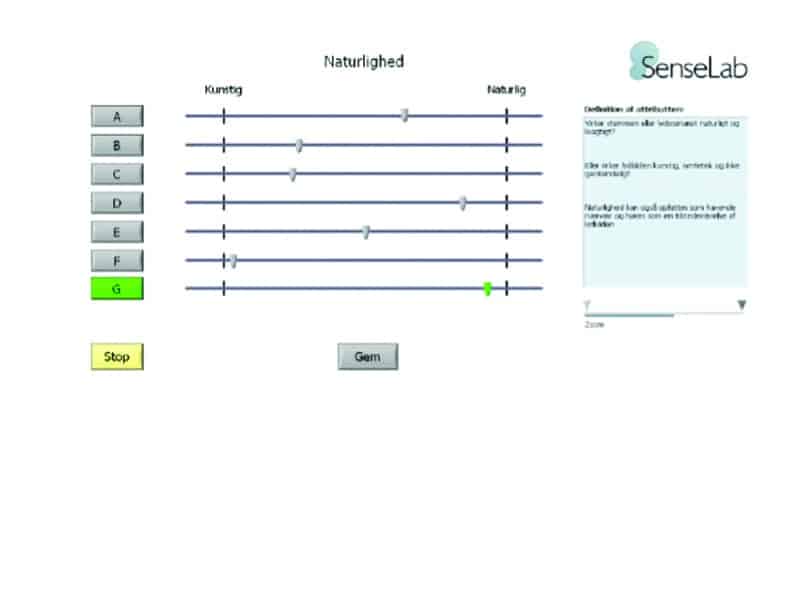
Figure 2. Software interface of the attribute test.
In the attribute test (Figure 2), the assessors were asked to evaluate the six hearing instruments on seven attributes for the seven sound scenarios used in the preference evaluation. The seven dominating hearing aid audio characteristics (attributes) had been derived in a previous evaluation consisting of three group sessions where the panel of hearing-impaired assessors listened to different hearing aids and discussed the perceived differences. The work led to a set of attributes, scales, and definitions.5 The seven attributes were: bass, treble, naturalness, reverberation, loudness, dynamics, artifacts/distortion.
The evaluation was done by use of a software interface resembling the one used for the preference test, but with the attribute listed at the top of the screen and a scale with a top rating and a bottom rating at each end of the scale. The task for the assessor was to identify the instruments that exhibit the attribute the “least” and “most” and mark them at the most left and most right on the scale. The remaining instruments were placed within the endpoints of the scale according to how well they were found to exhibit the attribute. Each assessor was instructed prior to the evaluation both in writing and verbally in order to ensure a correct understanding of the task. All hearing instruments were evaluated for all attribute samples combinations. The test conditions were randomized in a double-blind way. A total of 12 assessors completed the attribute test.
This methodology differs from other sound quality assessments in three important ways. First, the 18 or 12 moderately hearing-impaired assessors were able to make unlimited direct comparisons of stimuli that were recorded through each of the test hearing instruments and presented to them under headphones. Not only did this mitigate auditory memory limitations, it also prevented the assessors from knowing anything about the specific hearing instruments or making any judgments based on other characteristics, such as brand, appearance, or fit of the instruments. Second, the assessors used sliders on a visual continuous scale to rank the hearing instruments in terms of preference, from “like most” to “like least” and degree of attribute. This forced them to use the entire scale, which can provide better discrimination among stimuli than if multiple samples can be rated the same. Also this evaluation was made by hearing-impaired assessors (as opposed to normal-hearing assessors) who are the specialists in hearing aid sound quality.
Results
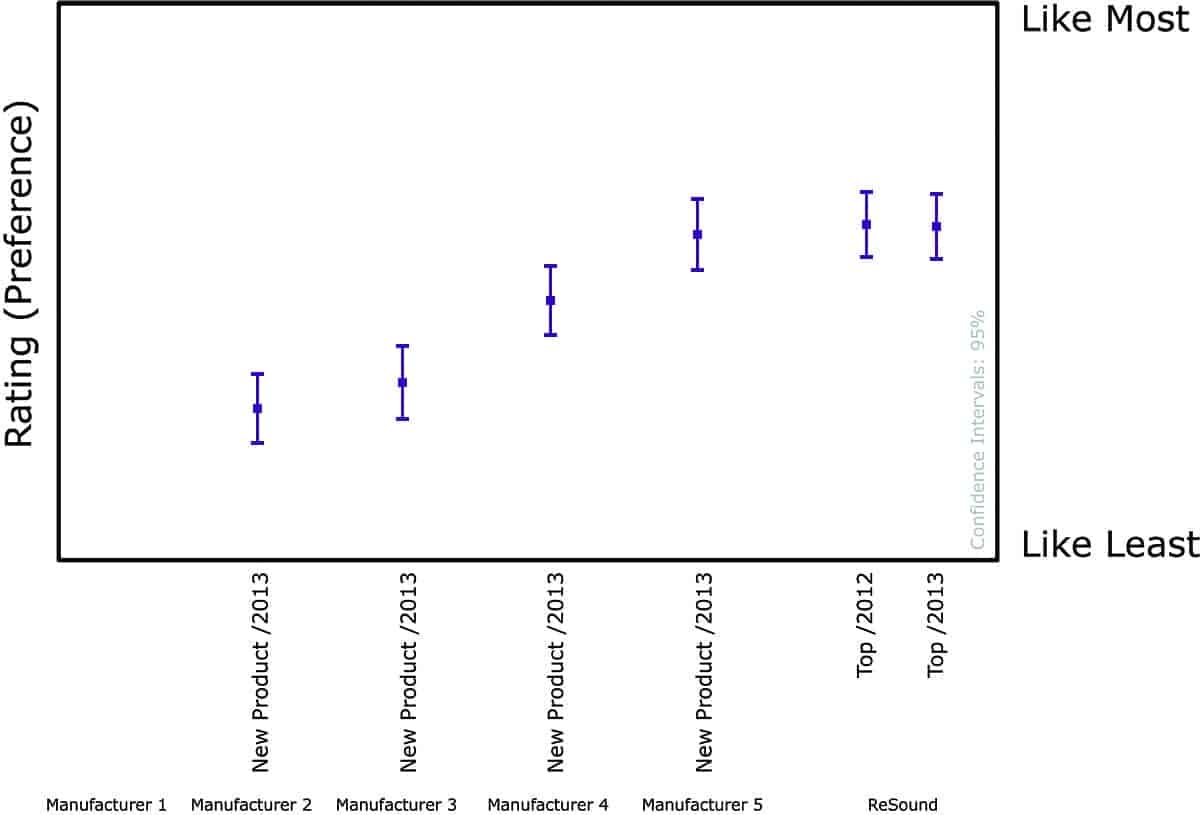
Figure 3. Overall average preference results (mean and 95% confidence intervals) shown per hearing instrument.
The overall preferences, which represent the averaged ratings across all 18 assessors and sound scenarios are shown in Figure 3. The results show that there are significant differences between the evaluated hearing instruments. ReSound products were top-rated for sound quality.
Figure 4 shows the preference results (in purple) together with results from an earlier study (in black) using the same methodology. ReSound products were consistently top-rated for sound quality over two generations of hearing instruments.
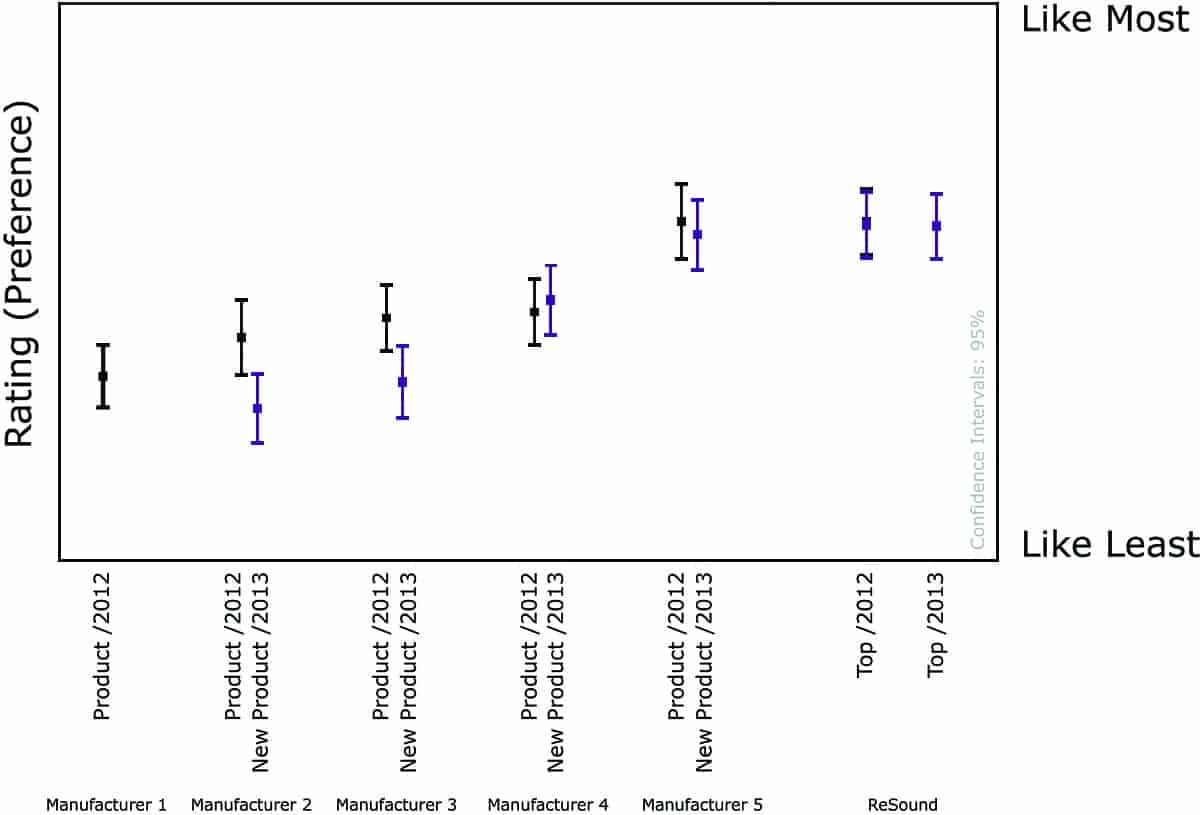
Figure 4. Overall preference results (mean and 95% confidence intervals) shown per instrument.
The results from the attribute evaluation were analyzed to identify attributes that account for the perceived differences among the six hearing instruments. The results are illustrated in selected profile plots showing the assessors’ average rating for each attribute on the six different hearing instruments averaged for all seven sound scenarios.
A profile plot was created for each of the hearing instruments in the test (Figure 5). The center point of the plot represents “least” and the outermost circle represents “most” for each attribute. There is a circle for each of the seven attributes (bass, treble, naturalness, reverberation, loudness, dynamics, artifacts/distortion) in the profile plot. The location of each circle represents the degree to which this attribute influences the sound quality. In this way, it is possible to identify patterns in the attribute assessments as they relate to overall sound quality preferences. The profile plots for the hearing instruments that were most preferred showed a nearly identical
pattern (Figure 5). A high degree of “Naturalness” and “Dynamics” and low occurrence of “Artifacts/Distortion” appear to be weighted highly in determining overall preference.
The profile plots for the hearing instruments that were less preferred also showed a very similar pattern (Figure 6). These devices had higher “Loudness,” “Treble,” and “Reverberation,” as well as “Artifacts/Distortion,” but were lower in terms of “Naturalness.” This reinforces the idea that “Naturalness” and absence of perceived artifacts and distortion are crucial for overall preference.
Focus on a Natural Hearing Experience
ReSound hearing instruments were top-rated in terms of sound quality across product generations. This result affirms the Surround Sound by ReSound sound processing strategy that provides wearers with exceptional speech understanding, enhanced awareness of their sound environments, and rich, vibrant, fully detailed sound quality.
“Naturalness” was one attribute shown to be related to overall preference. The importance of naturalness in sound quality is consistent with the ReSound philosophy of sound processing that respects natural hearing processes. Because hearing is a job done by the brain, development efforts are focused on emulating the ear to deliver the best possible signals to the brain. For most people who are hearing instrument candidates, the challenge is to transmit sound via a damaged sensory end-organ, the cochlea, to an intact auditory processing system in the brain. It follows that hearing instruments should attempt to provide “healthy ear” functions to the impaired ear. Sound is delivered to the sophisticated, intricately functioning auditory processing systems of hearing instrument wearers. The device fit to each ear delivers a separate and different signal to the brain, which the auditory cortex processes to form one fused auditory image. This image is what is heard.

Figure 5. Nearly identical profile plots of the three hearing instruments that were most preferred averaged for all seven sound scenarios. The circles indicate 95% confidence intervals. The profile plots are for Manufacturer 5 and for ReSound 2012 and 2013.
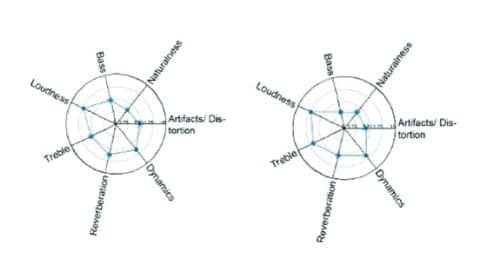
Figure 6. Profile plots of the two hearing instruments that were least preferred averaged for all seven sound scenarios. Circles indicate 95% confidence intervals. The profile plots are for Manufacturers 2 and 3.
A low occurrence of “artifacts/distortion” was also related to overall preference, and is also consistent with design goals for sound processing in ReSound hearing instruments. Modern hearing instruments apply other processing designed to enhance the listening experience by reducing side effects of wearing them, such as feedback and amplification of undesired sounds. While the Surround Sound by ReSound signal processing strategy includes technologies that emulate the healthy ear, such as the Warp compression system, and support binaural hearing, such as Binaural Directionality, it also uses technologies that add to the enjoyment of wearing hearing instruments. These include technologies such as NoiseTracker II noise reduction and DFS Ultra II for elimination of feedback.
It is important that these types of features function in a transparent manner in order to provide the best sound quality. In other words, they should accomplish specific goals without the listener noticing them. While it may seem counterintuitive that sound processing features should not call attention to themselves, this strategy provides the most natural listening experience.
Summary
It is of great significance to the successful use of hearing instruments that a listener’s first experience be positive in terms of sound quality. Despite its importance, sound quality can be difficult to define and quantify for the hearing instrument wearer.
Unlike outcome measures that help quantify benefit and satisfaction with hearing instruments, methods for impartially assessing sound quality are lacking. Acknowledging the challenge in documenting good sound quality, ReSound enlisted DELTA SenseLab, an independent test laboratory specialized in performing listening tests in a variety of domains, to evaluate sound quality in ReSound’s hearing instruments compared to other hearing aid manufacturers’ hearing instrument sound quality.
This paper describes the sound quality evaluation method used and provides documentation of the excellent sound quality provided in ReSound hearing instruments across product generations. This result affirms the Surround Sound by ReSound sound processing strategy that provides wearers with exceptional speech understanding, enhanced awareness of their sound environments, and rich, vibrant, fully detailed sound quality.
References
1. Kochkin S. MarkeTrak VII: Customer satisfaction with hearing instruments in the digital age. Hearing Journal. 2005;58(9):30-43.
2. Dillon H. Hearing Aids. 2nd ed. Sydney: Boomerang Press; 2012.
3. Gabrielsson A, Sjogren H. Perceived sound quality of sound-reproducing systems. Acoust Soc Am. 1979; 65(4):1019-1033.
4. Bisgaard N, Vlaming MS, Dahlquist M. Standard audiograms for the IEC 60118-15 measurement procedure. Trends Amplif. 2010;14:113-120.
5. Legarth SV, Simonsen CS, Dyrlund O, Bramsloew L, Jespersen C. Establishing and qualifying a hearing impaired expert listening panel. Poster presentation at: IHCON; 2012; Lake Tahoe, Calif.
Original citation for this article: Jespersen, C. Independent study identifies a method for evaluating hearing instrument sound quality. Hearing Review. 2014,21(3):36-40.


