Tech Topic | December 2014 Hearing Review

Tammara Stender, AuD, is Manager at GN ReSound Global Audiology in Glenview, Ill.
Frequency lowering strategies are generally used in the hearing industry as an alternative for patients who do not benefit from traditional amplification in the high frequencies. However, all of these strategies introduce distortion and potentially do more harm than good. This article outlines considerations when fitting a patient with frequency lowering, as well as current research suggesting when this type of feature may not be as beneficial. In addition, a new frequency compression feature, ReSound Sound Shaper, is discussed. Sound Shaper is a proportional frequency compression approach that can provide high frequency audibility for individuals who do not receive it through traditional amplification, and was developed with the goal of preserving sound quality and minimizing distortion to the extent that is currently possible.

Jennifer Groth, AuD, is Director of Audiology Communications at GN ReSound Global Audiology in Glenview, Ill.
Frequency lowering is a hot topic in academic research today. A review of the literature reveals many studies with conflicting results and recommendations. There appears to be no general consensus on benefit for groups of people fitted with this feature versus those fitted without it. However, research suggests that it can be highly beneficial for certain individuals, when fitted appropriately.
The clinical challenge for this feature resides in identifying which individuals will receive benefit from frequency lowering, and which would be fitted more successfully with traditional amplification, as no definitive candidacy criteria for frequency lowering have been established to date. It is for these reasons that frequency lowering strategies are typically regarded as alternatives to consider for patients who do not receive the expected benefits from traditional amplification in the high frequencies.
The Case for Frequency Lowering: Improving High-Frequency Audibility
Hearing loss that slopes to greater degrees of severity for the high frequencies is commonly encountered in hearing clinics. This hearing loss configuration, however, presents its own challenges, both for the patient and for the hearing care professional.
For the patient, many consonant sounds important for accurate speech discrimination are located in the high frequency region. For example, the /s/, /th/, and /f/ phonemes may be rendered inaudible with only a mild degree of high-frequency hearing loss.
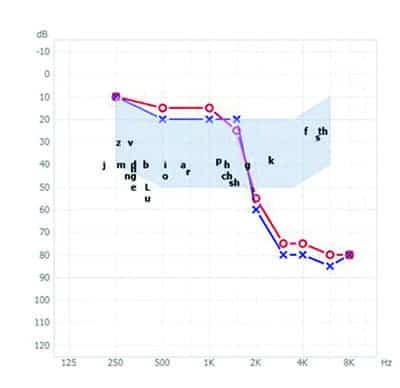
Figure 1. Steeply sloping high-frequency hearing loss, with the speech banana and English phonemes superimposed to indicate areas of audibility and inaudibility for the patient.
Figure 1 shows a bilateral steeply sloping high-frequency hearing loss. A speech banana is superimposed on the audiogram, which indicates the common distribution of speech sounds in the frequency-intensity realm over time. Individual phonemes indicate on the audiogram their specific frequency and intensity ranges in everyday speech. Sounds below the hearing thresholds on the figure are audible to the patient, and sounds above the thresholds are inaudible. Without amplification, the /s/, /th/, /f/, and /k/ phonemes are inaudible for this patient.
The inaudibility of certain phonemes produced at typical speech levels may present significant problems for the patient. For example, the /s/ phoneme is necessary in the English language to distinguish plurality (eg, “bag” versus “bags”). The sentence “Please bring the bags” will have a different meaning to the patient with the hearing loss in Figure 1 if she only hears “Please bring the bag.”
In the real-world scenario of continuous discourse, people can often decipher messages even when not all the acoustic information is present. This is due to the linguistic and acoustic redundancy of speech communication; speech contains more information than is needed to decode it. Vowel formant transitions, which indicate place of articulation for the consonants that precede and follow them, provide acoustic cues to help identify those consonants correctly. Phonological knowledge of the language helps narrow the possibilities further. In addition, grammatical, semantic, and pragmatic knowledge influences the listener’s ability to use the context of a fragmented message to understand the message.1
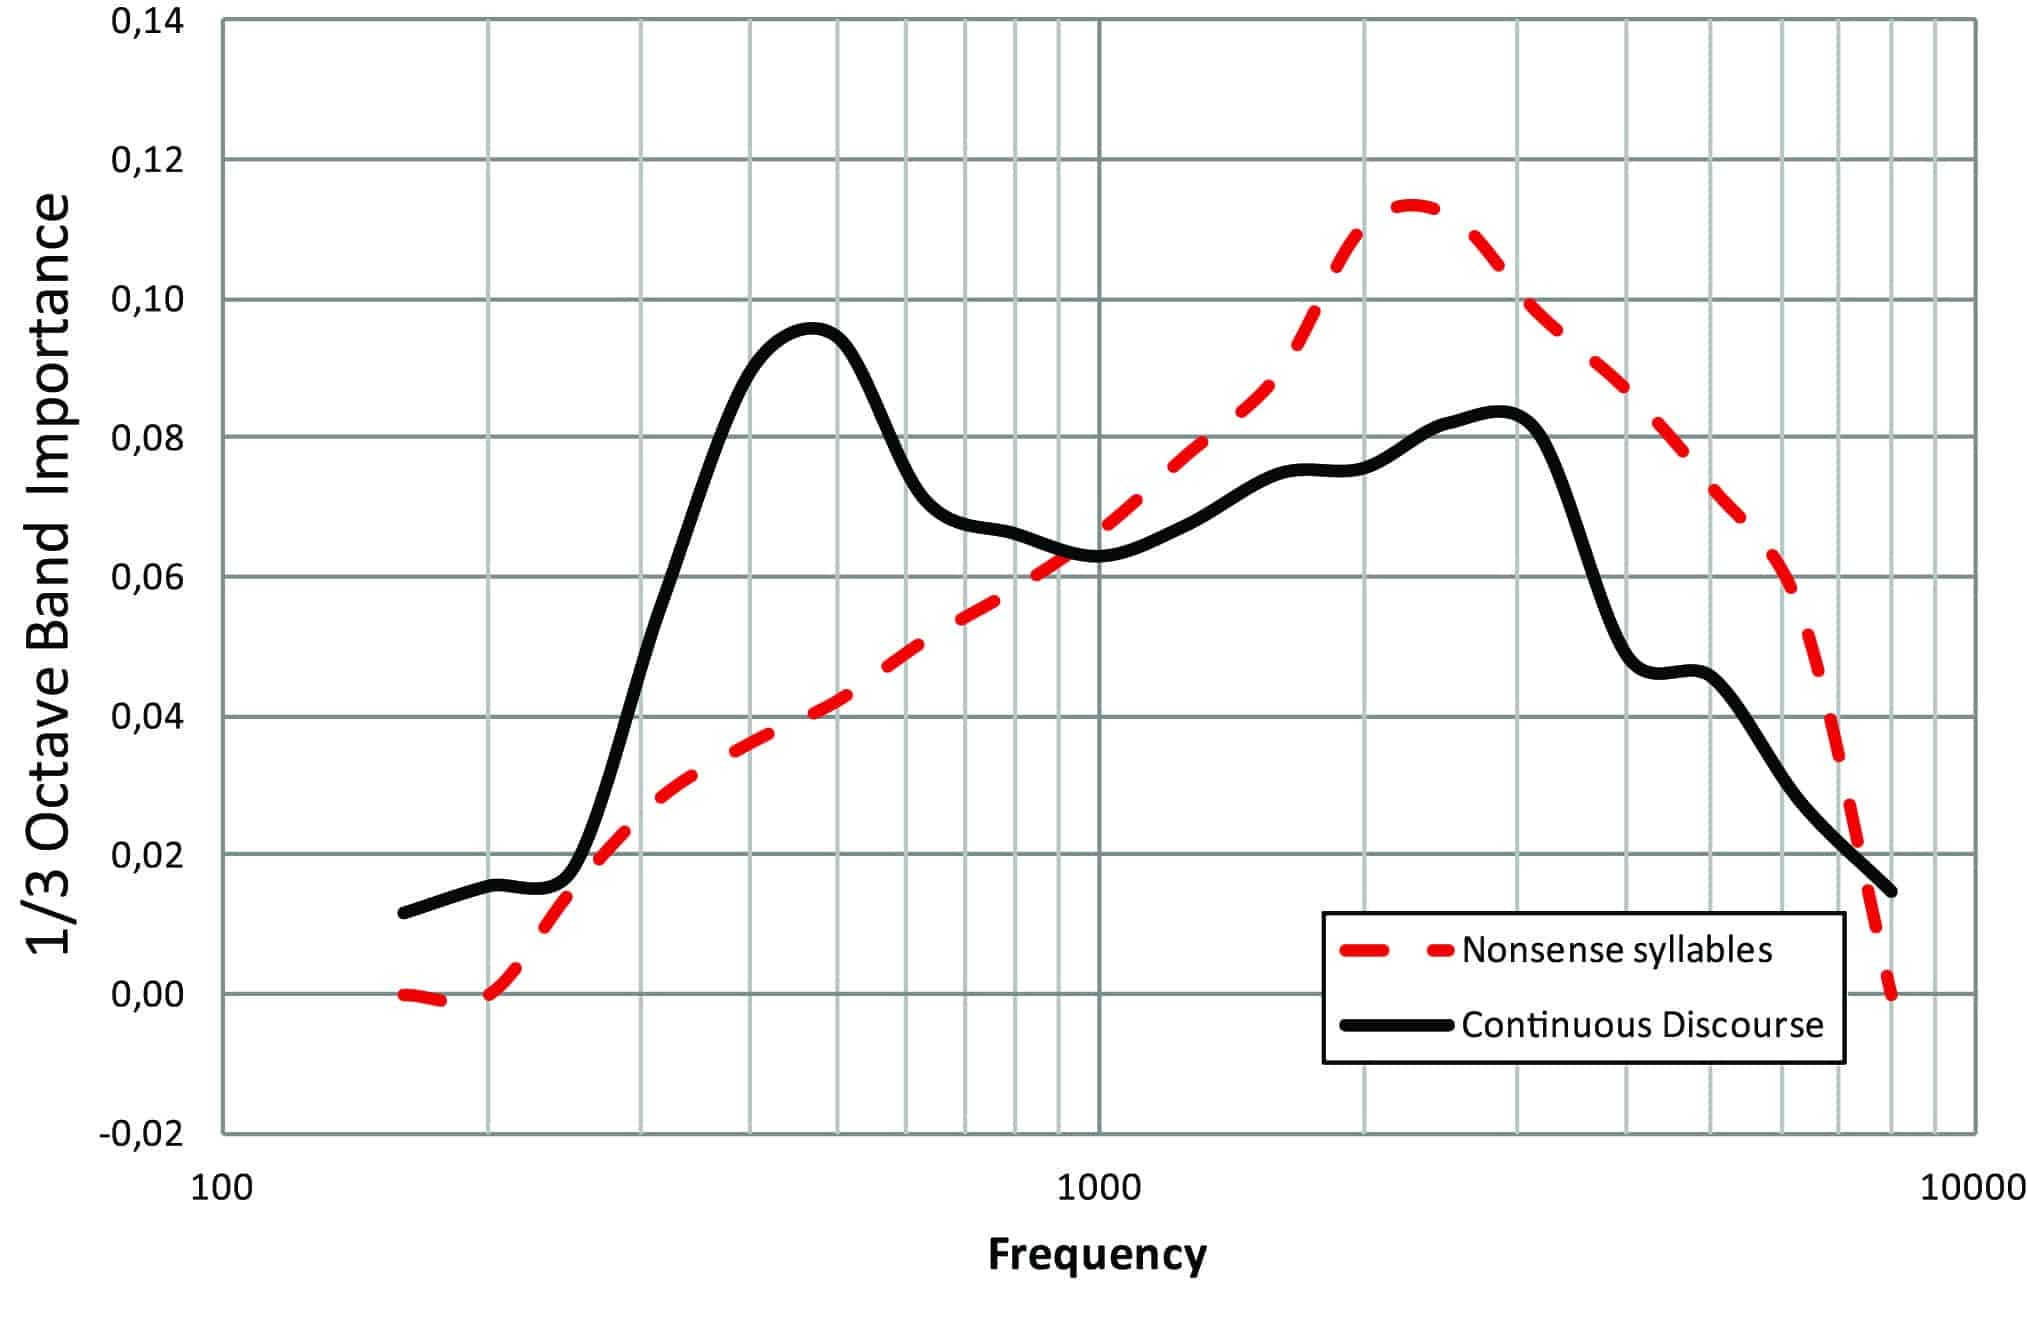
Figure 2. One-third octave band importance functions for nonsense syllables and continuous discourse.
The relative importance of different types of redundancy in speech and communication shifts, depending on both acoustic and intrinsic factors. This is illustrated by the band importance functions for different types of speech material in calculating the Speech Intelligibility Index2 (Figure 2). High-frequency acoustic information is more important for correct identification of nonsense syllables (red curve) than continuous discourse (black curve), in which knowledge of the language assists in correct identification of speech.
The need for and desirability of adequate high-frequency audibility extends beyond the realm of speech to environmental sounds. As shown in Figure 1, a hearing loss of this configuration and degree affects the audibility for environmental sounds, such as birdsong. For this patient, these environmental sounds will be inaudible without some form of high-frequency amplification (Figure 3).

Figure 3. Steeply sloping high-frequency hearing loss, with typical environmental sounds superimposed to indicate areas of audibility and inaudibility for the patient.
Traditional amplification using wide dynamic range compression (WDRC) will provide greater audibility for low-level sounds in the necessary frequency regions, in an attempt to raise the level of speech and other environmental sounds to an audible level per the individual’s hearing loss. The success of this approach often depends on the severity of the hearing loss in the high frequencies; for greater degrees of high-frequency hearing loss, traditional amplification may have limited success in providing audibility for these high-frequency sounds. This may be due to an inability to control feedback from high gain requirements in this frequency region, and/or limitations of the receiver. The physical properties of larger receivers, which are used in high-power hearing instruments, result in a high-frequency roll-off that is at a lower frequency than what is observed for lower-power hearing instruments.
Aside from the technical issues in providing these significant high-frequency gains, a physiological issue has also been suggested in the literature. For some individuals, it has been suggested that providing traditional high-frequency amplification for severe high-frequency hearing losses may not be beneficial if the corresponding high-frequency areas on the cochlear basilar membrane represent a “dead region.” A dead region is generally characterized by non-functioning inner hair cells. It has been suggested that applying amplification to these “dead regions” may result in poorer speech understanding than not applying it.3
If adequate gain cannot be provided by the compressor, or if the patient does not receive benefit in speech understanding from this degree of high-frequency amplification, an effective alternative to provide audibility may be a frequency lowering approach. Frequency lowering strategies work through the displacement of signals from higher frequencies to lower frequencies, where beneficial amplification may be achieved.
In some frequency lowering approaches, this also results in reducing the bandwidth of the device to a lower frequency. Although all frequency lowering approaches introduce some degree of distortion due to the artificial movement of some frequencies to a different region, the benefit in audibility may result in a favorable compromise for some individuals.
The Case Against Frequency Lowering: Individual Patient and Cost-Benefit Considerations
Current research has revealed some interesting patient characteristics that would contraindicate the use of frequency lowering for certain individuals. For example, older patients who have a known working memory or cognitive deficit may be more susceptible to distortion created by certain hearing aid features.4 As frequency lowering is known to create distortion to some extent through artificial alteration of the high frequencies, these patients may receive greater benefit from traditional amplification.
At the other end of the age spectrum, children fitted with nonlinear frequency compression (NLFC) may perform better in some areas but poorer in others, as compared to their traditionally fitted peers.5 Poorer consonant articulation scores were revealed in this study for children fitted with frequency compression. Overall, the study revealed insufficient evidence to suggest global language ability differences between the children fitted with NLFC and those fitted traditionally.
Research is also currently inconclusive with regard to enabling frequency lowering and similar bandwidth-limiting features for all patients with suspected “dead regions.” Regardless of the severity of hearing loss, a number of studies indicate that patients can benefit from a certain degree of high-frequency gain, even as it extends into the suspected “dead region.”6-9
The configuration or slope of the hearing loss may also be an important factor to consider. Patients presenting with flatter hearing loss configurations—regardless of the severity—tend to prefer a broader bandwidth than those with steeply sloping hearing losses.10-11
Finally, certain cost-benefit decisions are involved when enabling frequency lowering for a patient. A recent study indicated that, while NLFC was beneficial for high-frequency consonant recognition, it was not as beneficial for speech recognition in noise.12 Further, the methodology and care taken when fitting this feature was highlighted as a factor in the benefit it can provide. This study suggested that some manufacturer default settings of NLFC for a patient may still fail to provide audibility for the compressed signal, especially in the case of more severe hearing losses.
A Refined Approach to Frequency Compression
In the absence of the patient considerations outlined above, and when judicious use of the feature is employed, frequency lowering may be an appropriate tool to use for individual patients who do not receive adequate benefits from traditional amplification. Of the frequency lowering approaches used today by the hearing industry, the most commonly fitted strategy is frequency compression. Just as WDRC and other types of amplitude compression “move” low-intensity sounds to higher intensity levels for the individual, frequency compression “moves” high-frequency sounds to a lower, more aidable region.
The ultimate goal of both amplitude and frequency compression is the same: audibility. To this end, ReSound has introduced Sound Shaper, available in Aventa 3.6 fitting software, as a tool to be used by the fitter to meet the needs of the individual patient.
In addition to the shared goal of audibility, ReSound Sound Shaper employs much of the same terminology as amplitude compression. Frequency compression changes the input to a more amenable output above a cut-off threshold, or kneepoint. The degree of frequency compression applied can be expressed as the frequency compression ratio. Sound Shaper compresses the frequencies above the kneepoint, effectively moving them closer together. This provides the input frequencies in a smaller region that is more usable to the hearing instrument user.
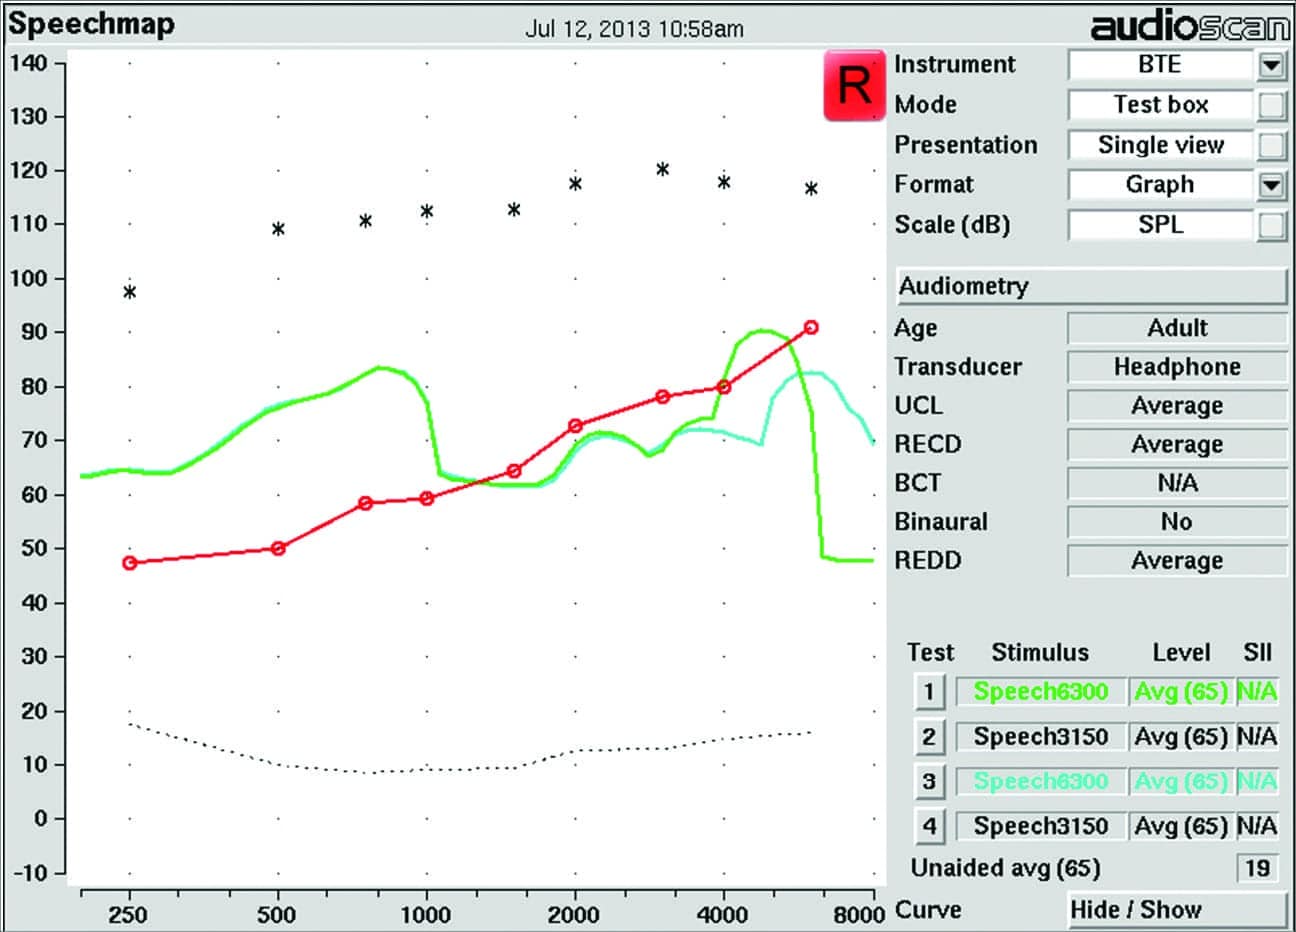
Figure 4. Audioscan Verifit Speechmap display showing verification measurements with Sound Shaper “Off” (blue) and Sound Shaper set to “Moderate” (green). Measurements below the red line denoting the patient’s thresholds per frequency will be inaudible, as is the case with the 3150 Hz signal for the Sound Shaper “Off” condition, while measurements above the patient’s thresholds indicate audibility for that signal, as shown when Sound Shaper is set to “Moderate.”
Verification of the audibility of these compressed signals is important, since a frequency-lowered signal that is still inaudible to the patient defeats the purpose of turning the feature on. Figure 4 illustrates one possible method of ensuring audibility for a previously inaudible stimulus.
A Meaningful Selection of Settings
All frequency-lowering techniques introduce a compromise between audibility and sound quality. Some users will benefit greatly from the increased audibility of high-frequency sounds, while others may be bothered by the feature’s inherent distortion and perceptual sound quality.
As previously stated, there are no defined guidelines about which individual patients will be the best candidates for frequency lowering. Further, there is no “cookbook approach” to fitting the technology. For instance, two individuals with similar hearing losses may derive the greatest benefit from different frequency compression kneepoints and ratios, or from no frequency lowering at all. For these reasons, the best approach to applying and fitting frequency compression is often a conservative one.
To this end, Sound Shaper is incorporated in Aventa 3 with a limited number of settings, which were found through internal testing to provide the greatest audibility benefit while also minimizing deleterious effects on the sound quality. In addition, consideration was taken to ensure that different settings provided distinctly different results, to simplify the process of setting Sound Shaper. (An in-depth discussion on the development of these settings can be found in a ReSound white paper13 on the topic.)
As a result of this development, three settings for Sound Shaper were derived: “Mild,” “Moderate,” and “Strong.” However, as current research suggests that frequency lowering is best considered as an alternative tool for fitting individual patients, Sound Shaper is automatically set to “Off” for all hearing losses. It is the professional’s decision whether to enable it, based on the needs of the patient.
Minimizing the Effects of Frequency Compression on Sound Quality
The effects of frequency compression on sound quality are not easily generalized to all users. Normal-hearing individuals may distinguish a difference in sound quality with frequency lowering turned on, as compared to traditional processing, while those with hearing loss may not distinguish a sound quality difference for a range of frequency lowering settings.14 Sound quality for music is generally preferable without frequency lowering, or at least when it is set to more conservative settings, among normal-hearing and hearing-impaired listeners.15
To provide the greatest listening benefits with minimal signal distortion, Sound Shaper was developed as a proportional frequency compression strategy. This means that the relationships between frequency-compressed inputs are constant; in other words, the frequency compression ratio is constant for all input frequencies. This is in contrast to a non-proportional or nonlinear frequency compression strategy, in which the relationship between compressed inputs (ie, the ratio) changes as the frequency increases.
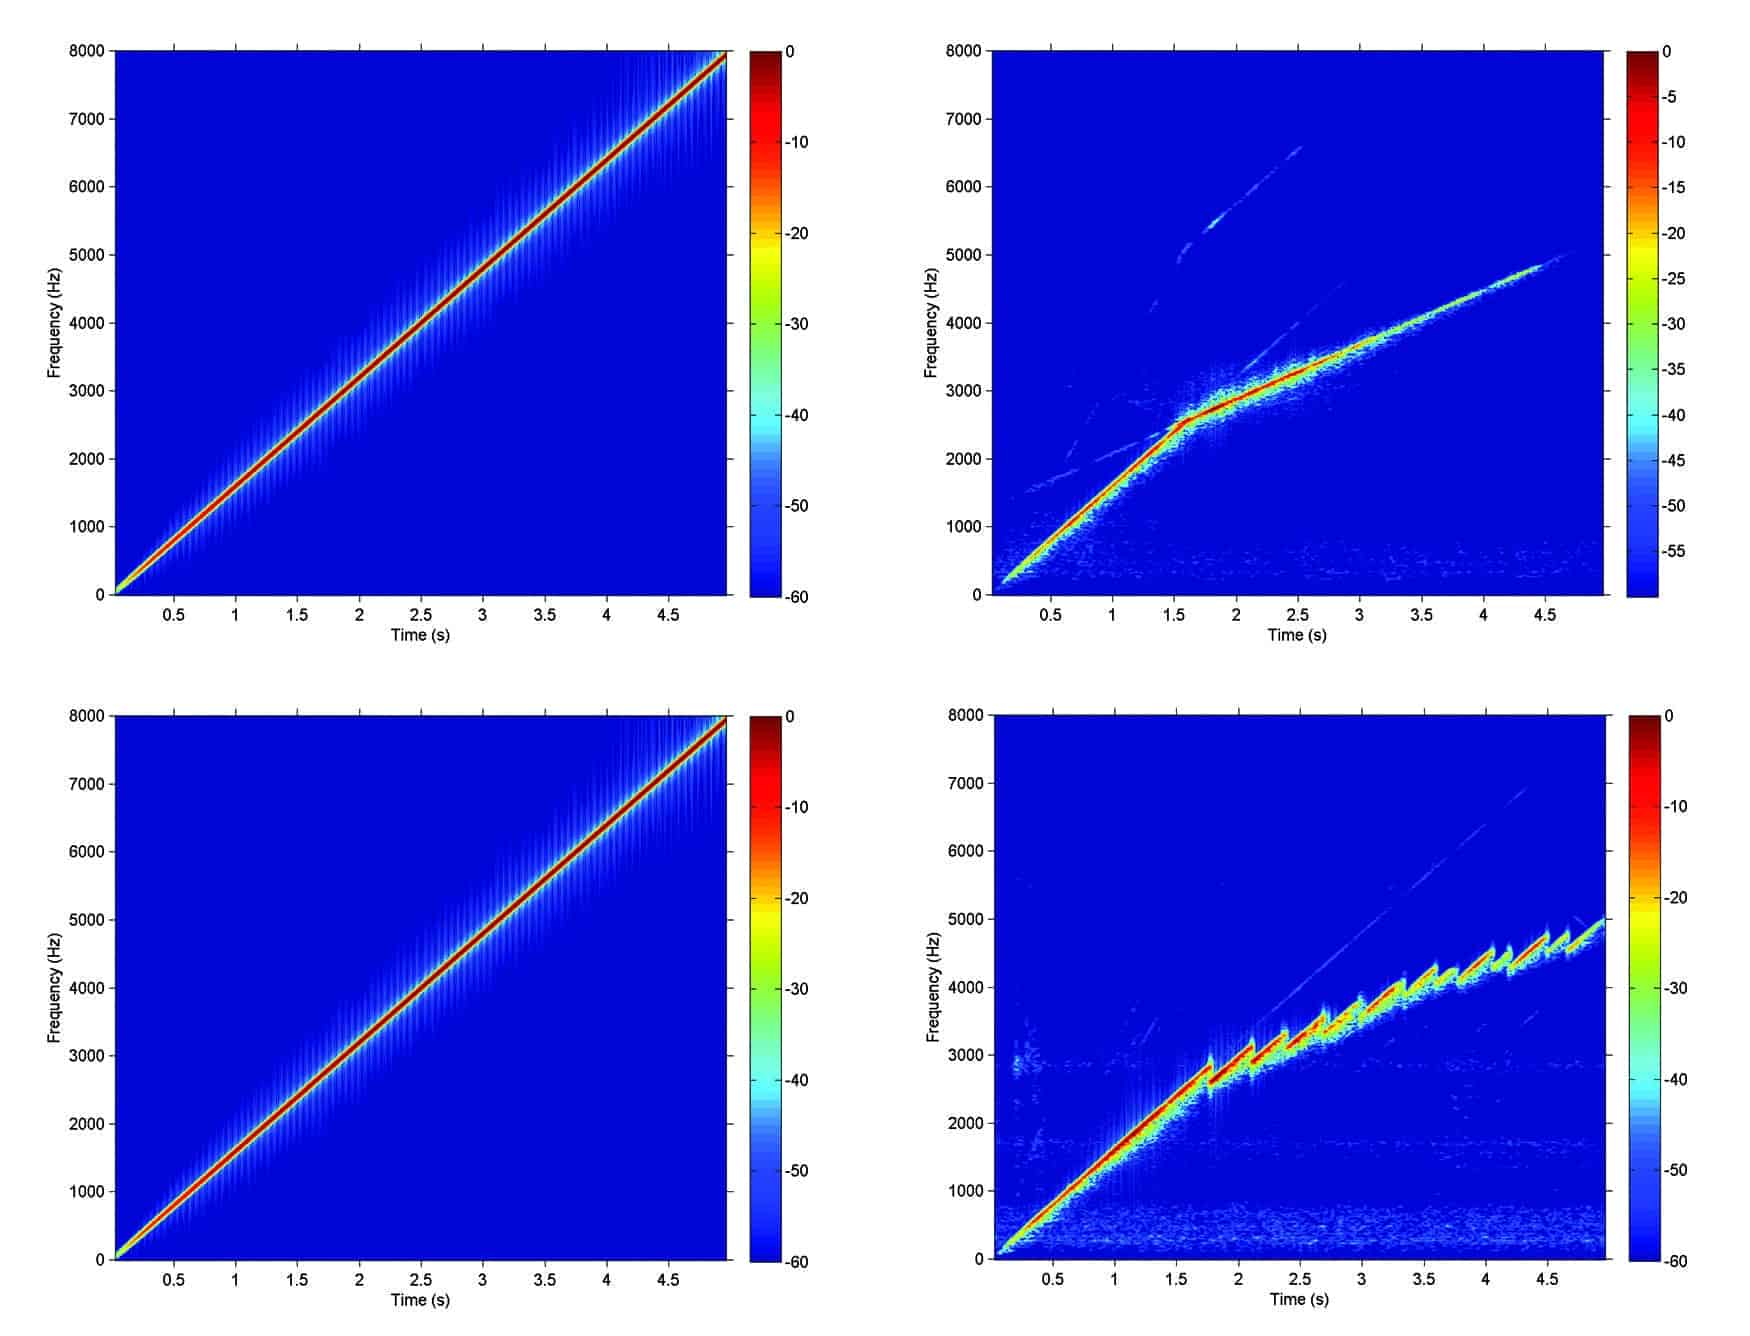
Figure 5. Spectrograms for a swept pure-tone were measured unprocessed (upper- and lower-left panels), and with both amplitude and frequency compression activated (upper- and lower-right panels). The lower-right panel shows the results for another manufacturer’s non-proportional frequency compression, while the upper-right panel shows the results for Sound Shaper. These spectrograms show that less distortion is generated by the Sound Shaper proportional frequency compression strategy than by the non-proportional frequency compression approach.
The main benefit of a proportional frequency compression technique is that there is less distortion as compared to a nonlinear compression strategy. To illustrate the differences in the processing of a signal, a pure-tone sweep was processed through ReSound’s proportional frequency compression and another manufacturer’s non-proportional frequency compression to create spectrograms (Figure 5). Each spectrogram shows time on the x-axis and the output frequency on the y-axis. Colors indicate the intensity of the signal, with red indicating the most intense and blue indicating the least intense. Both hearing instruments were programmed with amplitude compression for a mild-to-moderate hearing loss, with similar frequency compression kneepoints and ratios.
The results for both devices show that the frequency of the hearing aid output is lowered, and to approximately the same degree. The difference is that, for the non-proportional method (lower-right panel), there is more distortion in the output than with the proportional method (upper-right panel) used in Sound Shaper.
Sound quality for music was also evaluated for proportional and non-proportional frequency compression via a predictive model. In this comparison, each hearing instrument was programmed for three hearing losses: mild flat, mild sloping to moderately severe, and mild sloping to profound. Gains were set according to the default prescriptive targets in the respective manufacturer’s fitting software. Frequency compression was set to “Off,” “Moderate,” and “Strong.” The “Moderate” setting had a frequency compression kneepoint as close to 3 kHz as possible, and a compression ratio as close to 2:1 as possible. The “Strong” setting had a frequency compression kneepoint as close to 2 kHz as possible, with the same 2:1 compression ratio as used by the “Moderate” setting.
Identical 10-second segments of pop music presented at 60 dB SPL (RMS) were recorded through each hearing instrument for each of these hearing losses. The recordings were then analyzed through the Hearing Aid Speech Quality Index (HASQI),16 which is based on coherence between the input and output signals of the hearing aid, and yields a score on a linear scale from 0 to 100%. A higher HASQI score predicts better sound quality, as the output sound will be more similar to the input sound, with less added noise and distortion relative to the original input sound.
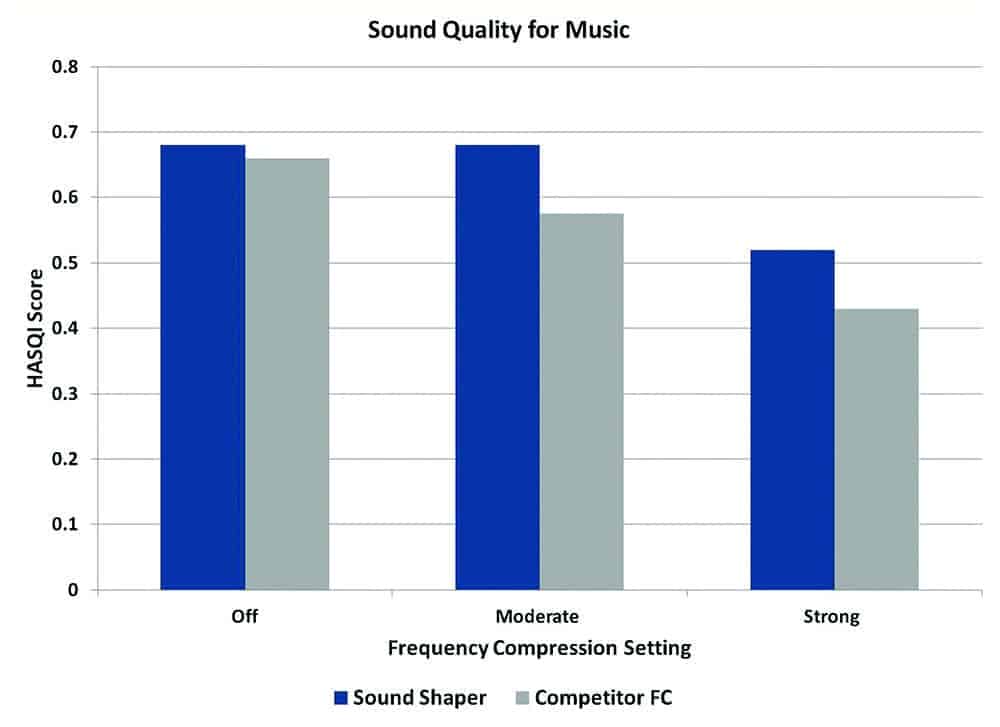
Figure 6. Better sound quality for music is suggested by the HASQI for Sound Shaper than for a non-proportional frequency compression (FC) strategy with similar kneepoints and compression ratios.
Results for all three types of hearing losses showed the same trends, so for simplicity, the averages of these results for each frequency compression setting are depicted in Figure 6. The highest HASQI scores relative to the input signal were obtained when frequency compression was deactivated (the “Off” setting). For both frequency compression techniques, the HASQI score was inversely related to the aggressiveness of the algorithm. This pattern is similar to what was observed by Parsa and colleagues14 in their investigation on the effect of nonlinear frequency compression on sound quality.
This indicates that stronger frequency compression settings are predictive of poorer sound quality regardless of which method of frequency compression is used. These results are also in agreement with other research regarding sound quality for music with frequency lowering.15 However, the HASQI results overall predicted better sound quality for the proportional frequency compression technique (Sound Shaper) than for the non-proportional frequency compression strategy.
Summary
Sound Shaper provides hearing care professionals with another tool to improve high-frequency audibility, especially for individuals who do not receive optimal results with traditional amplification. For certain individuals, Sound Shaper can improve audibility for high-frequency speech sounds, such as /s/ and /th/, while maintaining sound quality to a greater degree than a non-proportional frequency compression strategy. ReSound Sound Shaper is designed as an option that enables hearing care professionals to better accommodate the needs of their individual patients.
References
1. Alexander JM. Individual variability in recognition of frequency-lowered speech. Seminars in Hearing. 2013;34(2):86-109.
2. American National Standards Institute (ANSI). ANSI S3.5-1997, Methods for Calculation of the Speech Intelligibility Index. Washington, DC: ANSI.
3. Moore B. Dead regions in the cochlea: Conceptual foundations, diagnosis, and clinical applications. Ear Hear. 2004;25(2):98-116.
4. Arehart KH, Souza P, Baca R, Kates JM. Working memory, age, and hearing loss: Susceptibility to hearing aid distortion. Ear Hear. 2013;34(3):251-260.
5. Ching TYC, Day J, Zhang V, Dillon H, Van Buynder P, Seeto M, Hou S, Marnane V, Thomson J, Street L, Wong A, Burns L, Flynn C. A randomized controlled trial of nonlinear frequency compression versus conventional processing in hearing aids: Speech and language of children at three years of age. Int J Audiol. 2013;52(S2):S46–S54.
6. Baer T, Moore BCJ, Kluk K. Effects of low pass filtering on the intelligibility of speech in noise for people with and without dead regions at high frequencies. J Acoust Soc Am. 2002;112:1133-44.
7. Vickers DA, Moore BCJ, Baer T. Effects of low-pass filtering on the intelligibility of speech in quiet for people with and without dead regions at high frequencies. J Acoust Soc Am. 2001;110:1164-1175.
8. Cox RM, Johnson JA, Alexander GC. Implications of high-frequency cochlear dead regions for fitting hearing aids to adults with mild to moderately severe hearing loss. Ear Hear. 2012;33(5):573–587.
9. Ricketts TA. Hearing aid features across manufacturers: What really works and clinical implications. Paper presented at: Illinois Academy of Audiology Convention, Chicago, January 29, 2014.
10. Moore BCJ, Fullgrabe C, Stone MA. Determination of preferred parameters for multichannel compression using individually fitted simulated hearing aids and paired comparisons. Ear Hear. 2011;32(5):556-68.
11. Ricketts TA, Dittberner AB, Johnson, EE. High-frequency amplification and sound quality in listeners with normal through moderate hearing loss. J Speech Lang Hear Res. 2008;51(1):160-72.
12. Hopkins K, Khanom M, Dickinson A, Munro KJ. Benefits from non-linear frequency compression hearing aids in a clinical setting: The effects of duration of experience and severity of high-frequency hearing loss. Int J Audiol. 2014;53:219-28.
13. Haastrup A. Improving high frequency audibility with Sound Shaper. ReSound white paper, 2013. Available at: http://www.gnresound.com/~/media/DownloadLibrary/ReSound/00-local-downloads/US/ReSound-LiNX/Sound%20Shaper%20Whitepaper.pdf
14. Parsa V, Scollie S, Glista D, Seelisch A. Nonlinear frequency compression: Effects on sound quality ratings of speech and music. Trends Amplif. 2013; 17(1):54-68.
15. Bentler R. Hearing aids: Clarity or controversy? AudiologyOnline Hearing Aid Conference (Course 21332); 2012.
16. Kates JM, Arehart KH. The Hearing-Aid Speech Quality Index (HASQI). J Audio Engineering Soc. 2010;58(5):363-81.
CORRESPONDENCE can be addressed to Dr Stender at: [email protected]