One hundred individuals—half with hearing aid experience and half without—viewed a series of computer-simulated scenarios and were asked their willingness to pay (WTP) above the base price of a hearing aid for various features. They were also asked if their WTP values for a particular feature would vary based on the style of the hearing aid.
For most health care encounters, patients are not in a position to select among options of care. If an individual needs a hip replaced, for example, the patient does not decide among sizes and styles—those decisions are determined by the nature of the surgery and the preference and experience of the surgeon. For other interventions, however, the patient can exercise considerable flexibility and choose among several available options. With eye care, for example, the patient decides between glasses or contact lenses. If glasses are preferred, the patient decides on frame style and type of lens. If bi- or tri-focal lenses are required, a choice is made between graduated and ungraduated. These decisions will ultimately affect not only patient satisfaction but also the overall price of the eye care product. By choosing or not choosing among these options, the patient is expressing willingness-to-pay (WTP) for these features.
Patients seen for hearing care also have options available to them, including style, level of technology, and added features such a telecoil or directional microphones. Since many options are often “bundled” into a specific, proprietary hearing aid model, the patient is not in a position to determine if he/she is willing to pay for these specific features based upon the patient’s preference, income, or expectations of benefit.
The concept of willingness-to-pay has been explored in the audiology literature, but only in terms of a post-treatment measure. Palmer et al.,1 for example, examined how much patients would be willing to pay for hearing aids with different quality sound. By varying the input to Class A and Class D amplified hearing aids, the investigators found a strong relationship between the perceived quality of the amplified signal and the amount of money patients were willing to pay for hearing aids associated with that sound quality. Results indicated that the participants would be willing-to-pay, on average, $21.00 for each additional point in improved quality.
Chisolm & Abrams2 used a willingness-to-pay approach to examine the value associated with self-perceived hearing aid benefit as measured by the Abbreviated Profile of Hearing Aid Benefit (APHAB).3 Results suggested that the participants were willing-to-pay $22.06 more for a hearing aid for each 1-point increase in APHAB Global benefit.
While these studies provide compelling evidence for the overall benefit of amplification, they do not reveal what value individuals would place on individual hearing aid features before the selection and fitting if they had the opportunity to do so. This information may be of considerable interest in view of the newest generation of digital signal processing (DSP) instruments that incorporate features that increase the cost of the instrument. Examples include expansion, adaptive directionality, active feedback cancellation, and automatic noise management.
The purpose of the following study was to examine patient preferences for signal processing strategies and the interaction of these preferences with hearing aid style using a WTP approach. The specific questions addressed were:
n What, if any, are the effects of signal processing strategy (ie, expansion, directional microphones, feedback cancellation, and noise management) on preferences as measured through WTP?
n Do preferences for signal processing strategies interact with the following hearing aid styles: behind-the-ear (BTE); full-shell in-the-ear (ITE); in-the-canal (ITC), completely-in-canal (CIC), and Snap Tip®?
n Does hearing aid experience influence perceived value, as measured through WTP of hearing aid signal processing strategies and/or hearing aid style?
Judging WTP via a Computerized Interactive Survey
Participants. A convenience sample of 100 individuals, all with self-reported hearing loss, were recruited at the Veterans Affairs (VA) Medical Center in Bay Pines, Fla, and the University of South Florida from September 2002 to April 2003. Fifty had prior hearing aid experience (ie, “Experienced” group), while the remaining 50 had never used hearing aids (ie, “No Experience” group).
| The Computerized Survey
Survey Organization The individual reported how much he or she would be WTP for different telephone options: “For example, given a desktop telephone with a base price of $30.00, how much extra would you be willing to pay for voice mail?” [Subject keys in dollar value.] “How much would you be willing to pay to add voice-mail to a cell phone with a base price of $50.00?” [Subject keys in value.] “Here’s another example: Given a desktop telephone with a base price of $30.00, how much extra would you be willing to pay for Caller ID?” [Subject keys in value.] “How much would you be willing to pay to add Caller ID to a cell phone with a base price of $50.00?” [Subject keys in value.] Familiarization Task #2: Noise Management Technology. To familiarize participants with the WTP task for hearing aid signal processing, the subjects’ read: “Hearing aids come with different sound processing technology options. First, you will see a movie clip in which standard sound processing technology is used. Then, you will see a movie clip in which an optional sound processing technology is used. On average, a hearing aid with standard sound processing technology costs about $2,100. After seeing both clips, we will ask you to tell us how much more, if any, you would be willing to pay for the optional sound processing technology.” This practice video simulation shows two speakers in the presence of drill noise in the background. The optional hearing aid simulated noise management by providing loudness comfort and then returning to a conversational level after the noise ceased. This is followed by the Willingness-to-Pay (WTP) Scenario. Willingness to Pay Scenarios This amount was also considered for the next activity: Determining the value of the optional signal processing technology, while considering the appearance of several hearing aid styles. Scenario Descriptions Expansion. A man using hearing aids with standard signal processing is disturbed by the audibility and constancy of a refrigerator’s motor. With optional signal processing, the expansion circuit suppressed the refrigerator noise and the wearer was unaware of its presence. The feature resulted in him being undisturbed by the noise. Directional Microphones. In this scenario, optional signal processing improves the signal-to-noise ratio (ie, reduces the loudness of multi-talker background noise) during a party, while the wearer listens to one conversational partner situated in front. The hearing aid with standard signal processing amplifies all sounds equally. Feedback Cancellation. The optional signal processing in this scenario allows the user to hear a talker on the telephone without the occurrence of feedback. On the other hand, standard signal processing lacks the ability to eliminate feedback; therefore, the listener is forced to remove the hearing aid in an attempt hear the speaker. Noise Management. While driving with the car window down, a man attempts to listen to the radio. In the “Optional Signal Processing Technology” scenario, the overall noise level is decreased and the man appears to hear the radio. Without this feature, the man cannot hear the radio adequately. |
Table 1 shows the gender, age, and income characteristics of the participants in both groups. Within the Experienced group, 6 of the hearing aid users were fit monaurally, and 44 binaurally. Of these individuals, 10 reported that they were “very satisfied” with their hearing aids, 23 reported being “satisfied,” 9 were “neutral,” and 8 were “dissatisfied.” None of the participants indicated that they were “very dissatisfied” with hearing aid use.

The difference in gender distribution between the groups was statistically significant (t =10.98, p=0.0009) as was the age distribution (t(98)=3.018, p=0.003). The income distributions, however, were not statistically significantly different between the groups.
Software. A custom-written computer program placed text, photographs, and movie clips into an interactive survey for the purpose of data collection. Text provided additional details and descriptions of the WTP procedure while photographs showed color examples of five hearing aid styles (see sidebar on p. 18). Movie clips of simulated communication scenarios demonstrated the effects of several hearing aid processing strategies. Additionally, this program was configured to transfer and save each participant’s responses to a database file for subsequent analyses.
Instrumentation. Personal computers served to present the software program for data collection. Participants viewed the program with the embedded video clips on a 17-inch color monitor and listened to the audio tracks binaurally through Sennheiser HD 265 headphones.
Procedure. Each participant completed the testing protocol within one 30-45 minute session. Testing occurred in a quiet room where, after obtaining informed consent, the participant sat in front of the desktop computer. A binaural most comfortable listening (MCL) level was obtained by presenting a digital recording of the “Rainbow Passage” (male speaker) and adjusting the computer volume. This level remained fixed for the entire protocol. Two familiarization tasks were also presented to introduce the concept of WTP (see sidebar on p. 18).
Following the familiarization tasks, four simulated listening situations were presented, each with two versions. The first version demonstrated the “standard” signal processing, always valued at $2,100. The second version demonstrated the “optional” signal processing, or the use of a particular processing strategy (ie, Expansion, Directionality, Feedback Cancellation, and Noise Management). After viewing the scenario demonstrating listening with the “standard” and “optional” signal processing (Figure 1), the participant indicated how much more than $2,100 he/she would be willing to pay (WTP) for the optional signal processing technology by keying the value into the computer. Order of presentation of the four signal processing strategies was randomized across participants.
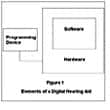
Figure 1. Example of a computer screen shown to the patient for the willingness to pay task. Clicking on the "Standard Sound Processing Technology" screen launched one video file; clicking on the "Optional Sound Processing Technology" screen launched another. See sidebar on p18 for a detailed description of each scenario.
Immediately after providing a WTP value for a processing strategy, the participant was shown a picture of one of the five hearing aid styles. While viewing the photograph of the style, the participant was asked whether he/she wanted to change the WTP value that had been assigned to the processing strategy or keep it the same (Figure 2). If the decision was to keep the value the same, the participant was prompted to key in that same value; if the decision was to change the value, they keyed in the new WTP value. Order of presentation of hearing aid styles within each processing strategy was randomized. After indicating the WTP value for each style within a signal processing strategy, the next signal processing strategy scenario was played and the procedure was repeated until all four signal-processing strategies were presented.
Figure 2. Example of a computer screen shown to the patient to determine how much additional money (if any) the participant would be willing to pay as a function of instrument style.
Results
To examine the effects of signal processing strategy, style, and hearing aid experience on perceived value as measured through WTP; the data were subjected to a General Linear Model (GLM) repeated measures analysis of covariance (ANCOVA). To account for the potential influences of age and gender, these variables were entered as covariates in the model.
Mean WTP values, as a function of signal processing strategy, are shown in Figure 3. It can be seen that there were differences in mean WTP values, with the highest value obtained for Feedback Cancellation and the lowest for Noise Management. The main effect of Signal Processing Strategy was statistically significant [F(3,288)= 3.28, p =0.021]. Post-hoc testing using t-tests with Bonferroni corrections for multiple comparisons and an overall alpha level set to 0.05 revealed that the WTP value for Noise Management was significantly less than for the other three processing strategies. No other comparisons reached statistical significance. Neither the main effect of Hearing Aid Style [F(5,480)=1.68, p=0.138] nor the main effect of Experience [F(1, 96) =0.36, p=0.549] was statistically significant.
Only one interaction reached statistical significance: the interaction between Hearing Aid Style and Experience [F (5,480)=2.54, p=0.028]. This is illustrated in Figure 4. For the Experienced group, style had little effect on perceived value. The WTP values assigned to all styles except CIC were essentially equivalent to the base WTP value (ie, the WTP value for the signal processing strategy obtained without reference to any style hearing aid).
In contrast, for the No Experience group, there was a substantial and predictable influence of style on WTP values. As hearing aid size increased, WTP values systematically decreased. Of note also is the very high WTP value associated for CIC hearing aids.
Differing Values on Technology
One hundred participants with self-reported hearing loss, half with hearing aid experience and half without, indicated how much they would be willing to pay (WTP) for various advanced signal-processing features. Mean WTP values for all participants suggested that the Feedback Cancellation feature was valued the most and Noise Management the least. For the experienced hearing aid users, the order of WTP (from most to least) was: Feedback ($318.42), Directional ($265.82), Expansion ($241.94) and Noise Management ($176.01).
There are several possible explanations for this finding. For the Feedback scenario, the participant viewed a video clip of a hearing aid user placing a phone to the ear with resultant feedback. Within a few seconds, the feedback is no longer audible. Among experienced hearing aid users, feedback is one of the more undesirable side effects of hearing aids, and its elimination is likely to be highly valued. Many inexperienced hearing aid users are familiar with hearing aid feedback through contact with family members who wear hearing aids or by being in public places where a hearing aid oscillates. Even among inexperienced hearing aid users unfamiliar with hearing aid feedback, elimination of such a noxious sound as presented in the scenario would presumably be a desirable feature.
The scenario featuring the Noise Management, on the other hand, is less dramatic. The scene involves a person driving a car with the window down and listening to the radio. As the Noise Management program activates, the wind and car noise decrease making the radio easier to hear. Perhaps the expectation of a Noise Management circuit, particularly among inexperienced hearing aid users, is that unwanted noise should be barely audible. In this scenario, however, the wind and car noise are still very much apparent.
Another consideration that may have affected the perceived value of the Noise Management feature is the fact that another noise management scenario was used for the practice session. This scenario takes place in a room being remodeled. In the background is a worker with a power tool, while in the foreground people are conversing. When the Noise Management feature activates, the noise is reduced. The people stop talking, however, so there is no way to judge the effect of the Noise Management feature on speech intelligibility.
A final consideration for the relatively low value placed on Noise Management may be related to its comparison with the Directional feature, which in the video scenario, appears to be very effective at improving speech intelligibility in a background of competing messages. Indeed, the mean WTP value for the Directional feature was highest for the No Experience group. Their WTP (in order from highest to lowest) was: Directional ($332.57), Expansion ($326.76), Feedback ($319.49) and Noise Management ($241.09). The fact that the Directional feature had the highest WTP value appears consistent with Kochkin’s data4,5 suggesting that directional microphone technology is more closely associated with hearing aid satisfaction than other technologies. The fact that the experienced hearing aid users did not rank Directional as the feature for which they would be most willing to pay, may have reflected their current experience with directional technology. Recent studies6,7 of directional microphones suggest that directional technology is not equally effective for all individuals or in all environments.
An interesting finding was the interaction between hearing aid experience and hearing aid style. The No Experience group, on average, was willing to pay more than the Experienced group for the smaller hearing aid styles (ie, CIC, Snap Tip®, and ITC). In addition, a systematic relationship was seen for the group with no experience with WTP values becoming increasingly higher as hearing aid size decreased, suggesting the high value they placed on cosmetics. In contrast, other than for the CIC, there were no observable WTP differences among the other styles for those in the Experienced group. This suggests that, given their current experience with the limitations of hearing aids, they were willing to sacrifice cosmetics for improved hearing aid performance.
What then, might these findings suggest for manufacturers? Currently, most manufacturers provide a tiered (bundled) approach to technology, offering different models with differing levels of technology at different costs. The results of this willingness-to-pay study suggest that patients place different values on different digital technology. As the hearing industry moves forward toward primarily digital instruments, should they continue with this bundled approach or should digital features be ordered “a la carte” with each feature being individually priced and billed?
We might also ask whether the method used in this study to determine perceived value of different digital technologies is a valid and useful approach for selecting specific features for individual patients. One could certainly argue that a patient cannot determine the true value (economic or therapeutic) of a technological feature by viewing a scenario as opposed to experiencing the effects of that technology firsthand. To the extent that the scenarios demonstrated in the video clips represent real-life situations, willingness-to-pay studies such as the one reported here generally tell us more about a group of individuals than the individuals within the group.
From the results of this study, we were able to determine the relative monetary value that hearing-impaired individuals place on specific digital signal processing features, how those values interact with style, and how those values are influenced by previous hearing aid experience. The technique used in this study may prove to be an effective marketing tool and starting point in determining the value other groups place on recent and emerging hearing aid technologies—including individuals of different ages, incomes, or geographical locations.
Summary
How much do current and prospective hearing aid users value advanced signal processing features, and does the style of the aid influenced perceived value? One hundred individuals, half with hearing aid experience and half without, viewed a series of computer-simulated scenarios with expansion, directional microphone, feedback cancellation, and noise management features turned off and on. They were asked how much more they would be willing to pay (WTP) above the base price ($1,200) of a hearing aid. They were also asked if their WTP values for a particular signal-processing feature would vary based on the style of the hearing aid. Mean WTP values for all participants suggested that the Feedback Cancellation feature was valued the most and Noise Management the least. For individuals with no hearing aid experience, WTP values systematically decreased as hearing aid size increased. Other than for the CIC, there were no observable WTP differences among the other styles for those in the experienced group.
Acknowledgments
This work was supported by Qualitone. We wish to thank Jennifer Lister, PhD, and Richard Roberts, PhD, for the development of the software program. We also wish to thank Cortney Eaton and Melanie Kirsch for assisting in data collection.

|
References
1. Palmer C., Killion M., Wilber L., Ballard W. Comparison of two hearing aid receivers-amplifier combinations using sound quality judgments. Ear Hear. 1995; 16:587-598.
2. Chisolm T, Abrams H. Measuring hearing aid benefit using a willingness-to-pay approach. J Am Acad Audiol. 2001; 12:383-389.
3. Cox, R., Alexander. The abbreviated profile of hearing aid benefit. Ear Hear. 1995; 16:176-186.
4. Kochkin S. 10-Year customer satisfaction trends in the US hearing instrument market. Hearing Review. 2002; 9(10):14-25, 46.
5. Kochkin S. Factors impacting consumer choice of dispenser & hearing aid. Hearing Review. 2002; 9(11):18-22.
6. Surr R, Walden B, Cord M, Olson L. Influence of environmental factors on hearing aid microphone preference. J Am Acad Audiol. 2002;13:308-322.
7. Walden B, Surr R, Cord M, Dyrlund O. Predicting hearing aid microphone preference in everyday listening. J Am Acad Audiol. 2004; 15:365-396.
Correspondence can be addressed to HR or Harvey Abrams, PhD, Audiology and Speech-Language Pathology Service -126, Bay Pines VAMC, PO Box 5005, Bay Pines, Florida 33744; email: [email protected].