The TNT is a reliable and efficient clinical test that allows measurement of a hearing-impaired listener’s tolerance for noise—with and without hearing aids—so that the results can be compared to normal-hearing listeners, among various hearing aid features, and on the same individual over time. This tool may also be useful for estimating potential satisfaction of the fitted hearing aids in real-life noisy environments.
Hearing Aid Fitting | February 2018 Hearing Review
Based on the ANL, the TNT provides a simple and quick way to estimate real-life HA performance
Poor satisfaction with the use of hearing aids in loud noisy environments has been a major complaint from hearing aid wearers.1 Such complaints can originate because of the poor signal-to-noise ratios (SNR) of the noisy environments, aggravated by the broadened critical bands of the hearing-impaired ears and their consequent susceptibility to noise masking. Any distortions generated from the hearing aids such as a low-input limit2 or a low maximum power output (MPO)3 may also contribute to poor performance in loud, noisy places. These factors suggest that the primary reason for dissatisfaction originates from poor speech understanding. If so, improvement of these difficult listening situations might be accomplished by improving SNRs at the hearing aid input with a directional microphone, noise reduction, a higher bit rate analog-to-digital converter (ADC), and/or hearing aid output (such as an appropriate MPO receiver).
On the other hand, studies on realistic SNRs suggest that hearing-impaired listeners typically engage in environments where the SNRs are positive.4,5 When hearing-impaired listeners are tested at these SNRs, their speech in noise scores are often near the ceiling. That is, they should have understood speech with a high accuracy. Cognitive science explains that such environments increase the cognitive load on the listeners, so more effort is needed to maintain successful communication. The increased effort—experienced in the form of increased tentativeness relative to what is heard and the listener’s increased tiredness and/or fatigue—forms the basis for dissatisfaction in loud, noisy places6 even when speech understanding is possible.
These observations prompted Widex to engage in an Effortless Hearing initiative in the design of its products.7 As part of this initiative, we also experimented on a tool that allows indirect measurement of a listener’s effort, so we may validate the success of any intervention. In the following article, we report on the Tracking of Noise Tolerance (TNT) test that achieves such an objective.
Inspiration for the TNT
The TNT test is inspired by the Acceptable Noise Level (ANL) test proposed by Nabelek and her colleagues8,9 as a means to predict a hearing-impaired listener’s success with hearing aids. The ANL includes two parts. First, the listener’s most comfortable listening (MCL) level is measured in quiet using a continuous discourse passage. Second, a background noise is presented along with the speech, and the listener is asked to determine the loudest noise level that s/he can “put up with” while still understanding the speech passage. This is the background noise level (BNL). The difference between MCL and BNL is the ANL.
Listeners who find a noise distracting in speech understanding will likely “put up with” a lower noise level. Listeners who find a noise too loud, thus affecting comfort, will also “put up with” a lower noise level. Listeners who find that they have to be more attentive to speech to maintain speech understanding in noise will also “put up with” a lower noise level. Thus, it is reasonable to speculate that the more noise (level) one can put up with, the less effortful it is for someone to remain engaged in a noisy situation—or the longer one can stay in a noisy situation. It is also reasonable to speculate that listeners who can stay in a noisy situation longer are more likely to be satisfied with their hearing aids than people who cannot (with their hearing aids).
In other words, knowing how much noise a listener is willing to put up with (or tolerate), while ensuring the same acceptable speech understanding, is predictive of a person’s ability for successful communication in noisy situations. Nabelek et al9 reported that hearing-impaired listeners who can tolerate >7 dB of noise over speech at MCL are likely satisfied wearers of hearing aids (ie, ANL <7 dB), while those who need speech to be more than 13 dB louder than the background noise (ie, ANL > 13 dB) are likely unsuccessful wearers.
The ANL is a valuable clinical tool that, in addition to predicting hearing aid success, has also been used in demonstrating the efficacy of hearing aid features, such as the directional microphone10 and noise reduction algorithms.11 On the other hand, as with any behavioral tasks (such as loudness judgments), listeners change their criteria for MCL or BNL or both, and this can lead to a different ANL upon retest. Even with repeated testing (3-4 trials), Olsen and Brännström 12 reported that the within-session, test-retest reliability of ANL was 4 dB. This could be problematic when interpreting the results of the evaluation especially in borderline cases. For example, if someone has a measured ANL of 7 dB, it could mean a real ANL of 3 dB or 11 dB. In the former case, the patient could be viewed as a successful wearer of hearing aids; whereas the conclusion will be less certain in the latter example. A tool to increase the reliability of the ANL measure is desirable.
The Tracking of Noise Tolerance (TNT) Test
The TNT test is a computerized, automatic test that simplifies the process of measuring “tolerable” noise while ensuring the reliability of the measured results. The test does not require the measurement of individual MCLs; rather, based on ecological consideration, a fixed speech passage at 82 dB SPL is used to approximate the speech level in loud background noise. The purpose of the test is to track the listener’s tolerable noise level (TNL)—defined as the loudest noise level that the listener is able and willing to “put up with” without sacrificing speech understanding—over a 2-minute period. Kuk et al13 reported a within-session, test-retest reliability of 2 dB and a between-session reliability of 4 dB. This observation was repeated in another study using clinical patients.14 This suggests that the difference between any repeated TNL measurements greater than 2 dB would be significant.
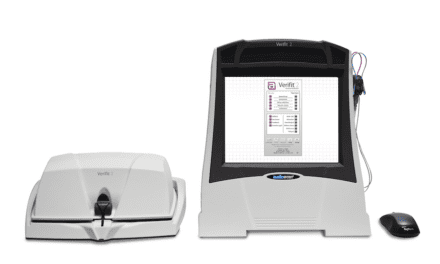
Hardware setup. The TNT software runs on any Microsoft Windows-based computer (Windows 7 up to at least Windows 10). We recommend the use of two loudspeakers, each capable of delivering a maximum output of 95 dB SPL (as measured at the position of the listener) without distortion. One loudspeaker is placed in front of the listener, while the other behind the listener, at equal distance. A simple calibration procedure is written within the program for proper calibration and use. For those without a sound level meter, the SoundTracker feature on the Widex fitting software (COMPASS) can be used for convenient calibration.15 Output from the program can also be routed to the external inputs A and B of the clinical audiometer so its loudspeakers can be utilized instead. In addition, the patient needs access to the keyboard so s/he may indicate his/her noise tolerance levels.
Stimulus materials. Discourse passages at 82 dB SPL are presented from the front loudspeaker. There are 7 equivalent and calibrated passages from which to select. Each passage relates to a specific theme (movies, birds, etc) and each lasts 4.5 minutes to ensure topic continuity during tracking. All passages were determined to be at a 5th-grade reading level. In addition, a passage dedicated for training purposes is also available.
Before the evaluation, the patient is presented the training passage in quiet (at 82 dB SPL) to make sure that s/he understands the passage >90% of the time. In addition, s/he has to judge that the passage was “loud, but not uncomfortably loud.” If the patient has difficulty understanding the passage more than 90% of the time, or if s/he finds the speech to be uncomfortably loud, it is permissible to accept a lower criterion level of understanding and/or to adjust the speech level to a lower level (eg, 75 dB SPL). Once the patient accepts the speech level, the tracking can proceed with the noise activated.
There are two types of noise available for testing. One is a continuous speech-shaped noise that has the same spectrum as the chosen speech passage. The other is a 4-talker babble noise from 2 streams. The noise starts at a level of 10 dB (ie, 72 dB SPL) below the default speech level. It automatically increases in level at a rate of 0.1 dB for every 0.1 s until the listener finds the noise too loud to put up with. This could mean either the noise is too loud and uncomfortable, or that the noise has affected speech understanding to below the criterion level (of 90% or whatever the reported maximum).
At that point, the listener presses the spacebar on the computer keyboard. This decreases the level of the noise at the same rate (0.1 dB/0.1 s). Once the spacebar is released, the noise level increases again. In the default condition, the patient tracks the level of the tolerable noise for a total of 2 minutes. The noise level, speed of noise level change, and the duration of the tracking are adjustable. The following instructions should be given prior to the practice TNT trial:
Acceptability of Speech Level: “You will be listening to a man reading a story at a loud volume. You should find this volume to be loud, but not uncomfortably loud. You should also be able to understand at least 90% of the words. If this is not the case-either not understanding enough or too loud-please let me know and I will adjust it accordingly.”
At this point, if the speech stimulus is too loud, the test administrator may lower the level to a “loud, but acceptable level.” If the listener reports that s/he cannot subjectively understand >90% of words, the administrator may want to check if reducing or increasing the speech level would help. If not, the test administrator notes the highest level of understanding and uses that level of performance as the criterion.
Determining Tolerable Noise Level (TNL): “You will hear some noise in the background while you listen to the male talker. The noise will automatically get louder. I want you to monitor the noise level and maintain the loudest noise level you can put up with while still understanding 90% of the words in the story. If the noise becomes too loud, where you can no longer put up with it or you understand less than 90% of the words in the story, you can turn the noise down by pressing and holding the space bar. If it appears softer than before, you should allow the volume to increase by letting go of the space bar. If it is louder than before, you should turn the volume down to keep at the same level by pressing the space bar again. Your ability to understand speech should never change to below 90%. The test will run for two minutes and then stop.”
While the default tracking time for the tolerable noise level (TNL) is 2 minutes, we have also seen that many listeners (two-thirds of those tested) yielded a stable TNL in a shorter amount of time. Thus, the program tracks the stability of the TNL estimate by concurrently estimating the slope and variance of the tracking function and terminating the program as soon as the criteria for a stable estimate is reached.
The program reports on the estimated noise level that the listener can tolerate at the end of the test. This is the TNL. A higher TNL means a greater tolerance for loud noise. Figure 1 shows the tracking function of a normal-hearing listener (red), along with the online estimate of slope (blue) and variance (yellow) of the tracking function. While the tracking was completed over a 2-minute period, this tracking could have been terminated in 32.5 s (T1 as 2.5 s) because of the stability of the tracking.

Figure 1. Tracking function showing tolerable noise level tracking over a 2-minute period.
Uses for TNT
1) Identifies patients with potential sound intolerance. The potential intolerance for loud sounds may be revealed when the 82 dB SPL speech sample is judged “uncomfortably loud” and/or the person’s TNL level is poorer (lower) than that of the average normal-hearing listener. This needs to be distinguished from hyperacusis, which is an intolerance of even normal speech levels, let alone loud speech. So far, our experience is that none of the 50+ listeners (non-hyperacusis) we evaluated in different studies found the 82 dB SPL speech signal (in quiet) to be uncomfortably loud. Thus, a listener who reports the 82 dB SPL quiet speech as “uncomfortably loud” is likely to have tolerance issue that needs additional attention (and/or intervention with hearing aids). In those cases, the TNT test may be conducted at a lower speech level (eg, 75 dB SPL).
We have also measured TNL from 20 normal-hearing listeners using the two types of noise. For the babble noise, an average TNL of 79.5 dB SPL was measured. For the continuous noise, a level of 76.5 dB SPL was reported. Listeners tolerated lower continuous noise possibly because of the masking effect of the noise (same spectral shape between speech and noise). These indices can be used for normative comparison. TNL lower than these normative values would suggest poorer noise tolerance than normal-hearing individuals. That information may be useful in the selection of hearing aid features (see later) and/or in the counseling of the patients.
Seper et al14 measured the aided TNL of hearing aid wearers who were satisfied with their hearing aids. It was 79.2 dB SPL for the babble noise and 77 dB SPL for continuous noise. That is, the aided TNL of satisfied hearing aid wearers are very similar to that of normal-hearing listeners. A comparison of the aided TNL to the performance of normal-hearing listeners may inform clinicians of potential sound intolerance and/or satisfaction with the use of the prescribed hearing aids.
Measuring the TNL in the unaided mode would reveal a problem that is a combination of the lack of sufficient audibility for speech and immunity against noise intolerance. In the studies we have conducted at ORCA-USA, the unaided TNL of hearing-impaired listeners is poorer than that of normal-hearing listeners (by an average of 3 dB). This is another reflection that the TNL is not just a noise-level measure but includes an element of speech understanding in its determination.
2) Selection/adjustment of hearing aid features. The appropriateness of amplification could affect the resulting TNL. Figure 2 shows the TNL tracked over a 4-minute period in the unaided (first 2 minutes) and aided (last 2 minutes) conditions. In the aided condition (orange curve), the first 2-minute segment was measured with the hearing aid in an omnidirectional mode without any noise reduction (NR). After 2 minutes (time = 121 s), the NR feature on the hearing aid was activated. Compared to the unaided mode, aided with an omnidirectional mic alone (no NR) decreases the TNL by almost 5 dB. The use of NR improves the TNL by about 4 dB (see the last 2 minutes of tracking), but it is still 1 dB poorer than the unaided condition.
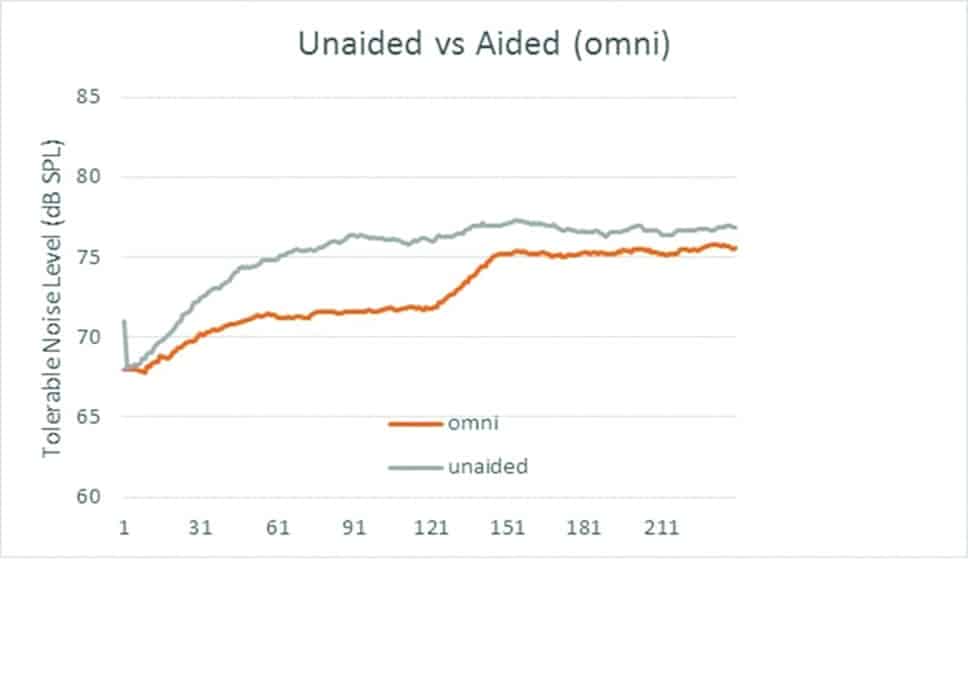
Figure 2. Comparison between unaided and aided TNL. For the aided condition, an omnidirectional microphone was used. The first 2 minutes were measured without noise reduction while the last 2 minutes were measured with noise reduction activated.
This supports the clinical observation that some patients report poorer performance in noise with their hearing aids over the unaided condition. Thus, a comparison of the unaided and aided TNL could give clinicians an indication of how the use of amplification affects noise tolerance. If it worsens, the use of other features within the hearing aids (such as noise reduction) or the use of another hearing aid may be attempted to improve TNL.
As demonstrated below, the use of noise reduction and directional microphones could improve the TNL. Two other features on the hearing aids—the gain setting for loud sounds and the maximum power output (MPO) of a hearing aid—could also affect the output of the hearing aid at a high-input level. One caveat on adjusting MPO is that lowering the MPO too much can affect speech intelligibility in noise.3 In such a case, the TNL could decrease (instead of increase) with a lowering of MPO. Thus the effect of MPO adjustment may be more unpredictable.
3a) Evaluates efficacy of hearing aid noise-reduction features. One hearing aid feature that improves noise tolerance is the noise-reduction (NR) algorithm. Such a system reduces gain (and thus output) on the hearing aid once “noise” is identified. Typically “noise” is defined as a sound that does not exhibit the modulation characteristics of speech.16 Thus, to evaluate the efficacy of typical NR algorithms, one must use a continuous noise (instead of modulated or babble noise) as the interference unless the manufacturer indicates otherwise. In the previous example (Figure 2), NR improves TNL by about 4 dB. Peeters et al11 reported about 2-3 dB improvement in ANL by NR algorithms.
3b) Evaluates efficacy of hearing aid directional microphone. Directional microphones reduce the sensitivity of the microphone system to sounds from the sides and back of the listener. Thus, spatial separation between speech and noise signals is necessary to achieve such an effect. The modulation characteristics of the noise signal are not critical in this case (ie, either babble or continuous noise may be selected). Kuk et al13 reported about 5 dB of TNL improvement from the use of a directional microphone. When both noise reduction and directional microphone are included, an overall TNL improvement of 9 dB is seen when one compares the aided TNL with an omni mic without NR to the aided condition with a directional mic and NR condition.13
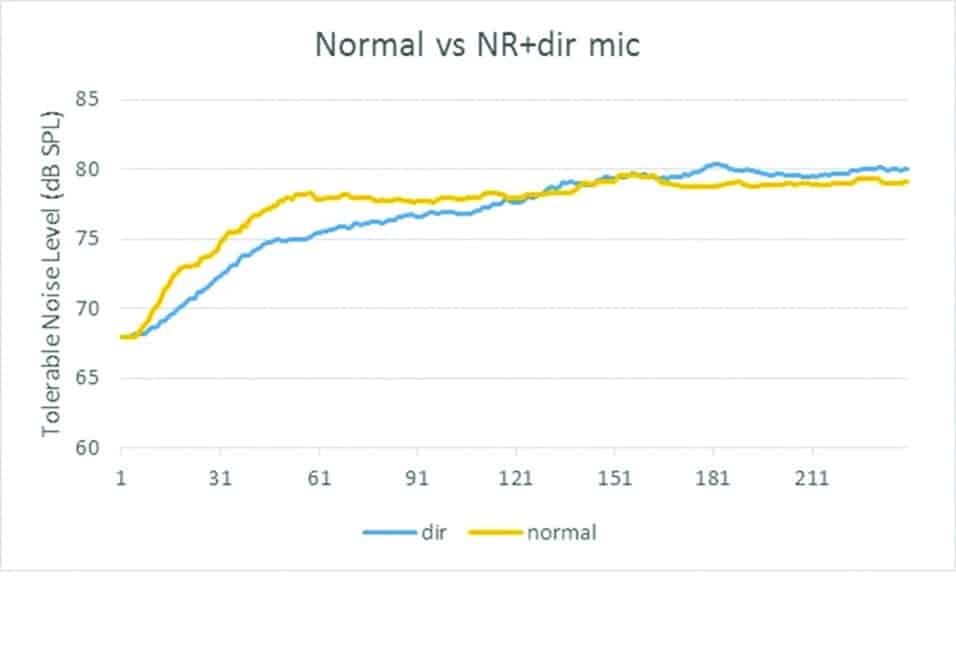
Figure 3. Comparison of TNL measured with normal hearing listeners and aided TNL with directional microphone and noise reduction algorithms activated.
Figure 3 compares the aided overall TNL measured with directional microphone and NR algorithms (blue) to that of normal-hearing listeners.13 One can see that the use of both technologies allowed the hearing-impaired listeners to achieve a TNL approximating that of the normal-hearing listeners. Furthermore, this TNL is 2.8 dB higher than that of the hearing-impaired listeners in the unaided condition. This supports the contention that, under this test condition:
1) Technologies within a hearing aid could affect the patient’s noise tolerance;
2) Hearing-impaired listeners in the aided condition can have a higher noise tolerance than in the unaided condition, and
3) Hearing-impaired listeners can have similar noise tolerance as normal-hearing listeners.
These observations support the use of the TNT protocol to measure the benefits of hearing aids or of specific hearing aid features for use in loud, noisy situations.
4) Compares temporal differences in signal processing. Another advantage of tracking over time is that it allows one to examine the time course of the perceived tolerance. This could provide information on individual differences in tracking of noise tolerance or of differences in the time course of signal processing.
An example of the latter case is shown in Figure 4, which illustrates the effect of a difference in activation time between the noise reduction used in the DREAM hearing aid and the UNIQUE hearing aid. Both of these devices use the Speech Enhancer (SE) for noise reduction. The SE reduces “noise” based on the SNR of the listening environment and the degree of hearing loss of the impaired listener, so that the resulting Speech Intelligibility Index (SII) is maximized for the condition.17 Figure 4 shows the average TNL tracing between the DREAM (green curve) and the UNIQUE (orange curve) with the omnidirectional microphone without (first 2 minutes) and with the NR algorithm activated (last 2 minutes). While the increase in TNL remained the same at 4 dB for both aids, the UNIQUE achieved the same level of tolerance in a much shorter time (about 15 s) than the DREAM (about 30 s) because of the advanced chipset. This suggests that wearers can expect to reach an acceptable noise level in a shorter time with the UNIQUE than with the DREAM.
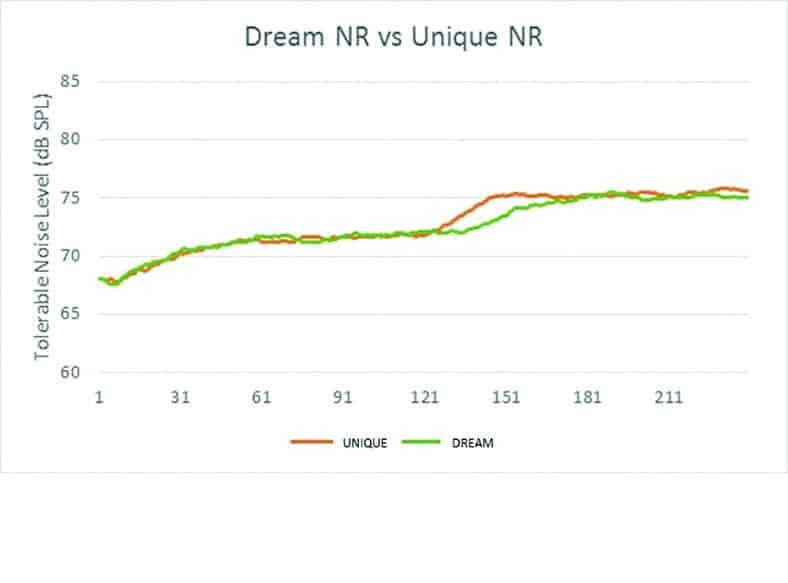
Figure 4. Difference in time course of tolerable noise tracking between the UNIQUE and DREAM hearing aids (noted between 120 s and 150 s time interval).
5) Prediction of hearing aid use in loud noisy situations. Because TNL reflects the loudness level of a background noise while maintaining acceptable speech understanding, its value could reflect how listeners perceive their communication success in real-world loud, noisy situations. An individual with a higher TNL is likely to judge that s/he is more functional (thus more satisfied) in loud, noisy situations than someone with a lower TNL.
Seper et al14 examined the TNL in 17 clinical patients from two clinical sites. The patients reported their satisfaction on their hearing aids in various loud, noisy listening situations listed on the MarkeTrak survey. Their TNL was then measured with their own hearing aids in babble noise and in continuous noise backgrounds. Because all the patients were satisfied with their hearing aids, no correlation was seen between overall hearing aid satisfaction and the aided TNL. However, a moderate correlation (around r = 0.5) was seen between TNL and the proportion of satisfied loud, noisy listening situations (Figure 5). In other words, people who reported a higher aided TNL are likely to be satisfied in more noisy communication situations than those who reported a lower aided TNL.
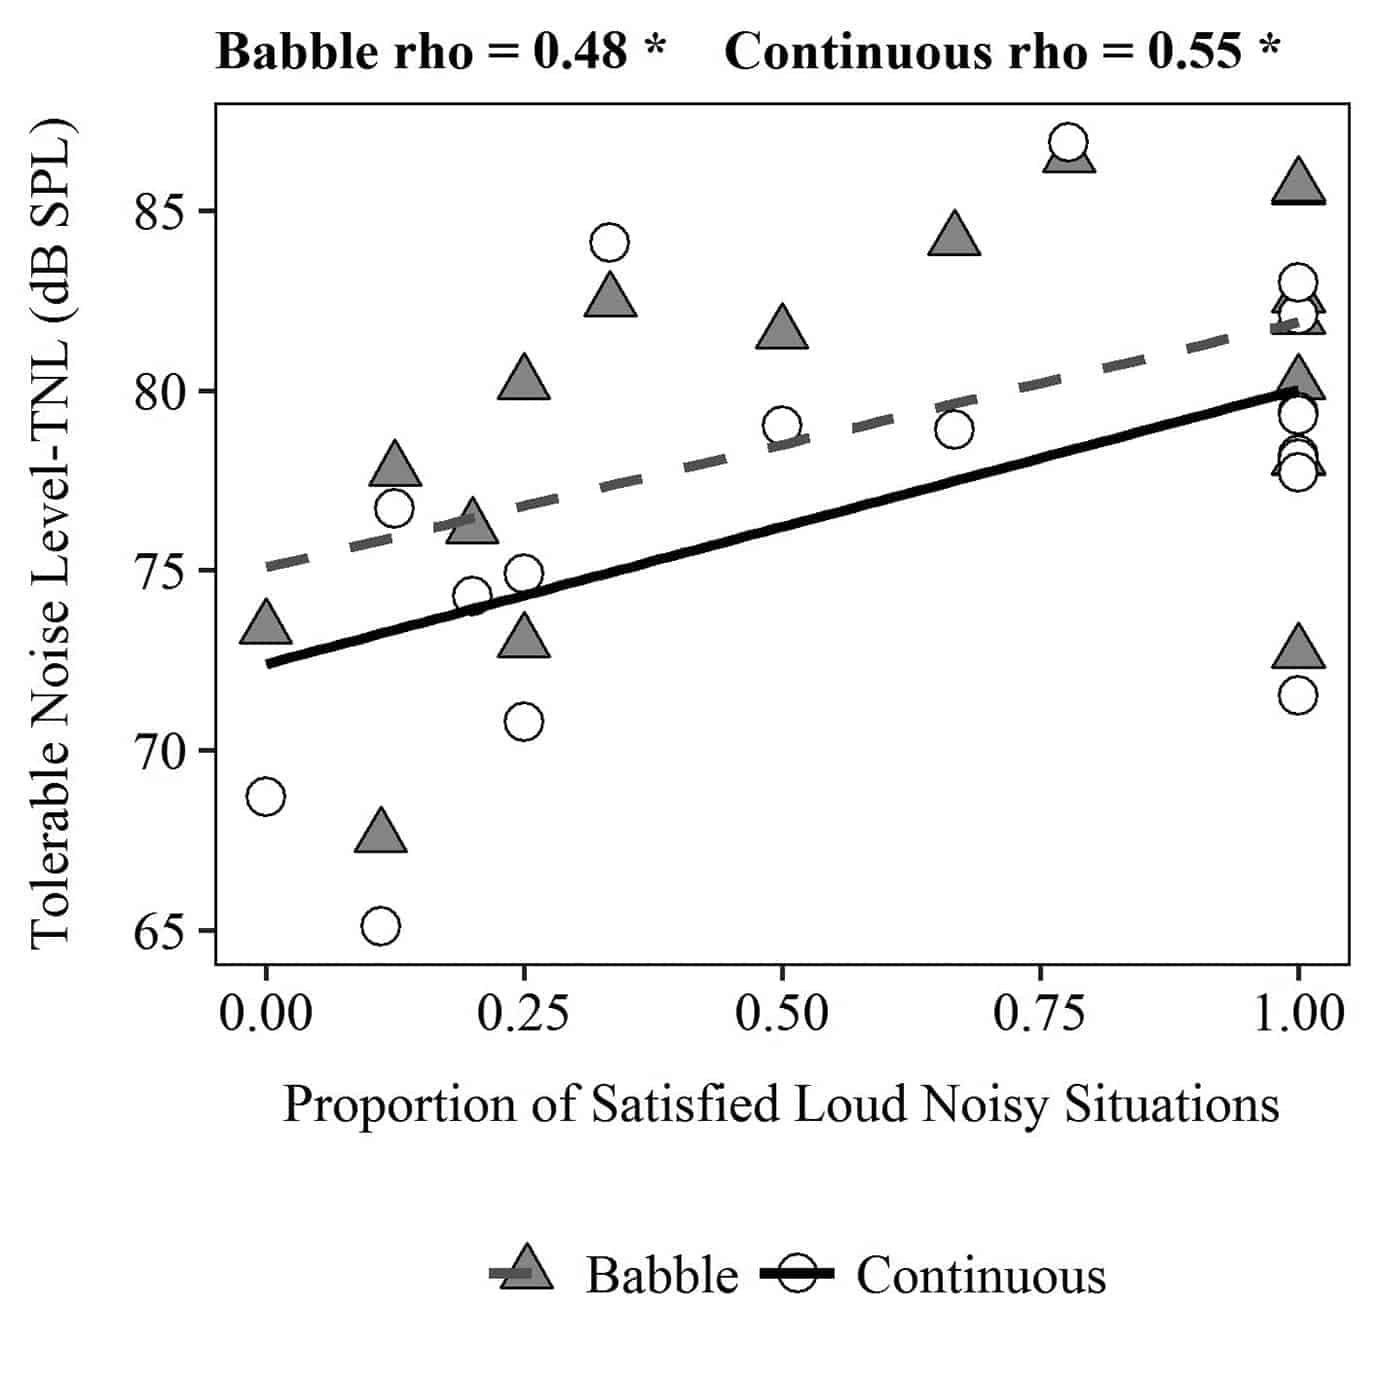
Figure 5. Scatter plot showing the relationship between TNL and the proportion of satisfied loud, noisy situations using babble noise (triangle) and continuous noise (circle) as maskers.
6) Evaluates changes in sound tolerance over time. Another advantage of the high test-retest reliability of the TNT is its potential to document a change in the person’s noise tolerance over time. This can be relevant for new hearing aid wearers who may report a lower TNL during initial fitting because of their ease of distraction with amplified sounds.17 Being able to measure TNL over time can shed light on whether acceptance for hearing aids has improved. This measure may also be explored as a means to measure the effectiveness of loudness desensitization training and speech-in-noise training (increased attentiveness in noise).
Conclusion
The TNT is a reliable and efficient clinical test that allows measurement of a hearing-impaired listener’s tolerance for noise with and without hearing aids, so that the results can be compared to normal hearing listeners, among various hearing aid features, and on the same individual over time. This tool may also be useful for estimating potential satisfaction of the fitted hearing aids in real life, noisy environments.
Correspondence can be addressed to Dr Kuk at: [email protected]
Original citation for this article: Kuk F, Korhonen P. Using Tracking of Noise Tolerance (TNT) as an outcome measure for hearing aids. Hearing Review. 2018;25(2):16-23.

References
-
Kochkin S. MarkeTrak VIII: Consumer satisfaction with hearing aids is slowly increasing. Hear Jour. 2010;63(1)[January]:19-32.
-
Kuk F, Lau C-C, Korhonen P, Crose B. Evaluating hearing aid processing at high and very high input levels. Hearing Review. 2014;21(3):32-35.
-
Kuk F, Peeters H, Lau C, Korhonen P. Effect of maximum power output and noise reduction on speech recognition in noise. J Am Acad Audiol. 2011;22(5)[May]:265-273.
-
Smeds K, Wolters F, Rung M. Estimation of signal-to-noise ratios in realistic sound scenarios. J Am Acad Audiol. 2015;26(2)[February]:183-196.
-
Wu Y-H, Stangl E, Chipara O, Hasan SS, Welhaven A, Oleson J. Characteristics of real-world signal-to-noise ratios and speech listening situations of older adults with mild-to-moderate hearing loss. Ear Hear. August 22, 2017. Available at: http://homepage.divms.uiowa.edu/~ochipara/papers/EANDH.pdf
-
Pichora-Fuller MK, Kramer SE, Eckert MA, et al. Hearing impairment and cognitive energy: The Framework for Understanding Effortful Listening (FUEL). Ear Hear. 2016;37[July, Suppl 1]:5S-27S.
-
Kuk F. Going BEYOND—A testament of progressive innovation. Hearing Review. 2017;24(1)[Suppl]:3-21. Available at: https://hearingreview.com/2017/02/going-beyond-testament-progressive-innovation
-
Nabelek AK, Tucker FM, Letowski TR. Toleration of background noise: Relationship with patterns of hearing aid use by elderly persons. J Speech Hear Res. 1991;34[June]:679-685.
-
Nabelek AK, Freyaldenhoven MC, Tampas JW, Burchfield SB, Muenchen RA. Acceptable noise level as a predictor of hearing aid use. J Am Acad Audiol. 2006;17(9): 626-639.
-
Freyaldenhoven MC, Nabelek AK, Burchfield SB, Thelin JW. Acceptable noise level as a measure of directional hearing aid benefit. J Am Acad Audiol. 2005;16(4): 228-236.
-
Peeters H, Kuk F, Lau C-C, Keenan D. Subjective and objective evaluation of noise management algorithms. J Am Acad Audiol. 2009;20(2):89-98.
-
Olsen SØ, Brännström KJ. Does the acceptable noise level (ANL) predict hearing aid use? Int J Audiol. 2014;53(1):2-20.
-
Kuk F, Seper E, Lau C-C, Korhonen P. Tracking of noise tolerance to measure hearing aid benefit. J Am Acad Audiol. 2017;28(8):698-707.
-
Seper E, Kuk F, Korhonen P, Slugocki C. Tracking of noise tolerance to predict hearing aid satisfaction in loud noisy environments. J Am Acad Audiol. 2018. Submitted.
-
Kuk F, Damsgaard A, Bulow M, Ludvigsen C. Using digital hearing aids to visualize real-life effects of signal processing. Hear Jour. 2004;57(4)[April]:40-49.
-
Kuk FK, Paludan-Müller C. Noise-management algorithm may improve speech intelligibility in noise. Hear Jour. 2006;59(4)[April]:62-71.
-
Kuk F, Peeters H. Speech preservation in noise management strategies. Hearing Review. 2007; 14(12):28-40.Available at: https://hearingreview.com/2007/12/speech-preservation-in-noise-management-strategies/