Required maintenance and repairs continue to negatively influence customer satisfaction with hearing instruments, and ear wax has been established as a significant contributor to these complaints. The following study analyzes a sample of over 7 million receivers, with and without a wax protection system, that were purchased by hearing instrument manufacturers. It found that those companies that had high usage rates of of the wax protection system (70%+ of instruments) were nearly eight times less likely to return the receivers for replacement.
Cerumen management continues to be one of the biggest challenges facing the hearing industry. If there were a solution to the cerumen problem, consumers would be more satisfied with their hearing instruments, since the frequency of difficult cleanings necessitated by debris and cerumen clogging would be reduced. Undoubtedly perceptions of reliability and value would increase because the consumer’s hearing instrument would be less likely to be out-of-commission due to an inoperable receiver. Repair costs in turn could be reduced, benefiting the consumer, dispenser and manufacturer.
According to MarkeTrak V1, only 63% of consumers are satisfied with the “frequency of cleaning” for their hearing instrument, 70% with its reliability and only 46% with on-going expense (which includes batteries and repair costs). In a large-scale German study,2 more than 7 out of 10 hearing instrument users polled requested that manufacturers make hearing instruments that are “easier to clean.” In a recent MarkeTrak VI poll of 2608 current hearing instrument users, 72% percent of the respondents requested that manufacturers make hearing instruments that are “easier to clean” or “which [do] not break down as much.”3
A number of cerumen solutions have been fielded in the past, but to this author’s knowledge no large-scale study has been published demonstrating the effectiveness of these solutions.
This paper is a longitudinal study, comparing the simultaneous credit returns of small receivers for the years 1998-2000 for the entire customer base of Knowles Electronics against their usage of either the Waxbuster and its smaller counterpart, the MicroWaxbuster (both from here on are called The Waxbuster).
Method
Knowles maintains detailed worldwide databases containing sales of transducers, credit returns of transducers and sales of Waxbusters. The Waxbuster active wax protection system is diagrammed in Fig. 1. The small device screws onto the end of an in-the-ear (ITE, ITC or CIC) hearing instrument, and the collar of the device is movable and spring-loaded. When the collar is pressed against a cleaning pad, it retracts inward, causing the built-in piston to clear the sound outlet of cerumen.

Fig. 1. The MicroWaxbuster active wax protection system.
For consumers, use of the device is simple; they press it on a cleaning pad and drag. The wax protection system can be installed on up to 95% of ITE-type hearing instruments. It is designed to be transparent to hearing instrument performance. Laboratory research on the device indicates that it provides a moderate increase in high frequency gain; in fact the response beyond 3 kHz is flattened, making some high-frequency speech cues more audible without increasing risk of feedback.4
For the period 1998-2000, small receiver sales (n > 7 million) and returns were tracked, permitting receiver-return indices to be calculated by customer. Next, Waxbuster sales were expressed as a percentage of small receiver sales for each customer. Sixty-one percent of the customer sample purchased none of the wax protection systems during the test period, while 39% of the sample purchased the system at a rate ranging from 1%-70%+ of their small receiver purchases. As an example, if “Customer X” purchased 1000 small receivers and 200 Waxbusters, then their usage rate would be 20%. Customers were then segmented into one of seven usage categories based on their purchase rate of the wax protection system over the three-year period. The segments are as follows: none (0%), 1-9% WB usage, 10-19%, 20-29%, 30-49%, 50-69% and 70+%.
Results & Discussion
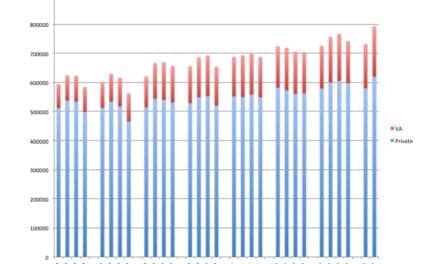
Receiver replacement indices (% receivers returned) were calculated for each of Knowles’ customers. The results are graphed in Fig. 2, where the highest receiver return rate is indexed to 100 as a means of disguising receiver return rates. Heavy users of the Waxbuster (70%+) have a return rate only 13% of the non-user rate. The relationship between wax protection system usage rates and receiver return rates (which were weighted based on receiver purchases) is highly significant (F(1, 94)=14.95, p<.0002). Such a strong relationship is expected to occur by chance in only 2 in 10,000 samples of customers.

|
| Fig. 2. Receiver returns/replacements as a function of Waxbuster or MicroWaxbuster usage (penetration) for the years 1998-2000. Each usage segment is indexed to the largest return rate = 100. Analysis based on more than 7,000,000 small receivers. |
It should be noted that the above study, while conducted on Knowles’ entire customer database over a three-year period on more than 7,000,000 small receivers, is still correlational in nature. That is, manufacturers who install the Waxbuster on hearing instruments may already have a more refined method for handling receivers and/or salvaging receivers when hearing instruments are returned for service. As impressive as this above relationship is, it would be valuable to compare the experiences of a randomly matched sample of consumers, half getting the Waxbuster and the other half getting no active wax protection system. We look forward to further field studies on the effectiveness of the wax protection system in enhancing the consumer’s experience with their hearing instruments.
In the absence of corroborating field research, our internal findings certainly appear promising for the consumer, manufacturer and dispenser. If the system is indeed the solution to the cerumen problem, the consumer will be more satisfied with their hearing instruments, since the frequency of difficult cleanings will be reduced.
In turn, perceptions of reliability and value would increase since consumers’ hearing instruments would be less likely to be “in the shop” for a cleaning or receiver replacement. In addition, repair costs (actual and administrative) could be substantially curtailed, benefiting the consumer, dispenser and manufacturer. Perhaps, with further field research, we will be able to say, “Finally, a solution to the cerumen problem.”

|
Correspondence can be addressed to HR or Sergei Kochkin, PhD, Knowles Electronics, 1151 Maplewood Dr., Itasca, IL 60143; email: [email protected].
References
1. Kochkin S: MarkeTrak V : Customer satisfaction revisited. Hear Jour 2000; 53 (1): 38-55.
2. Stock A, Fichtl E & Heller O: Comparing determinants of hearing instrument satisfaction in Germany and the United States. In S Kochkin & KE Strom’s (eds) High Performance Hearing Solutions. Vol 2: Marketing & Technology. Suppl to the Nov 1997 Hearing Review; 4 (11): 40-46.
3. Knowles Electronics MarkeTrak VI database: Data secured through the National Family Opinion Panel in April, 2001. Publication forthcoming.
4. MicroWaxbuster Active Wax Protection System: Itasca, IL: Knowles Electronics, Inc., April 2000.


