Tech Topic | November 2019 Hearing Review
In a test conducted by an independent laboratory, 16 hearing aid users who are part of a trained panel of sound quality assessors evaluated individualized recordings of streamed speech and music samples through ReSound LiNX Quattro, ReSound LiNX 3D, and 5 other premium hearing aids. ReSound LiNX Quattro and ReSound LiNX 3D were preferred for different types of streamed content. The influence of various attributes of sound quality are discussed.
Direct audio streaming to hearing aids has become an important feature of current technology as it introduces multiple benefits for end users. For example, receiving clear audio and video calls in both ears; enjoying stereo music and media broadcasts; or listening to turn-by-turn navigation instructions, to name a few.
The sound quality of streamed sounds is important and can contribute to positive user outcomes. High sound quality can also contribute to ease and convenience of using hearing aids. For example, it can allow users to appreciate music and participate in music-related activities to a greater degree. Music plays a role in every culture and in many social situations, and has been shown to offer health benefits1 Music also plays an important psychological function whereby people often use music in their everyday lives to relieve boredom, create a comfortable personal space, and enhance mood.2
An extension of this idea is that the sound quality provided by hearing aids can normalize the way users consume media because they don’t need to remove their hearing aids or augment them with bridging devices in order to do so. The ways in which people are consuming music and other audio is undergoing a notable shift to services that provide streaming of audio and video. And consumers over the age of 55 are the primary drivers of increases in the use of smart devices and related services such as streaming on demand.3 The rapid growth in media consumption via smart devices by older adults intersects with the higher prevalence of hearing loss and uptake of hearing aids as adults age. Older adults who wear hearing aids should reasonably expect their hearing aids to support the ways in which they use their smart devices.
Sound Quality Assessment
A sound quality evaluation methodology using a panel of trained listeners who are hearing aid users has been developed by SenseLab in cooperation with several hearing aid manufacturers. SenseLab, headquartered in Hørsholm, Denmark, is an independent test laboratory specialized in performing listening tests in a variety of domains. The methodology is inspired by the food and fragrance industry, which uses sensory panels consisting of trained assessors to evaluate products based on methodologies that are well-established within food science. The idea is that methodologies used to assess the sensory domains of taste and smell can be transferred to other sensory domains such as hearing.
The methodology is double-blinded in that neither the assessors nor the tester knows which conditions are presented. This makes the methodology strong in terms of eliminating biases. Legarth and colleagues4 reported on how a trained listening panel consisting of hearing aid users with similar mild-to-moderately sloping hearing losses was qualified, and found that the panel can make robust and consistent ratings of the key audio features in hearing aids with little bias from experience with their current hearing aids. This methodology has been used for validating hearing instrument sound quality in hearing aids for several years and has become the acknowledged methodology within the hearing aid industry.
The purpose of the current study was to benchmark sound quality preferences for streamed speech and music from an iPhone with hearing aids that have this capability. Because hearing aid sound processing and prescribed frequency-gain characteristics can be different across hearings aids from different manufacturers, a variety of high-end products were included in addition to ReSound premium hearing aids.
Methods
Participants.
A total of 16 members of the SenseLab expert panel participated, including 5 women and 11 men with an average age of 75 years (range: 65 to 84 years). Their average audiograms for right and left ear are shown in Figure 1.
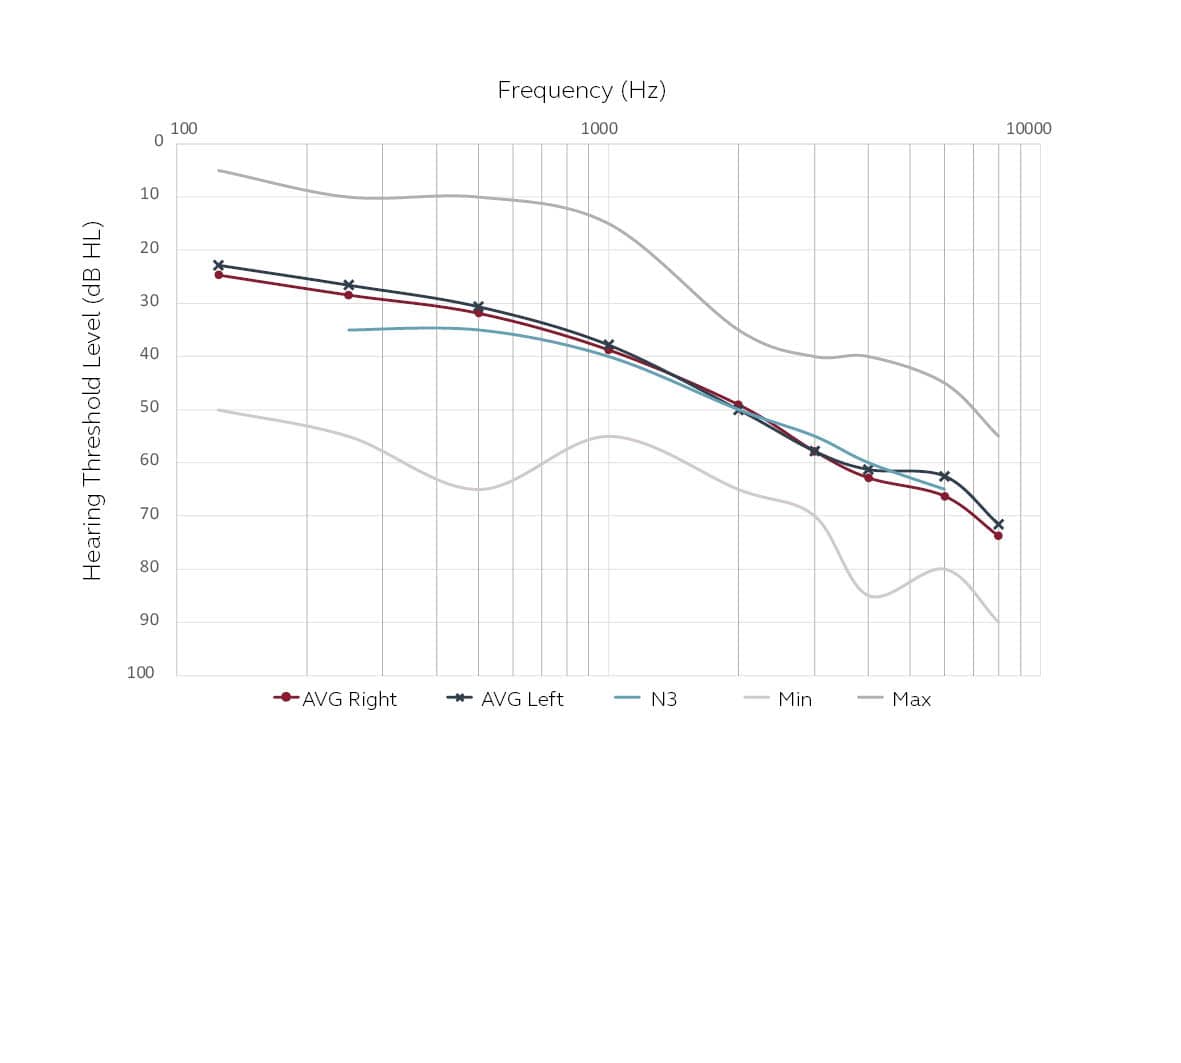
Figure 1. Individual and average audiograms of the test participants for right and left ears. Panelists have audiograms which are similar to the standard N35 audiogram.
Hearing aid fitting and recordings. ReSound LiNX Quattro, ReSound LiNX 3D, and five other premium receiver-in-the-ear (RIE) hearing aids capable of streaming directly from an iPhone were used in this test. Recordings of the test stimuli were made for each ear of each individual listener for each set of hearing aids. The hearing aids were programmed to manufacturer default settings and the corresponding audiogram of each listener. The selected program for the recordings was the one for music listening, recorded music listening, or streaming depending on the particular product and manufacturer’s recommendation for streamed music. The acoustic microphones on the devices were muted, and the devices were fit to a Head-and-Torso-Simulator (HATS Type 4128c) with the manufacturer’s most occluding domes in order to make the recordings. Sound stimuli were streamed from an iPhone 6 to the hearing aids, and the output was captured by the microphones in the ear canals of the HATS. The volume on the iPhone music player was adjusted to ensure that the loudness of the signal output from the hearing aids was as similar as possible across recordings. In post-processing of the recordings, noise below 10 Hz was filtered and corrections were made to account for the responses of the HATS ear canals, as well as the Sennheiser HD650 headphones that were used for playback during the assessment. The detailed setup for the recordings is shown in Figure 2.

Figure 2. The audio file was loaded to the iPhone and played back via the Apple music player app on the phone and streamed to the hearing aids placed on the HATS. The output of the hearing aids was recorded by microphones in the ear canals of the HATS. The recorded analog signals were amplified, digitized, and saved as 24-bit 48 kHz wav files.
Test stimuli. The audio files used for the recordings consisted of a Danish female and male talker reading from a book, and three music excerpts: a jazz piece with female vocal, a classical piano piece, and a classical orchestral piece (Table 1). Because the audio files were looped for playback, the music files were edited to maintain the rhythm when looped.

Table 1. Audio files for the recordings of streamed sounds to the hearing aids.
Procedure. For completion of the testing, the listener was seated in a single walled audiometric test booth. The test stimuli were played back over Sennheiser HD 650 headphones. The headphones were connected to an external FIIO E07K Andes sound card with built-in amplifiers. SenseLabOnline (v4) software developed by FORCE Technology6 was used for execution of all tests. The tests were implemented as full-factorial tests, with evaluation of every combination of all variables. SenseLabOnline managed the double-blinded stimulus presentation, as well as data gathering. A multiple stimulus test type was utilized, and the order of all presentations was randomized for each individual assessor. The test was completed in one session that lasted approximately 2 hours. Prior to the test start, the listeners adjusted the recordings to have equal loudness using sliders in the test interface. This was to eliminate the known bias that loudness differences can have on preference and perceived attributes.
The listeners completed two tasks during the session. The first was to rate how much they liked or disliked the sound samples. For this preference task, participants evaluated the hearing aids using a visual continuous scale where they indicated to what degree they liked or disliked the sound. As shown in Figure 3, the anchors of the scale were “Extremely like” and “Extremely dislike.” While listening, the participant could switch among the recordings being compared, without interrupting playback.
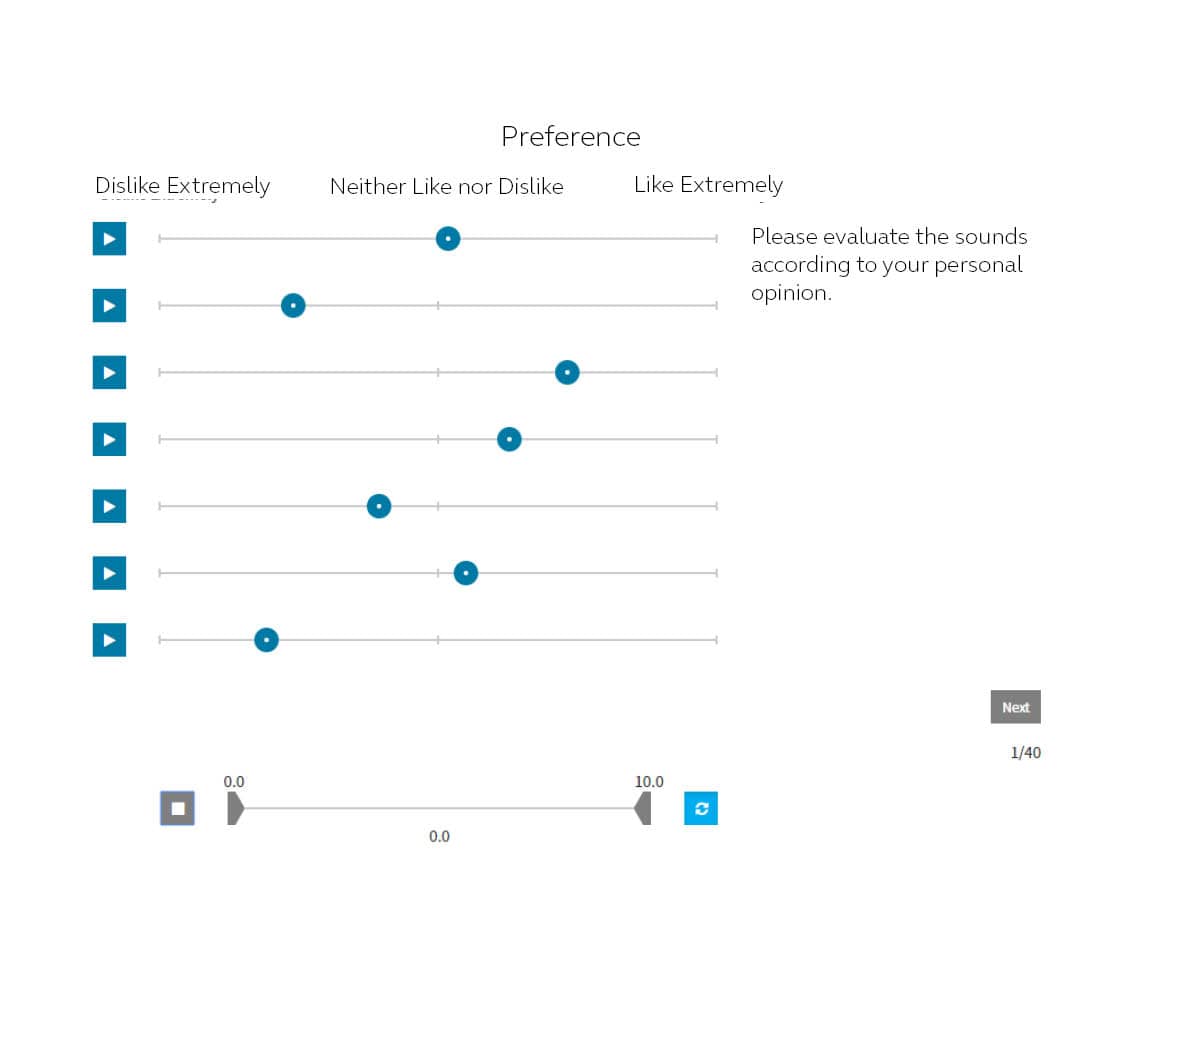
Figure 3. User interface for the preference test. The user interface for the attribute test was similar, but the scale indicated the degree to which the sound fulfilled the particular attribute being evaluated.
The second task was to rate sound quality attributes. The testing of attributes was done in a similar way, except that the scale corresponded to how much the device was judged to exhibit each attribute, with verbal anchors at each end of the scale. The attributes for this test were chosen by the investigator at SenseLab on the basis of informal listening to all recordings and refined at a 2-hour consensus meeting with 6 members of the assessor panel. The choices were based on describing the dominating perceptual characteristics differentiating the hearing aids. The test leader guided the process by which the panel was presented with representative recordings of the streamed audio, and reached consensus on the attributes and their descriptions. The attributes, anchors, and definitions are described in Table 2.

Table 2. Rated attributes with their high level definitions and anchors.
Results and Discussion
Task 1: Preferences.
An overall preference was determined by combining all trials. With 16 assessors and 5 samples, this means that the overall preference was based on 80 samples per device tested. The ReSound LiNX Quattro was rated as most liked for streaming the speech and music samples from an iPhone (Figure 4). This rating was significantly higher (Tukey Honest Significant Difference, p<.05 than all other devices tested except resound linx and brand d. id="attachment_62301" align="alignnone" width="343" href="https://hearingreview.com/wp-content/uploads/2019/11/deTorofig_4.jpg">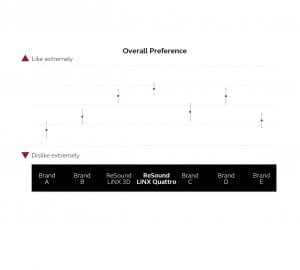

Figure 5a-b (below). Music and speech preference. Mean preference ratings for the streamed speech and music samples with 95% confidence intervals. ReSound LiNX Quattro was rated as most liked for both types of stimuli.
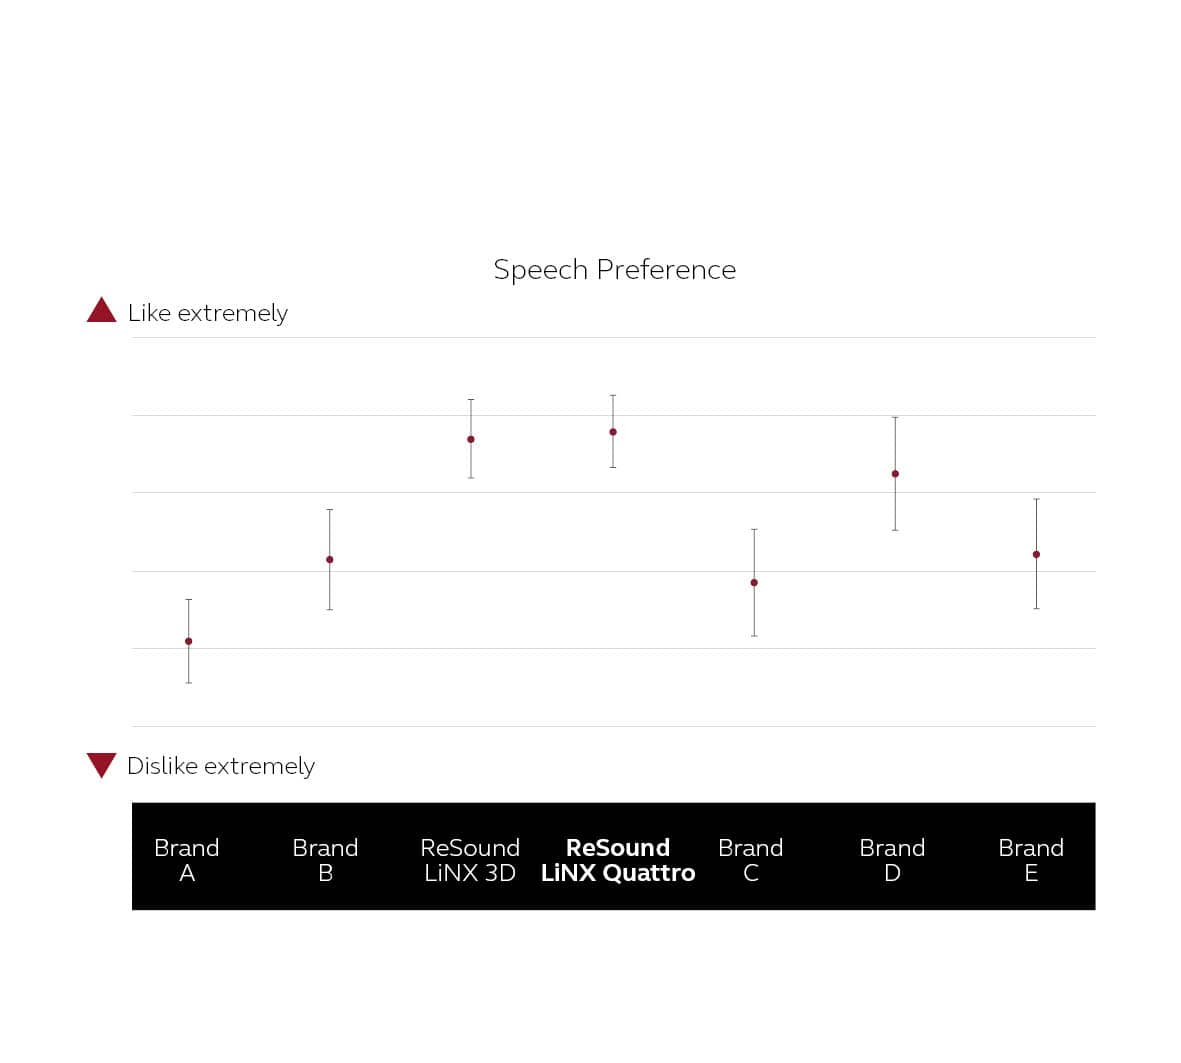
Figures 5a-b shows the preference ratings for the streamed speech and music samples separately. The pattern of preference is similar to the overall preference, with ReSound LiNX Quattro rated as most liked, although not significantly better than ReSound LiNX 3D or Brand D. This supports a robust preference for streaming different types of content to ReSound devices and ReSound LiNX Quattro in particular.
The spread of preference ratings among devices is greater for streamed speech than for the streamed music. This may be due to the fact that the specialized music program was used where allowed by the manufacturer. Most hearing aid manufacturers today have included special settings intended for music listening in their products. These settings generally aim for a “less-is-more” approach, in that special features (eg, directionality and noise reduction) usually are disabled, and compression is reduced in order to preserve the dynamics of music.
Offsets to the prescribed hearing loss dependent gain may also be introduced in order to enhance a particular quality attribute of music, such as bass. This program may not have been ideal for intelligibility and quality of the streamed speech for all devices, and could be reflected in the larger spread of ratings for speech. It is also possible that gain offsets in a manufacturer’s music program may not be attuned with an individual’s preference or optimum for a particular music genre.
The ratings for speech and music are very similar for the ReSound devices in the test. The ReSound music program disables noise management features and reduces the compression ratio slightly, but does not otherwise alter the frequency-gain response from the hearing loss prescribed settings.
The current results support that this program in ReSound hearing aids can provide equally good quality for both speech and music streamed inputs. In addition, the confidence intervals are smaller for the music ratings than for the speech ratings across devices. While this also can be related to use of the music program, it is conceivable that it is easier for listeners to focus solely on quality when rating streamed music, whereas intelligibility may play into preferences for streamed speech and cause more variability in the ratings.
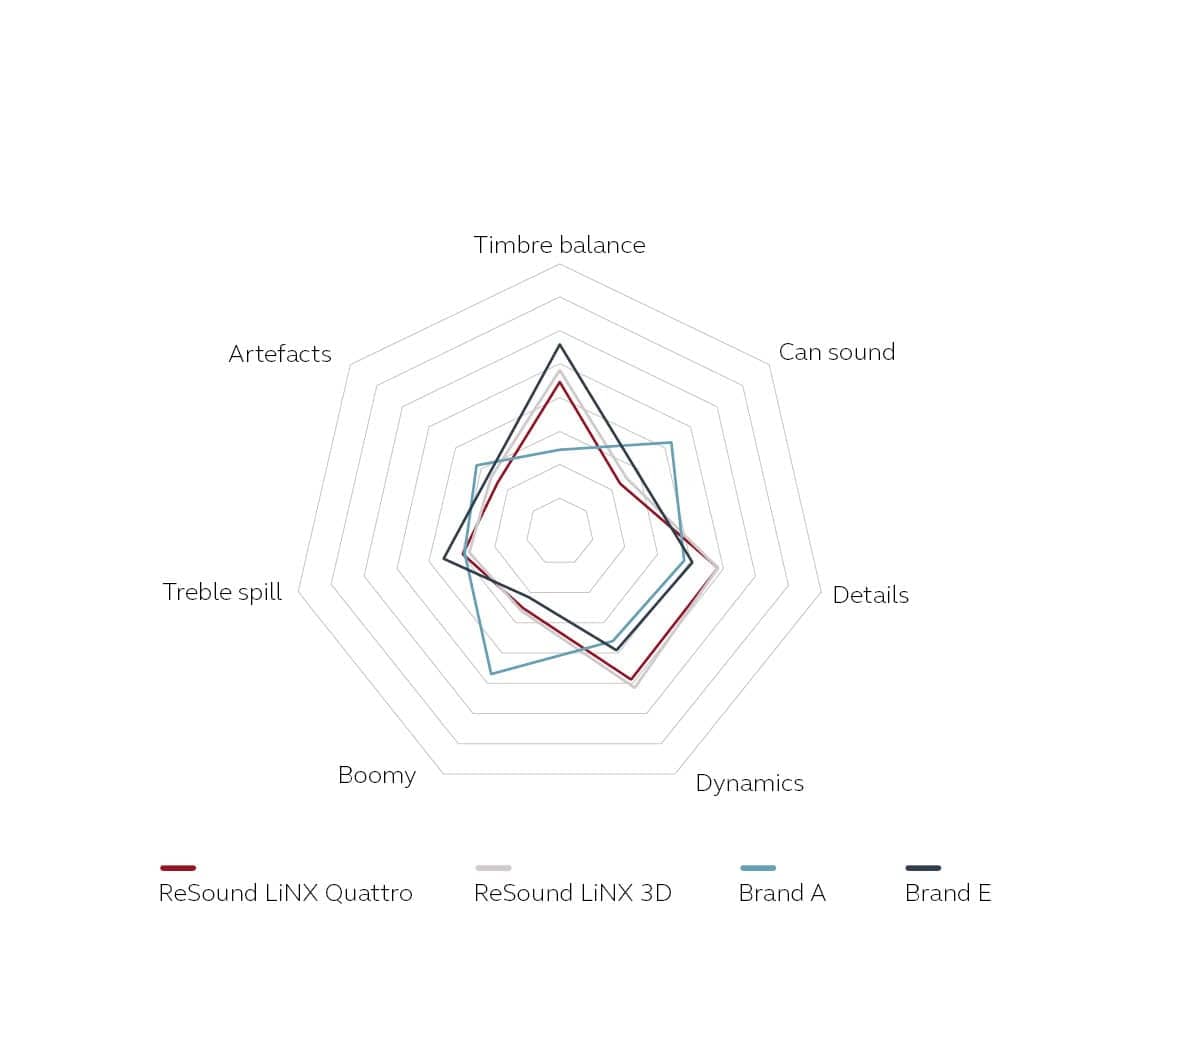
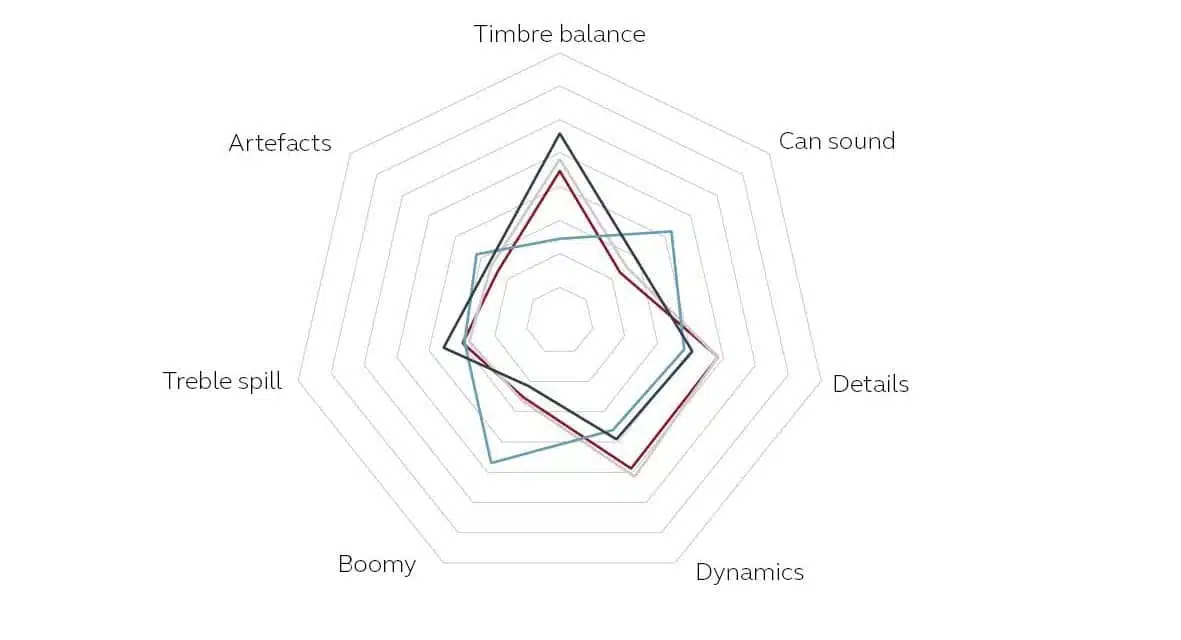
Figure 6. Profile plots of the rated attributes for the two most preferred and the two least preferred hearing aids in the test. ReSound LiNX Quattro and ReSound LiNX 3D were the most preferred and were rated as showing a high level of Dynamics and Details with even Timbre balance.
Task 2: Attributes. One way to represent the results from the attribute assessments is to use profile plots. The profile plots in Figure 6 show the performance of the two ReSound hearing aids and the two least liked hearing aids for seven attributes averaged across all five samples. These plots help identify what differentiates the tested devices perceptually. There is a very high similarity in the plots for ReSound LiNX Quattro and ReSound LiNX 3D, with Timbre balance slightly toward “bright,” a low degree of “Can sound,” and high levels of Dynamics and Details. Brand A was the least liked of all products tested, and shows a very different attribute profile. However, Brand E was the next least liked, but showed an overall pattern similar to the ReSound hearing aids. It was rated as more “bright” on Timbre balance but with less Dynamics and Details, which suggests that these attributes may be important differentiators. In fact, the most differentiating attributes among devices were found to be:
- Timbre balance,
- Boomy,
- Can Sound,
- Dynamics, and
- Details.
Frequency response. The perception of attributes and judgments of overall quality can be influenced by the frequency-dependent amplification provided by the device. For example, the device that was rated as being more Boomy than all the others was the least liked both for streamed speech and music. It is logical to relate this to the low frequency output from the hearing aid. Therefore, it was also of interest to examine the spectra of the recordings made from the devices.
Because all recordings were made with the hearing aids mounted on the HATS, acoustic effects of individual ears were not present in the recordings. In addition, all participants had hearing losses with similar slope and configuration, even though the severity ranged from mild to moderately severe. Considering this, frequency-gain prescriptions as a function of participant may have differed in level but probably not much in response shape. Thus, it was assumed that relative differences in the output of the various hearing aids for different sound samples would be fairly constant across test participants. Therefore, the output of the recordings for one participant was analyzed, and the relative differences among music types and hearing aids are assumed to be fairly representative for all participants. The spectra shown in Figures 7 and 8 are normalized to that of ReSound LiNX Quattro. Since it was the most preferred device, it is of interest to see what relative differences in output each device exhibited.
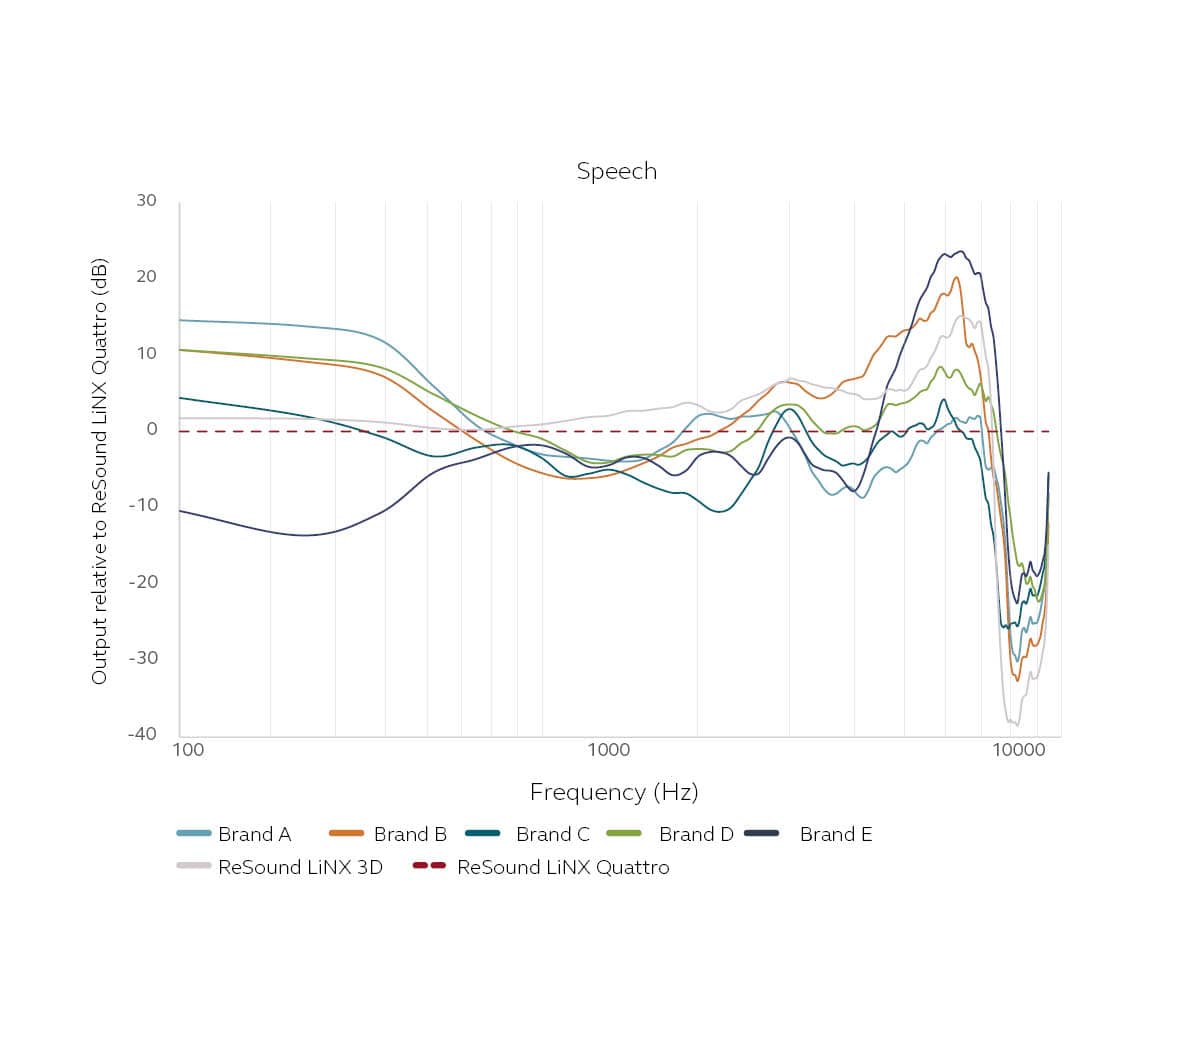
Figure 7. Difference in output spectrum compared to ReSound LiNX Quattro for the speech samples for one participant. A systematic difference is that all have vastly reduced output above 7 kHz relative to ReSound LiNX Quattro.
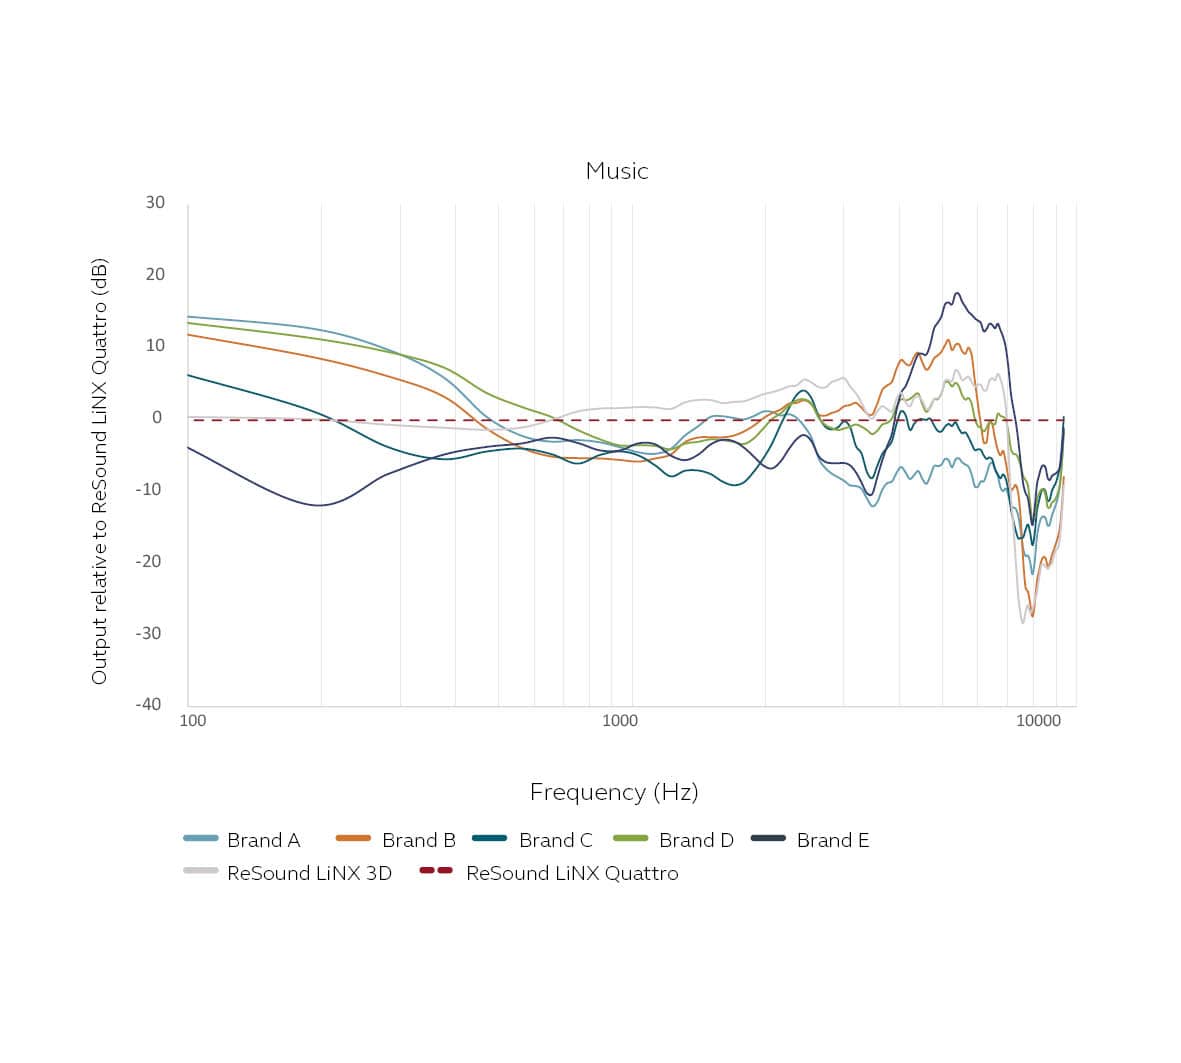
Figure 8. Difference in output spectrum compared to ReSound LiNX Quattro for the music samples for one participant. As observed with the speech samples, a systematic difference is that all have reduced output above 7 kHz relative to ReSound LiNX Quattro.
A clear difference between ReSound LiNX Quattro and the other devices tested is that the output above 7kHz is much lower for all of the other devices. This was somewhat surprising in that two of the other devices should have access to higher bandwidth in the streamed signal, and the hearing aids themselves have the capability to amplify signals above this frequency. This may reflect a choice on the part of each manufacturer not to utilize the full bandwidth available. It may also influence the assessment of greater Details provided by the ReSound LiNX Quattro—and ultimately the higher preference for this device.
Another observation is that three devices appear to enhance the bass response in their music or streaming program more than ReSound hearing aids. Depending on music genre, this may or may not be an advantage for music listening. For example, rock and pop genres are often characterized by a heavy bass line in the music, and it may be preferred to enhance this characteristic. In this test, classical and jazz genres were used, where details in the music and appreciation of different instruments may be masked by too much bass response in the hearing aids. This highlights the importance of personalization in tuning hearing aids to individual preferences.
Regarding music listening in particular, it has been pointed out in the literature that generic settings for music listening probably won’t be suitable for everyone.7 ReSound hearing aids give the user an exceptional degree of control over their settings via the ReSound Smart 3D app. Among other things, the Sound Enhancer feature of the app allows them to adjust up to 6 dB above or below the programmed gain setting in the bass, middle, and treble ranges, as illustrated in Figure 9. This would allow a user to add more bass amplification if so desired in addition to many other adjustment possibilities. It is highly recommended that HCPs counsel users regarding the availability and use of the ReSound Smart 3D app and encourage them to create personalized settings.
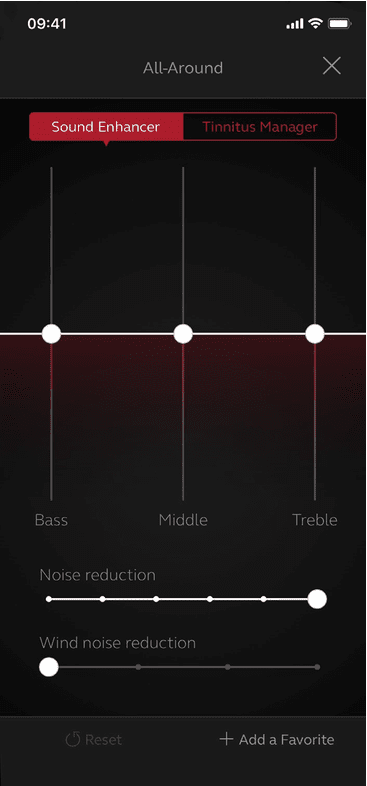
Figure 9. The Sound Enhancer in the ReSound Smart 3D app lets users personalize the sound of their hearing aids. For example, they can customize the bass, middle, and treble ranges.
Summary
Sound quality is difficult to quantify because it is a personal and subjective experience. A method for evaluating sound quality that reduces variability by using trained assessors has become an accepted way to investigate the sound quality provided by hearing aids. ReSound LiNX Quattro, ReSound LiNX 3D, and five other premium hearing aids with capability to stream directly from an iPhone were evaluated for sound quality in streaming using this method.
In a double-blinded design, 16 trained hearing-impaired assessors judged Resound LiNX Quattro as the most-liked product based on evaluation of speech and music samples. ReSound LiNX Quattro and ReSound LiNX 3D were not rated as significantly different, and both were assessed to exhibit a similar pattern of attributes.
Balanced Timbre, high Dynamics and Details, and low Can sound were attributes in common for the ReSound hearing aids. The least preferred devices were characterized by having either a very bright or very dark and boomy sound with flat Dynamics and fewer Details.
A comparison of the output spectra of the recordings made with the different devices revealed much lower output above 7kHz in the streamed signal compared to ReSound LiNX Quattro. Large differences in low frequency output were also observed, and several devices appear to enhance the bass response for music listening. The assessors did not show a preference for this enhancement, although preferences can also be related to music genres. Additionally, ReSound hearing aids users have extensive options to personalize the sound of their hearing aids to their liking with the ReSound Smart 3D app.

Miguel Aranda de Toro, PhD, is Director of External Relations and Jennifer Groth, MA, is Director of Global Medical Affairs at GN Hearing in Ballerup, Denmark, and in Glenview, Ill, respectively. Søren Vase Legarth, MScEE, is an engineer at DELTA SenseLab, in Hørsholm, Denmark.
Correspondence can be addressed to Jennifer Groth at: [email protected]
Citation for this article: Aranda de Toro M, Groth J, Legarth SV. A comparison of direct audio streaming quality in hearing aids. Hearing Review. 2019;26(11):26-30.
References
-
MacDonald RAR. Music health and well-being: A review. Int J Qual Stud Health.2013;8(1).
-
Schäfer T, Sedlmeier P, Städtler C, Huron D. The psychological functions of music listening. Front Psychol. 2013;4(511):1-33.
-
Deloitte. 2017 Global Mobile Consumer Survey: US edition. The Dawn of the Next Era in Mobile. https://www2.deloitte.com/content/dam/Deloitte/us/Documents/technology-media-telecommunications/us-tmt-2017-global-mobile-consumer-survey-executive-summary.pdf. Published 2017.
-
Legarth SV, Simonsen CS, Dyrlund O, Bramsloev L, Jespersen C. Establishing and qualifying a hearing impaired expert listening panel. Poster presented at: 2012 International Hearing Aid Research Conference (IHCON); August 8-12, 2012; Lake Tahoe, CA.
-
Bisgaard N, Vlaming MSMG, Dahlquist M. Standard audiograms for the IEC 60118-15 measurement procedure. Trends Amplif. 2010;14(2):113-120.
-
SenseLabOnline. https://senselab.madebydelta.com/senselabonline/.
-
Looi V, Rutledge K, Prvan T. Music appreciation of adult hearing aid users and the impact of different levels of hearing loss. Ear Hear.2019; 40(3): 529-544.