For the first time in the history of the hearing industry, net hearing instrument sales in the United States surpassed the 2 million unit mark in 2004, according to statistics from the Hearing Industries Association (HIA).1 Likewise, for the first time, quarterly unit sales surpassed the 500,000 unit mark in all 4 quarters of 2004, while sales of digital signal processing (DSP) hearing instruments rose to constitute four-fifths (83%) of the market (Figure 1).
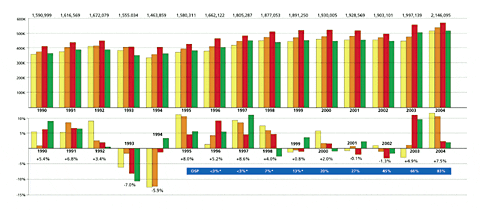
Figure 1. US hearing instrument quarterly and yearly unit sales (top), and percentage gains/losses relative to the previous year (bottom), 1990-2004. The blue bar on the bottom shows the corresponding market share of DSP aids for each year. Last year was the first in that it exceeded 2 million units and in which all four quarters saw sales exceeding 500,000 units. There now have been 7 successive quarters (July 2003 to present) of positive unit volume growth—a streak unrivaled since the 4-year period from January 1995 to September 1998. Source: Hearing Industries Assn (HIA) and HR.
In 2004, net hearing instrument unit sales in the United States totaled 2.14 million units, an increase of 7.46% over the previous year. This was a welcomed continuation of the sales rally that started at mid-year 2003. The hearing industry has witnessed a long drought that seemed to defy the radical improvements in technology (including widespread use of digital and directional systems), better dispenser education levels for both audiology and hearing instrument specialists, and an increasingly aging population. With the exception of a slight uptick in the hearing care market during one 6-month period (September ‘99 to March ‘00), the industry had experienced flat sales for almost 4 years. Therefore, when looking at the last 2 years, the 4.94% increase in 2003 and the 7.46% increase in 2004 represent exceptionally good news.
The 2 million unit mark, in particular, has been a long time coming. “This second million mark is an important one,” says HIA Chairman and President of Starkey Labs Jerry Ruzicka, “but it took much too long to get here. With the help of President Reagan, the industry topped the million mark in 1983, and together we must all ensure that it is not another 2 decades for the next million.” To refresh your memory, 1983 was the year after Studebaker & Bess published The Vanderbilt Report and the year in which some of today’s audiology students were born.
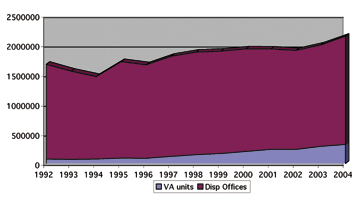
Figure 2. Units dispensed by the Veterans Administration (in blue) and private dispensing offices/practices (in purple). Government purchases of hearing aids in recent years have greatly impacted the hearing industry, as well as affected market penetration. In 1992, VA unit dispensing activity constituted only 4.33% of the market, but now makes up nearly 14.9% of all the hearing aids dispensed in the United States. Source: HIA.
Dispensing activity by the Department of Veterans Affairs (VA) increased by 11.51% in 2004, rising to 319,800 units —or about 15% of all hearing aids dispensed in the United States (Figure 2). This followed a 21.2% increase in 2003, and a rare decrease (-0.15%) in 2002, which helped lead to a subsequent decrease in overall hearing aid sales during that year. Figure 2 shows that VA dispensing activity has accelerated since Congress loosened veterans’ eligibility requirements in 1996. In fact, the VA audiology division is only now catching up with the backlog of veterans who have become eligible for receiving the new benefits, according to Lucille Beck, PhD, director of the VA audiology division.3 The VA has 136 dispensing sites and employs 598 full-time audiologists and 113 technicians to care for some 419,860 veterans who are eligible under VA programs. In total, the agency’s dispensing activity during 2004 fueled about one-quarter (22.16%) of the market’s total growth.
When these government purchases of hearing aids are ignored, private sector hearing aid sales increased by 6.8% after a 2.6% increase in 2003. For the average dispensing professional, sales increased by about 12.4 units per office or about one additional aid per month.
Going All Digital? Hearing Aid Technologies and Styles
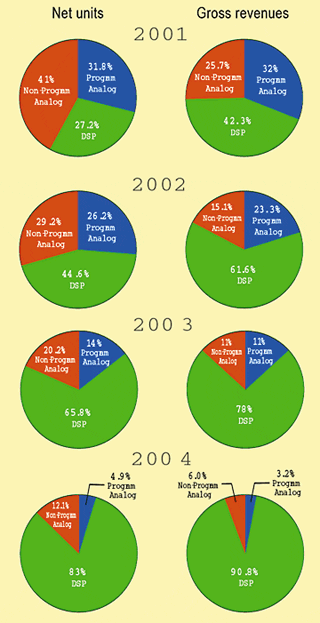
Digital hearing aids now constitute 83.02% of the hearing instrument market (Figure 3), after making up two-thirds of the market (66%) in 2003, and less than half of the market (45%) in 2002.
Figure 3. US net unit hearing instrument sales by technology type: digital (DSP), programmable analog, and non-programmable analog instruments. In 2004, digital hearing aid sales grew to make up 83% of the market. Programmable sales have been virtually replaced by DSP, shrinking from nearly one-third (32%) of the market in 2001 to only 5% of the market in 2004. Likewise, about 1 in 8 hearing aids dispensed during 2004 were of the traditional analog non-programmable type, compared to 1 in 2 during Y2000. Source: HIA and HR.
The dominance of DSP technology is making the prognosticators of the mid-90s, who predicted that programmable aids could be seen as a “transitional technology,” look prescient. These industry observers contended that analog programmable technology would allow for the widespread use of wide dynamic range compression and more precise prescriptive targets, but the technology would eventually give way to DSP. Little did anyone know how soon this would happen. In 2004, less than 106,000 hearing aids dispensed—or about 5%— were of the analog programmable technology, after they constituted nearly one-third (32%) of the market only 3 years ago.
Analog nonprogrammable hearing instruments made up 12.05% of the market in 2004, down from 20.21% in 2003. However, it was only 7 years ago that 75% of all hearing aids dispensed were non-programmable analog.
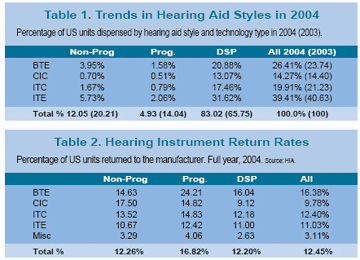
Hearing aid styles. One look at Table 1 reinforces how dominating DSP aids are in the hearing health care marketplace. Close to one-third (31.62%) of the hearing aids dispensed in 2004 were digital ITEs, one-third were either digital ITCs (17.46%) or CICs (17.46%), and one-fifth (20.88%) were digital BTEs.
Analog nonprogrammable ITEs (5.73% of the market) and BTEs (3.95%) made up the lion’s share of the analog categories. Analog programmable BTEs and ITEs constituted only 1.58% and 2.06% of the market respectively. The trend toward DSP has had the most notable negative impacted on the analog ITC and CIC categories—a tiny 3.67% of these hearing aids are either analog nonprogrammable or analog programmable.
HIA statistics do not track directional hearing aids; however, HR estimates that about 41% of all aids dispensed in 2004 contained some kind of directional system.
Returns Continue to Fall to Historically Low Levels
Hearing instrument return rates in 2004 continued to be low compared to recent industry historical statistics. Until 2 years ago, return for credit rates hovered between 17-18% for more than a decade—and often 20% for more advanced hearing aids. But, in the fourth quarter of 2003, return for credits were 13.67%, and during the fourth quarter of 2004 they fell further to 12.40%. Likewise, for the total year, the companies submitting HIA return for credit statistics in the various technology and style categories reported a return for credit rate of 12.45%.
Programmable hearing instruments had the highest return rates (16.82%), while nonprogrammable analog instruments and digital instruments had roughly the same rates of return (12.26% and 12.20% respectively). Surprisingly, among the major hearing instrument styles, CICs enjoyed the lowest rate of return (9.78%), followed by ITEs and ITCs which had roughly the same rates of return (11.03% and 12.40% respectively).
Interestingly, the highest return rate among the various styles in 2004 was the BTE (16.38%), perhaps due to patients who first choose this style for directionality and performance issues but later reconsider on the basis of cosmetics. The return rate may also be the result of greater contributions from third-party payers. Peterson & Bell4 have shown that insured individuals are 5.4 times less likely to return their hearing aids.
Higher rates of return for BTEs and programmable aids may also relate to a more experienced clientele. As discussed later in this article, the average hearing instrument consumer (57% of all purchasers in 2004) is an individual who is coming back to upgrade their older hearing aids.2 It’s possible that many of these consumers initially request their “old style” of hearing aid then reject it for newer technology. It’s also possible that many experienced users are more interested in trying new, cutting-edge technology—particularly larger hearing aid styles that afford enhanced features like directional microphones, volume controls, etc. However, Kochkin5 has shown that this can be dicey; in general, when consumers are knowledgeable about smaller hearing instrument styles (eg, CICs and ITCs), some will inevitably view the final BTE recommendation as if you’re proposing to jam a Cadillac in their ear. Additionally, experienced users often need to experiment more than first-time users. Indeed, Bell & Peterson4 state that CICs have higher rates of return for all users, while BTEs suffer from a higher rate of return particularly for experienced users.
Finally, the reason for reduced return rates may be the Occam’s Razor (and most encouraging) solution: better educated and skilled personnel who are using better-fitting and better-performing digital aids. For 8 years, Pirzanski6 and others have promulgated the use of open-jaw impressions with higher viscosity materials that detail the second bend of the ear canal. Likewise, computer-aided fitting software and their implementation by dispensing professionals have improved incrementally over the past 15 years. The concepts behind digital aids are far less foreign than they were upon their introduction 9 years ago. Many hearing care professionals now talk with the same ease about compression kneepoints, attack/release times, and other advanced hearing aid features as devoted baseball fans talk about the double-switch and suicide squeeze. Similarly, first-fit programs and the continued development, use, and verification of nonlinear fitting rationales (eg, NAL-NL1, DSL[i/o], FIG6, etc)—though certainly not a panacea or replacement for audiological fine-tuning—do a much better job at approaching final targets, staying within threshold and UCL, and taking full advantage of the dynamic range of patients.
Whatever the reason for the precipitous drop in return for credit rates, it comes as terrific news for the industry and consumers. As Sweetow et al.7 point out, the amount of time a clinician spends on those patients who keep versus those who return their hearing aids is essentially the same. Therefore, there is no such thing as a “free hearing aid”; someone ultimately pays for the products and services. As Sweetow and his colleagues say, “patients keeping their hearing aids are subsidizing the patients who either return or exchange devices.”7
If the return for credit rate has indeed fallen permanently from the historic levels of 18-20% to the current 12-14% level that was achieved in 2003-2004, it represents exceptional savings in time and costs at all levels—manufacturing, dispensing, and most importantly, in patients’ time, money spent, and convenience (if not satisfaction).
Revenues and Hearing Aid Pricing
Given their more expensive price and the fact that digital hearing aids now constitute 83% of the market, it shouldn’t surprise anyone that they account for a disproportionate share of the gross revenues for the average dispensing office/practice. In 2004, 90.8% of a typical dispensing office’s gross revenues came from the sales and services related to the dispensing of digital devices, while only 6.0% and 3.2% came from non-programmable analog and programmable devices, respectively (Figure 4). This compares to roughly equal shares of gross revenues for the same product categories (42% digital, 32% programmable analog, and 26% linear analog) in 2001.
Figure 4. A 5-year history of hearing instrument unit volume sales by technology type (left hand pie charts) versus estimated gross revenue generated by these hearing aids at the retail dispensing level (right hand pie charts). In 2000, DSP aids made up 20% of an average office/practice’s unit volume and 32% of its gross revenues. By 2004, digital dominates in units and in revenues accounting for 83% of all the aids dispensed and 91% of all revenue at the retail level. Source: HIA and HR estimates.
Clearly, a sea-change has occurred in the last 4 years. When comparing the above revenue statistics with those reported in the HR dispenser survey,2 gross revenues from nonprogrammable analog aids (3.2%) are now less than the gross revenues from batteries (4%) and about equal to the proceeds from the sales of earplugs and hearing protection devices (3%). Similarly, in the average dispensing office, gross revenues realized from non-programmable analog aids (and related services) fall just short of gross revenues realized for repairs and servicing of hearing aids (8%).
Although digital aids have been offered at higher prices than their analog counterparts, this too is changing. The HR Dispenser Survey2 suggests that the overall price of DSP aids stayed the same from 2002 to 2003 ($2159 and $2158 respectively), and the average price for all hearing aid styles and technologies (including premium, mid-level, and economy digital pricing) in 2003 was $1794.
For the past several years, HR has ventured estimates of average sales prices and the retail dollar value of the the US hearing instrument market based on HIA statistics from the manufacturers1 and on hearing aid prices reported in the HR Dispenser Survey.2 However, this was much more difficult to do in 2004. As one example, in the 2004 HR Dispenser Survey, hearing instrument specialists and dispensing audiologists reported that 35% of the digital hearing aids they dispensed were in the premium DSP pricing segment (from a low of $2645 to a high of $3044), 42% in the mid-level DSP ($1907-$2488), and 23% in the economy-priced DSP devices ($1302-$1940). However, in speaking with a number of industry leaders, this estimate appears to be biased toward the premium lines—or at least, many expect that the 2005 Dispenser Survey will show a migration toward the economy-level segment. Further, with the market changing as rapidly as it has, exact product mix in the digital segment is more likely to be a moving target.
When the above 2003 pricing and product-mix figures are weighted to the 2004 HIA dispensing figures, one comes up with an average hearing instrument price of $1962. This would represent an increase in average sale price (ASP) of $168 (or a 9.36% increase in gross revenues at the dispensing level). It should be remembered that this increase has nothing to do with an actual increase in hearing aid prices (indeed, the calculation assumes that 2004 prices are identical to 2003). However, due to the large movement toward digital products—from 66% of the market in 2003 to 83% in 2004—and the higher cost of digital products, the ASP increased significantly. Adjusting the DSP product mix to a level that more likely corresponds with current sales (eg, 15%-20% premium DSP, and even distribution between mid- and economy DSP lines) yields an average price between $1765-$1803, a value that is -1.6% to 0.50% compared to last year’s average price of $1794.
Using the aforementioned prices and DSP product mix published in last year’s Dispenser Survey and HIA statistics, the US retail market value of hearing aids would total $3.71 billion, or a 16.7% over last year’s $3.18 billion—an unlikely high number. Again, adjusting the DSP product mix to a level that more likely corresponds with current sales (eg, 15%-20% premium DSP, and even distribution between mid- and economy DSP lines, as above) results in a $3.35-$3.42 billion US hearing instrument market, or a 5.34%-7.55% increase. (Editor’s note: Estimates by HR of average retail gross revenues are derived by applying the average price of each instrument type as reported in the annual HR Dispenser Survey and extrapolating them to HIA sales statistics for those instruments. It is important to note that considerable variations may exist in these estimations due to the predominant practice of “bundling” testing and service fees within hearing instrument prices (ie, in the annual HR Dispenser Survey, prices for both instruments and services are usually reported as the “hearing instrument price”). Additionally, third-party discounts, leasing programs, and free-hearing aids may significantly affect retail values. Thus, the retail dollar values are offered here only as a useful gauge for the actual dollar volume of the US market.)
State by State Dispensing Activity
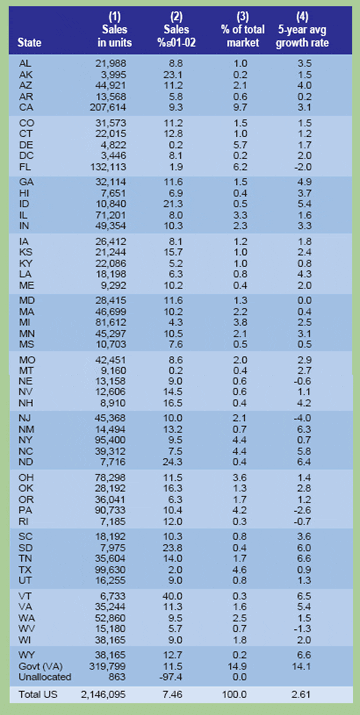
A look at state-by-state dispensing activity in 2004 reveals exceptional growth for most states, and for the first time in many years, no state experienced a decline in hearing instrument unit volume (Table 3). Major dispensing states experiencing sizable unit volume gains during 2004 included California (9.3%), Illinois (8.0%), New Jersey (10.0%), New York (9.5%), Ohio (11.5%), Pennsylvania (10.4%), and Washington state (9.5%). Three larger states that frequently influence hearing industry statistics witnessed smaller gains: Florida (1.9%), Texas (2.0%), and Michigan (4.3%).
Table 3. State by State Dispensing in 2004
The following are state-by-state statistics on: 1) the number of net hearing aid units sold in the state; 2) the percentage change in units sold during 2004 relative to 2003; and 3) the percentage of the total US hearing aid market that the state represented in 2004; 4) the average yearly growth rate of the state from 2000-2004. Source: HIA
Table 3 also presents statistics on the average 5-year unit volume increase/decrease (2000-2004) for each state, as well as the Department of Veterans Affairs. The fastest-growing states during the last 3 years have been in the South and Southeast (Texas 6.6% average yearly growth; Louisiana 4.3%; Tennessee 6.6%, North Carolina 5.8%; and Georgia 4.9%). Others with robust 5-year average unit volume growth rates are the relatively small states of New Mexico (6.3%), North Dakota (6.4%), and Vermont (6.5%). VA sales grew by a yearly average of 14.1% from 2000-2004.
What’s Fueling the Growth?
So why did the market during the last half of 2003 come out of 4 years of flat sales and continue to gain momentum through 2004? Here are some guesses:
Digital product segmentation and pricing options. The influence of DSP instruments on hearing care practices is unmistakable. Digital aids went from a few percentage points in market share during 1996 and 1997 to a commanding share of the market (45%) by 2001 (Figure 2).
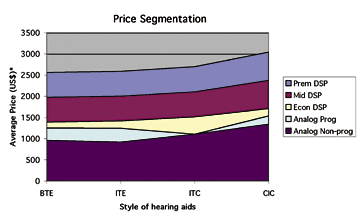
However, in the early years of digital products, little product differentiation existed—they were all classified, by default, as “premium” digital aids and most offered similar features. Today, it’s a radically different story. Figure 5 shows the average price ranges for the three major hearing instrument technology classes, along with premium, mid-level, and economy digital prices. Today’s digital market has far more choices in terms of price, product features, special applications (eg, power, pediatric, directinal, etc), and what the manufacturers are touting as the main advantage of their systems. Additionally, as demonstrated in Figure 5, there is a fairly clear “good, better, best” system of high-quality Class D analog aids (sometimes with nonlinear comfort circuits at a value-added price), analog programmable aids, and digital aids, respectively.
Figure 5. Average price of hearing aids in late 2003 by technology type and style of hearing aid (BTE, ITE, canal, and CIC). Average prices offered by all dispensers for analog non-programmable aids ranged from $916-$1339, analog programmable from $1157-$1603, and digital from $1302-$3040, with ITEs and BTEs generally being the least expensive, and ITCs and CICs commanding greater prices due to the fitting/servicing issues surrounding them. Although price segmentation between the premium, mid and economy level DSP categories are probably not as clear-cut as shown here, it’s likely that dispensing professionals have benefitted from a distinct good (ie, quality analog non-programmable aids with or without comfort circuits), better (programmable analog), and best (digital) system of technology offerings. One can also see in this graph how the programmable analog segment is getting “squeezed” severely by the analog and DSP segments. *Note: Prices include, for the most part, audiological testing, fitting, and service fees. Source: HR 2004 Dispenser Survey.
With an 83% market share in 2004, digital aids are essentially taking over the market, and at the same time, a “good, better, best” system is evolving within digital. Kothe8 describes a categorization approach for explaining four progressive levels of digital technology: 1) basic digital functionality and directional hearing; 2) flexible digital solutions with AGC and finetuning fitting adjustments; 3) intelligent digital features that are often “ex-premium” features; and 4) state-of-the-art premium digital products that offer intelligent and adaptive features, as well as the latest in sound processing and directional technology.
It should also be remembered that, following the introduction of digital instruments in 1996, there was an inevitable adjustment period in which dispensing professionals labored to learn how to fit the new aids and how to integrate them into their existing product lines. Return rates soared into the high-20% region for some models of DSP aids in the late 1990s. With the higher prices of DSP aids also came greater profit margins, and some experts in the industry have maintained that these factors led to fewer units being dispensed. With the advent of mid-level and economy DSP lines, it may be that dispensing professionals are being motivated to market their products more aggressively to make up for the relatively stagnant or even decreasing average sales prices.
Binaural fittings. Much of the robust hearing instrument unit volume growth that occurred in the early 1990s (Figure 1) can be attributed to the increased popularity of binaural fittings. In 1983, binaural fittings constituted only 27% of all patient fittings. But, by 1992, they made up 55% of all fittings, and then hovered between 68%-72% from 1998-2001. However, in the last two HR Dispenser Surveys, the incidence of binaural fittings has jumped 5-6 percentage points to 77%-78%. The binaural fitting rate is reaching a saturation rate (probably somewhere between 80-85%). MarkeTrak VI9 reports that the binaural purchase rate in 2000 among bilateral loss consumers was 84.5%, and 74.2% among all hearing aid users.
Directional hearing systems and new technologies. Thirty-six percent of all the hearing aids dispensed in late 2003 accommodated directional technology, according to the HR 2004 Dispenser Survey.2 Virtually every new digital hearing instrument launched in 2004 contained some type of directional hearing system.
In the 3 years from 2001-2003, dispensing audiologists have embraced directional microphone technology, using it in nearly half (47%) of the hearing aids they dispense.2 This is remarkable considering that 41% of the aids dispensed by audiologists are of the ITE and CIC styles—hearing aids that are not physically conducive to directional technology due to size/faceplate restrictions. Unfortunately, utilization of directional technology by hearing instrument specialists has remained flat at 17% during this same 3-year period.
This increased use of directional systems is clearly good news for the hearing industry, as numerous studies have demonstrated that directional microphones remain the best way to increase the signal-to-noise ratio and help hearing aid users hear better in noisy environments. Kochkin has shown repeatedly that improving performance of hearing aids in multiple environments is one of the keys to expanding market penetration.
But directional technology is far from the only new technology trend. Open fitting systems have been incorporated into many new product lines, and these aids may be excellent for addressing side effects like occlusion. Similarly, new hearing aid styles like the Sebotek PAC and Vivatone, as well as various fitting tips and sleeves, are designed to offer same-day wearing for consumers. Additionally, many new product launches are directed at mild-to-moderate, younger hearing aid users.
Hopefully, the new technology will serve the dual purpose of: 1) further improving hearing instrument performance while widening consumer options, and 2) creating excitement in the market, increasing the percentage of first-time hearing aid purchasers. From 2000-2003, the percentage of first-time users of hearing aids has been stuck between 41%-45%.2
Demographics. Although there have been countless articles about the coming Baby Boomer population needing hearing aids, there is evidence that the industry has suffered from a recent demographic hiccup. The population between ages 65-74—a key demographic for the hearing industry—has actually been in decline during the last several years and reaches its nadir in 2005.10 The population increases sharply thereafter. Kochkin’s MarkeTrak VI9 shows that the average first-time buyer is 68.8 years old; thus, a decrease in population for this age group could very well lead to poorer sales and a reduction of first-time purchasers. Conversely, it stands to reason that an increase in this demographic could significantly boost sales and market penetration rates.
| HR Headlines: Top News Stories of 2004 |
|
| January • BHI Hires Kochkin as its New Executive Director (p 10) • Cell Phone Industry Challenges FCC’s Lifting of Exemption (p 10) • ICS Medical Co-Founder Retires; Gn Otometrics Announces Plans (p 10) • A Bug for New Microphones (p 66) • Amplifon Continues Aggressive Acquisition Strategy in Europe (p 67) • HEI Receives Over $8 MM in Hearing Research Grants (p 67) • DRF to Form Hearing Health Advisory Board (p 67) February March April May June |
July • William Demant Holding Celebrates Centennial (p 10) • ATA Announces Tinnitus Assistance Fund (p 10) • Starkey Labs Awarded Best DesiGn Paper at 2004 DVCon (p 10) • Makeover Leads to Big Things for Hearing Aid User (p 10) • Lexis Honored with ID Magazine Award (p 54) • State Legislation on Hearing Aids Moves Forward (p 55) August September October November December |
Karl Strom is editor-in-chief of HR. Correspondence can be addressed to Karl Strom; email: [email protected].
References
1. Hearing Industries Assn. HIA Statistical Reporting Program, Fourth Quarter 2004. Alexandria, Va; February 2005.
2. Strom KE. HR 2004 dispenser survey. Hearing Review. 2004;11(6):14-32,58-59.
3. Beck L. Presentation to the Hearing Industries Assn Meeting; February 2004; Las Vegas.
4. Peterson ME, Bell TS. Factors influencing hearing aid return and exchange rates. Hearing Review. 2004;11(1):12-22.
5. Kochkin S. MarkeTrak V: Consumer satisfaction revisited. Hear Jour. 2000;53(1):38-55.
6. Pirzanski C, Berge B. Earmold impressions: Does it matter how they are taken? Hearing Review. 2003;10(3):18-20,80.
7. Sweetow RW, Bratt LA, Miller M, Henderson-Sabes J. A time-cost analysis with patients who purchase, return, and exchange hearing aids. Hearing Review. 2004;11(1):26-30.
8. Kothe J. Helping consumers choose from a range of digital technologies and prices. Hearing Review. 2004;11(7):40-43.
9. Kochkin S: MarkeTrak VI: The VA and direct mail sales spark growth in hearing aid market. Hearing Review. 2001;8(12):16-24,63-65.
10. Clemons M, Sorensen TW. Hearing aid industry in best shape ever. Copenhagen: Carnegie Research; October 2003.


