Tech Topic | June 2019 Hearing Review
How do hearing aid features such as compression, noise reduction, and directional microphones affect the amplitude of the temporal envelope in the processed sound? Here is a new hearing aid pre-selection tool for clinicians.
In a previous paper, we reviewed the importance of the temporal envelope on speech perception.1 It is suggested that the deliberate alteration of the incoming speech sounds by hearing aids to optimize audibility and/or signal-to-noise ratio (SNR) can inadvertently alter their temporal characteristics to create suboptimal listening for some listeners. This could be especially problematic for listeners with a greater degree of hearing loss or a reduced working memory capacity.2 Thus, the goal in hearing aid fitting should not only be optimizing for audibility and/or SNR, but also to achieve such objectives with minimal distortion (or even enhancement) of the temporal envelope.
In this paper, we propose measuring the Modulation Spectrum across Octave Frequencies (MSaOF) as a means to study the temporal characteristics of audio signals. Using the Widex EVOKE hearing aid as an example, we examine how signal processing features—including compression, noise reduction, and the directional microphones—may separately and in concert affect the temporal envelope of speech.
Quantifying the Changes in the Temporal Envelope
Most clinicians who dispense hearing aids are familiar with the measurement of attack and release times of a hearing aid (eg, ANSI 3.22-2014).3 While this measure is useful for quality control purpose, it does not provide any information on how the hearing aid may alter the temporal envelope. Unfortunately, such information is often not reported. Considering the importance of the temporal envelope of speech, a standard objective measure using natural speech as a test signal is needed to evaluate the combined effects of processing on its envelope.
A number of methods have been suggested to study the changes in the temporal envelope of speech from signal processing. For example, the Envelope Difference Index (EDI)4 quantifies the amplitude change in the temporal envelope between the processed and unprocessed signals as the mean absolute difference in envelope amplitude between the two signals. A greater difference is often interpreted as greater distortion of the temporal envelope. However, the EDI does not consider the rate of change in the envelope, therefore setting no particular emphasis on rates that are known to be important for speech perception. Furthermore, the EDI requires sample-by-sample alignment across measurements, which can lead to measurement errors when misalignment occurs.
The Consonant-Vowel-Ratio (CVR) measurement5,6 quantifies changes in the envelope contrasts between consonants and vowels. It is calculated as the dB-difference between the average root-mean-square of the consonant and vowel portions of the speech signal. The CVR measure requires careful determination of phoneme boundaries, thus making it a labor-intensive measure.
We propose measuring the MSaOF of the audio signals as an objective means of characterizing their temporal envelopes. To review, the modulation spectrum describes the level of envelope fluctuation (or modulation depths) across different modulation frequencies. The modulation frequency describes the rate at which the amplitude envelope fluctuates over time. Modulation frequencies between 2-50 Hz convey information on consonant manner, voicing, vowel identity, and prosodic cues such as tempo and rhythm.7 Typically, human listeners are most sensitive to sounds where the envelope changes (ie, modulation frequency) at a rate between 0.1-40 Hz.8 Interestingly, our peak sensitivity occurs around 2-6 Hz, which is close to the syllable rate for natural speech.
Modulation depth, or its normalized version modulation index (MI), is the amount (or magnitude) of change in the amplitude envelope. A modulation index of “0” is used to describe an unmodulated signal, and a modulation index of “1” is used to describe a sinusoid that is completely (100%) modulated. Figure 1 is an example of a 100 Hz sinusoid at a modulation frequency of 2 Hz with three modulation indices: 0.2, 0.6, and 1.0. It is obvious that a larger modulation index is associated with a greater difference between the peaks and valleys of the waveform.
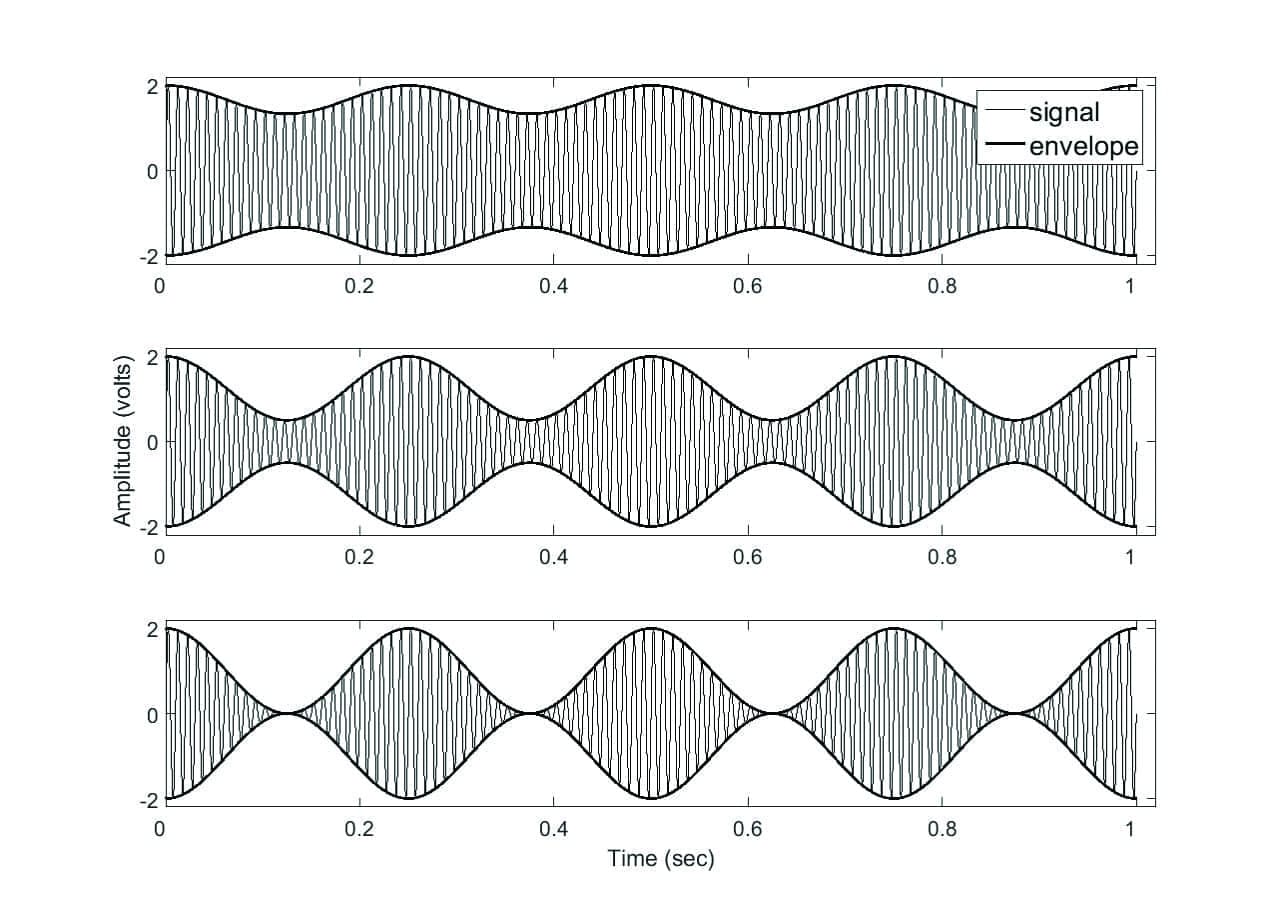
Figure 1. Example of modulation indices for a 100 Hz sinusoidal carrier modulated at a frequency of 2 Hz. The modulation index (MI) is 0.2 for the top panel, 0.6 for the center panel, and 1.0 for the bottom panel. The greater the modulation index, the greater difference there is between waveform peaks and valleys.
The modulation spectrum offers a number of advantages over other measures that attempt to characterize the temporal envelope and/or how it may change due to processing:
1) It uses natural speech and noise signals as inputs, thus allowing realistic evaluation of the features in the hearing aid.
2) The measurement can be conducted across different input levels and SNRs. This provides a more comprehensive overview of the hearing aid function in different realistic situations.
3) The modulation spectrum measures temporal changes at different modulation rates; one may focus on specific rates that are relevant for speech understanding, and
4) Any modification in the modulation spectrum between the aided and unaided sounds would suggest a change in the dynamic characteristics of the amplitude envelope.
The determination of the MSaOF involves several conceptual steps summarized in Figure 2. In the first step, the audio signal (in this example, a 1-second long audio sample) is divided into one-octave wide audio bands centered at 0.5, 1, 2, and 4 kHz (Figure 2a). In the second step, each octave band of audio signal is analyzed using Hilbert transform to obtain the amplitude envelope of the audio signal (Figure 2b). The envelopes in Figure 2b show fluctuations that occur at various rates and magnitudes. For example, there are 5 to 6 larger peaks in the envelope at the 0.5-1.0 kHz bands (blue and green). This suggests that the primary modulation frequency of the audio signal is 4-6 Hz—the syllabic rate of natural speech. To quantify the rate and amplitude of these fluctuations or peaks in the envelopes, a Fast Fourier Transform (FFT) is applied to the envelope in each audio band to derive modulation spectra at 0.5, 1, 2, and 4 kHz (Figure 2c). Each of the four modulation spectra describes the magnitude of modulation (modulation depth or modulation index) at different modulation rates (frequencies) at that audio octave band. Through this measurement, one can see that the audio signal used in this example has modulation frequencies ranging from 2-16 Hz, with the peak modulation frequency occurring at around 4 Hz. To capture the modulation spectrum across all 4 octave bands, the modulation index (MI) at a modulation frequency of 4 Hz at each octave band is shown in Figure 2d and represents the modulation spectrum across octave frequencies, or the MSaOF.
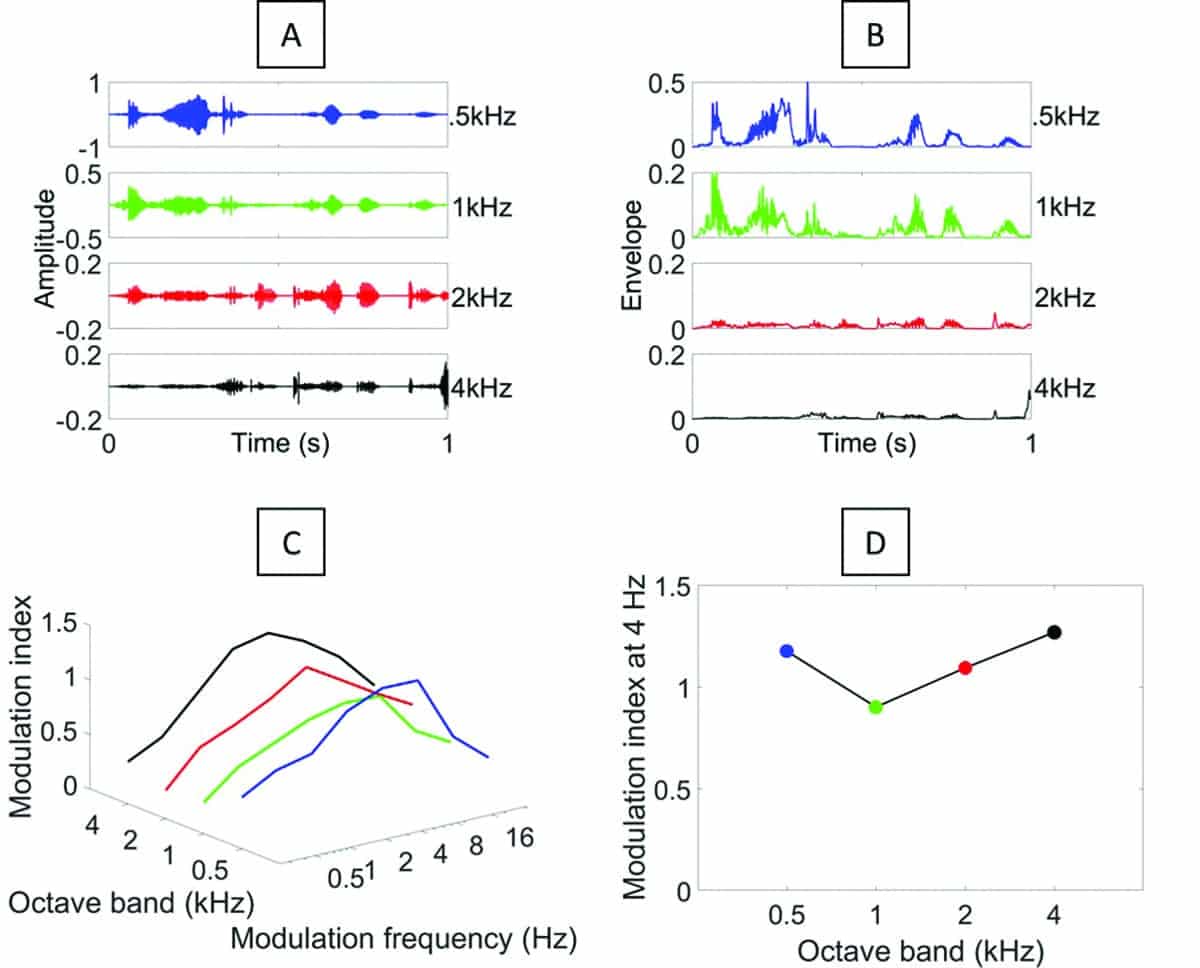
Figure 2. Computation of modulation spectrum across octave frequencies (MSaOF): A) Dividing the original signal into 4 octave bands; B) Hilbert Transform to derive the amplitude envelope at each octave band; C) Fast Fourier Transform analysis of the envelopes to derive modulation spectrum at each octave band; and D) MSaOF or display of MI at the peak modulation frequency of 4 Hz across octave bands.
Effect of Hearing Aid Processing Features on the Temporal Envelope
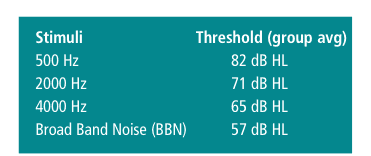
We used the MSaOF analysis to evaluate how different processing features on Widex EVOKE hearing aids, in isolation and combined, affect the temporal envelope of the input speech signal. These measurements were carried out on a KEMAR using fully occluding eartips to minimize any effect of sound leakage. The hearing aids were initially programmed with a sloping N3 standard audiogram (35, 40, 50, and 60 dB HL at 0.5, 1, 2, and 4 kHz respectively)9 using NAL-NL2 fitting formula. For all measurements, the target speech stimulus was the International Speech Test Signal10 presented from 0°, and continuous ICRA-noise or 8-talker babble noise from 0° or 180° at various SNRs. The specific levels and SNRs are listed along with the description of each measurement.
Effect of noise. Figure 3 shows the effect of continuous speech-shaped noise on the maximum MI (at modulation frequency of 4 Hz) across octave bands in an unaided condition. Speech was presented at 75 dB SPL and noise at levels corresponding to 0 to 20 dB SNR in 5 dB steps. Both speech and noise were presented from 0°.
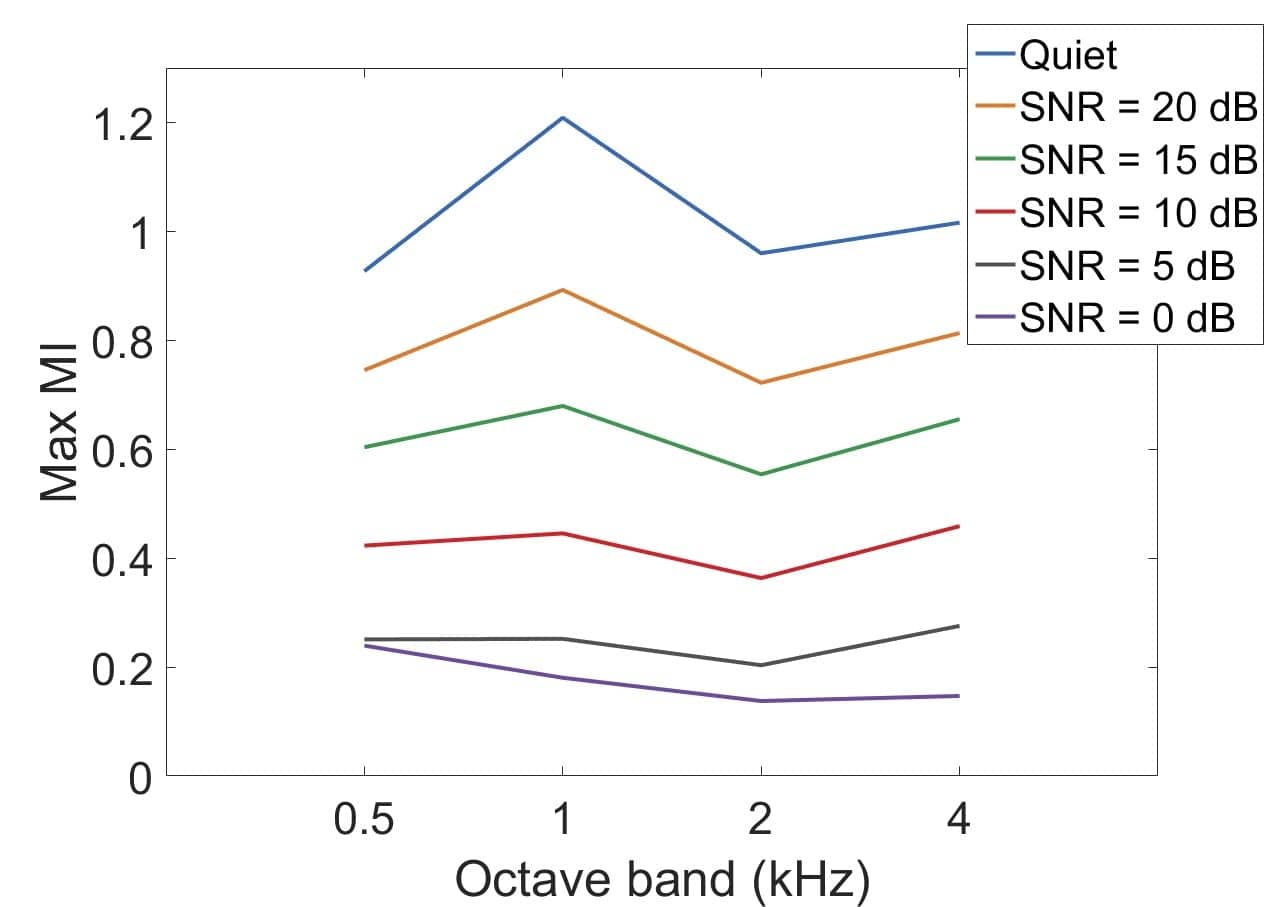
Figure 3. Effect of noise at different SNRs on the modulation index of speech at modulation frequency of 4 Hz (max MI) across octave bands.
Background noise decreases the modulation index, with greater reduction accompanying decreasing SNR. Even a moderate background noise level of 15 dB SNR reduces the MI by as much as 50% compared to the quiet condition. The MI is further reduced by over 80% at 5 and 0 dB SNR. The negative effects of noise on the MI are the greatest at 1 kHz, which is also the frequency region with the highest MI for speech in quiet. The 1 kHz region is important for speech intelligibility. Hence, preservation of all available cues at this region, including the envelope cues, is desirable.
Effect of WDRC. Wide dynamic range compression (WDRC) provides time-varying gain so that more gain is available for the lower input level sounds, while less gain is provided for the higher input level sounds. This changes the intensity relationships between the levels of louder and softer segments of speech and results in a reduction of its temporal envelope. Release-times that are shorter than the natural changes in speech can result in gain changes between syllables. Thus, a short release time reduces the dynamic range of the temporal envelope.5,11,12 A larger compression ratio results in less variation between louder and softer portions of speech, again resulting in a greater distortion of the temporal envelope.
In our measurement, a special version of the EVOKE was set to have either short time constants of 5 ms attack time, 50 ms release time (ie, fast-acting compression) or longer time constants of 12 ms attack time, 1000 ms release time (ie, slow-acting compression). The compression ratios were set to 1.8 or 3.0 across all input levels. A linear mode was also included for comparison.
Figure 4 displays the results when speech was presented at 70 dB SPL from 0° in quiet. One can see that linear processing does not affect the MI, while compression reduces the MI. A greater reduction in the MI is seen with shorter time constants than with longer time constants. Similarly, the higher compression ratio of 3.0 results in a greater reduction in the MI than a lower compression ratio of 1.8.
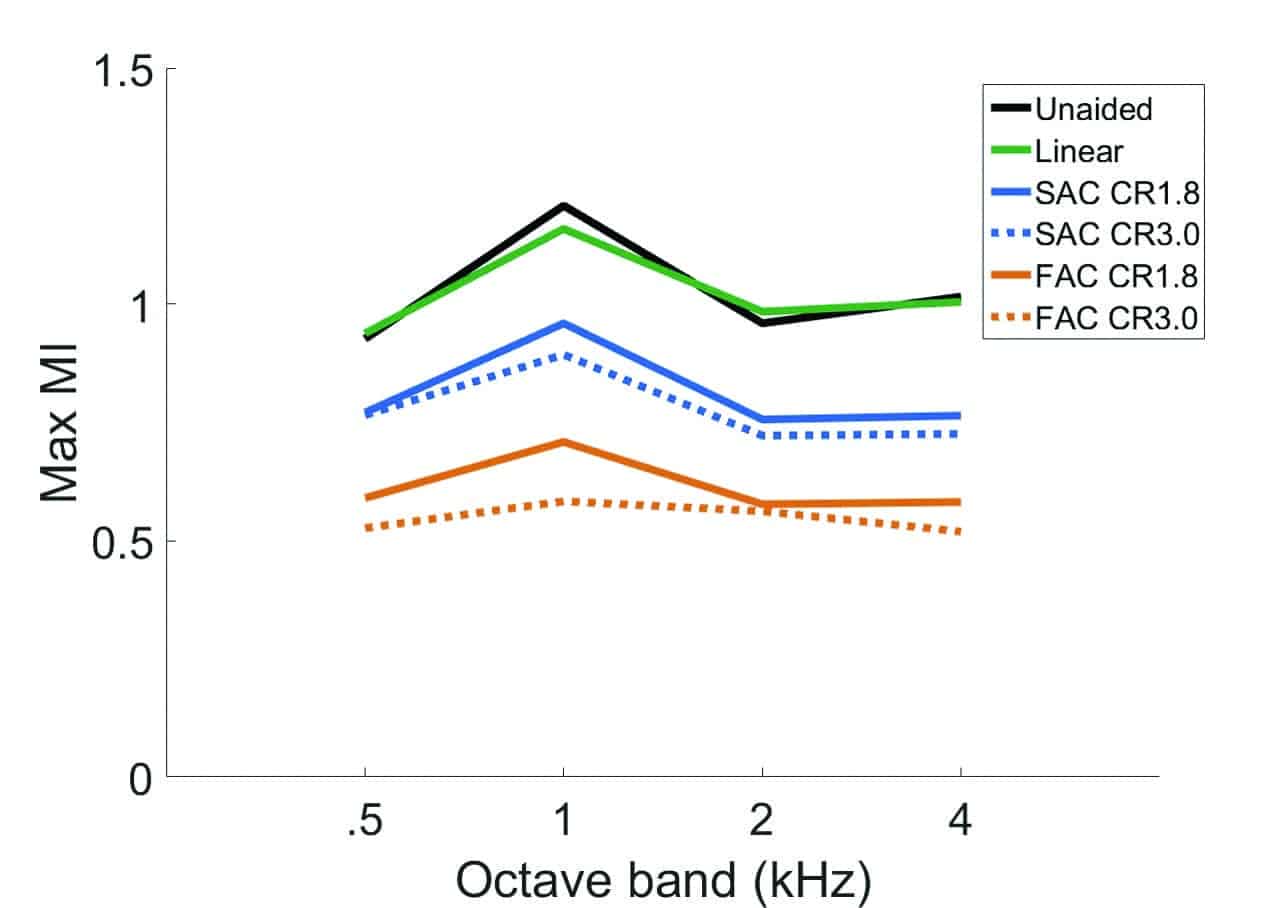
Figure 4. The effect of compression time constants and compression ratio on the modulation index (MI) at 4Hz across octave bands when speech was presented in quiet at 70 SPL input level.
Behaviorally, compression that best preserves the acoustic properties of speech relative to linear processing (while ensuring audibility) yields the best speech perception results.6 On the other hand, compression schemes that use short time constants and high compression ratios are linked to detrimental perceptual consequences.5,6,11,13-17 It could be beneficial to examine if changes in the measured MI correlate with behavioral changes from compression.
Effect of digital noise reduction.Typically, speech is highly modulated while many noises are unmodulated. Digital noise reduction (DNR) algorithms often include a “speech detector” at each frequency channel of a multi-channel hearing aid. The detector determines if the input is “speech” or “non-speech/noise” based on the modulation characteristics of the input signal. Taking advantage of potential spectral separation between speech and noise, the DNR algorithm uses adaptive gain reduction to suppress “noise” signals once they are detected.
Two different types of DNR algorithms on the EVOKE were assessed in the current measurements. The “NR classic” algorithm reduces gain in each noise channel by a maximum of 12 dB depending on the input level, SNR, and frequency importance of the channel (independent of the hearing loss). The “Speech Enhancer” or “NR SE” noise reduction algorithm maximizes the speech intelligibility index (SII)18 in noise. Depending on the measured SII, the NR SE can reduce gain by up to 12 dB within any given channel or increase gain in the mid frequencies by up to 4 dB.
Figure 5 shows the effect of DNR when speech was presented at 75 dB SPL in quiet, and in continuous speech-shaped noise at 5 and 15 dB SNRs. In this measurement, the EVOKE hearing aid was programmed with linear gain to minimize the effects of amplitude compression. No difference between processing conditions is observed in quiet, as these algorithms are not expected to be activated. Although neither DNR algorithm can counteract the general deleterious effects of background noise, both algorithms increase the modulation index over the NR-off condition, with slightly greater preservation seen for the NR SE algorithm. Therefore, listeners have access to more temporal envelope cues when using either of these DNR algorithms. The improvement is evident even at 5 dB SNR where the access to fine structure cues is reduced substantially, which in turn increases the listener’s reliance on temporal envelope cues.
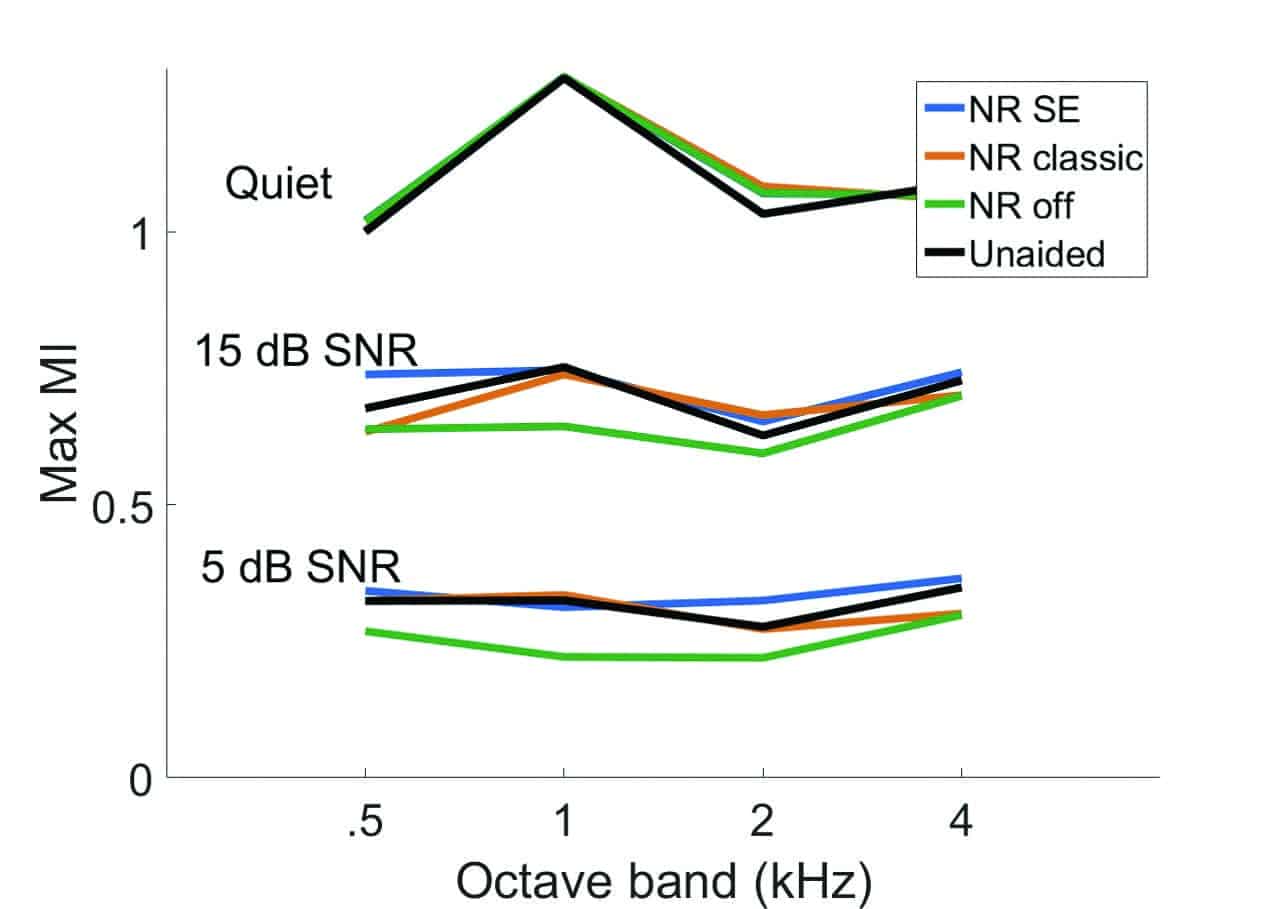
Figure 5. The effect of noise reduction algorithms on MI at modulation frequency of 4 Hz across octave bands when speech was presented at 75 dB SPL in quiet and with continuous noise at 15 and 5 dB SNR.
Effect of microphone directionality. A directional microphone takes advantage of the spatial separation between speech and noise to improve the SNR. When speech originates from the front and noise from the sides or back of the listener, the use of a directional microphone reduces the overall noise level at the hearing aid. This can result in greater spectro-temporal dynamics than with an omnidirectional microphone.
We compared the effects of the omnidirectional and the fixed-directional microphone modes on the EVOKE. All other advanced features were deactivated. Speech was presented from 0° and continuous speech-shaped noise was presented from 0° or 180° azimuth at 5 dB SNR. Figure 6 shows that in the omnidirectional mode, the MI is even lower than in the unaided condition when noise is presented from either the front or the back, especially in the higher frequencies. This is likely due to the absence of the pinna shadow effect. The use of the directional microphone increases the maximum MI at all frequencies when noise originates from 180°, but not when noise originates from the front.
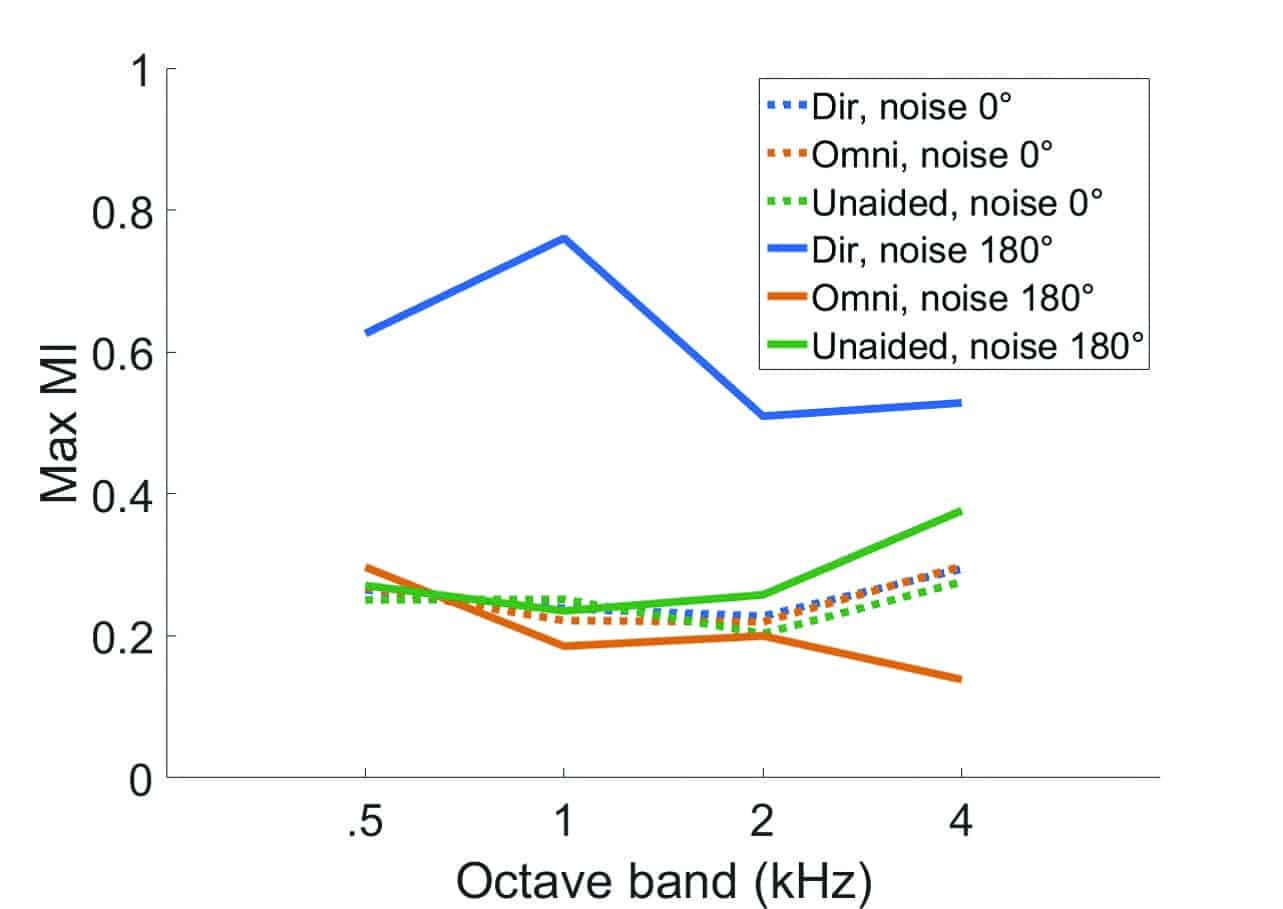
Figure 6. The effect of directional microphone on MI at modulation frequency of 4 Hz across octave bands when speech was presented at 75 dB SPL with continuous noise at 5 dB SNR from 0° and 180°.
Combined effect of all features in the EVOKE default setting. Figure 7a displays the MSaOF for the EVOKE in quiet at their default settings. Speech was presented from 0° azimuth at input levels of 50, 60, 70, and 80 dB SPL. Compared to the unaided modulation index, the EVOKE maintains the MI at conversational levels (60 and 70 dB SPL), and enhances the MI at the loud level of 80 dB SPL. Natural or enhanced temporal envelope cue may be particularly beneficial for individuals who are reliant on those cues. These individuals may include those with poorer cognition, people with auditory neuropathy spectrum disorder (ANSD), or people with a severe degree of hearing loss.1 As we demonstrated earlier, noise reduces the MI. Hence, at the softest input level (50 dB SPL), the inherent noise at the highest frequencies limited the MI slightly.
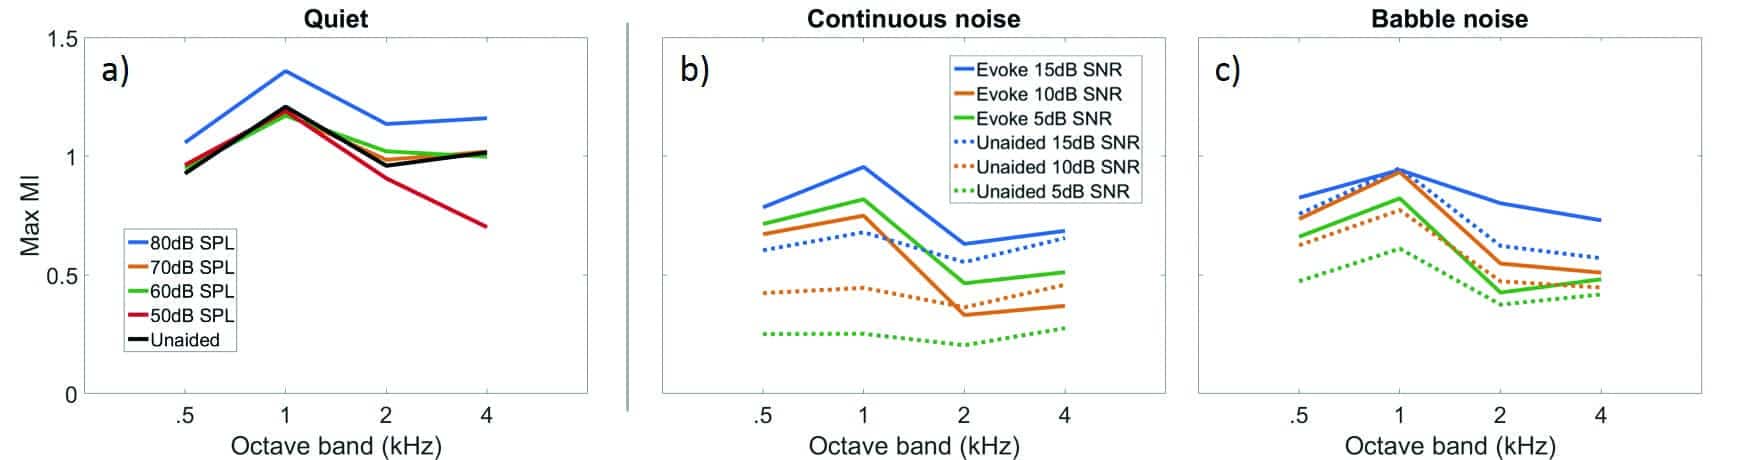
Figure 7. Combined effect of all advanced features for speech in quiet (left), in speech shaped noise (center), and in babble noise (right). Speech from 0°, noise from 180°.
Two noise types—a speech-shaped continuous noise and an 8-talker babble noise, presented from 180° at 5, 10, and 15 dB SNRs relative to speech presented at 75 dB SPL—were used to obtain the data in Figures 7b and 7c. Compared to the unaided signal, the Widex EVOKE increases the MI in all octave bands and at all SNRs compared to unaided condition. This likely results from the action of the HD Locator microphone. The increase in the MI is greater in the continuous noise condition than in the babble noise condition. This may be due to the action of the DNR algorithm, which is more effective in continuous noise than in babble noise. The increase in the MI is greater for both noise types in the lower frequencies than in the higher frequencies.
Looking Forward
The current study proposes measuring the modulation spectrum across octave frequencies (MSaOF) as a means of analyzing and characterizing the temporal envelope of speech. This method allows one to determine if the modulation spectrum of the input sound is preserved or enhanced by specific hearing aid processing. There is support for the need to preserve the modulation spectrum of processed speech. For example, distorting the modulation characteristics of speech in reverberant rooms was demonstrated to degrade speech intelligibility.19Also, distortion in the modulation spectrum is linked to a reduction of speech clarity/quality.20-22 Gallun and Souza23 reported increased confusion between syllables when the modulation spectra of the syllables were similar.
Using the MSaOF method, we examined the effect of hearing aid signal processing algorithms on the modulation indices (MI) of speech at the hearing aid output. We demonstrated that the EVOKE hearing aid preserves or even enhances the modulation indices. This may help explain the exceptional sound quality of this hearing aid.
The proposed MSaOF measurement could complement the standard test-box measurements of the wearers’ hearing aid settings. The measurements can be carried out using ecologically relevant signals, two loudspeakers (front/back), a hearing aid coupler, a microphone, and an audio interface for presentation and recording of the stimuli. The analysis can be carried out using MATLAB computing software. The scripts to conduct the analysis are available from the authors upon request. This method may be used on different hearing aids to examine how each may affect the temporal envelope of a standard speech (and noise) signal.
This tool could be particularly helpful in the pre-selection of hearing aids. Because the proposed MSaOF method can be quantified, one can determine if changes in the temporal envelope of the processed sounds may differentially affect listeners with different temporal processing ability—offering new avenues to further improve hearing aid fittings.

Petri Korhonen, MSc, is Senior Research Scientist, Francis Kuk, PhD, is the Director, and Christopher Slugocki, PhD, is a Research Scientist at the Widex Office of Research in Clinical Amplification (ORCA) in Lisle, Ill.
Correspondence can be addressed to Petri Korhonen at: [email protected]
Citation for this article: Korhonen P, Kuk F, Slugocki C. A method to evaluate the effect of signal processing on the temporal envelope of speech. Hearing Review. 2019;26(6):10-18.
References
-
Kuk F, Korhonen P, Slugocki C. Preserving the temporal envelope in hearing aid processed sounds. Hearing Review. 2018;25(10):40-44.
-
Souza PE, Arehart KH, Shen J, Anderson M, Kates JM. Working memory and intelligibility of hearing-aid processed speech. Front Psychol. 2015;6(526):1-14.
-
Specification of Hearing Aid Characteristics. ANSI/ASI S3.22–2014. American National Standards Institute (ANSI). https://webstore.ansi.org/standards/asa/ansiasas3222014. 2014.
-
Fortune TW, Woodruff BD, Preves DA. A new technique for quantifying temporal envelope contrasts. Ear Hear. 1994;15(1):93-99.
-
Jenstad LM, Souza PE. Quantifying the effect of compression hearing aid release time on speech acoustics and intelligibility. J Sp Lang Hear Res. 2005;48(3):651-667.
-
Hickson L, Thyer N. Acoustic analysis of speech through a hearing aid: Perceptual effects of changes with two-channel compression. J Am Acad Aud. 2003;14(8):414-426.
-
Plomp R. The role of modulation in hearing. In: Klinke R, Hartmann R, eds. Hearing–Physiological Bases and Psychophysics. Berlin, Germany: Springer-Verlag Berlin Heidelberg; 1983:270-276.
-
Rosen S. Temporal information in speech: Acoustic, auditory, and linguistic aspects. Philosophical Transactions: Biological Sciences. 1992;336(1278):367-373.
-
Bisgaard N, Vlaming MSMG, Dahlquist M. Standard audiograms for the IEC 60118-15 measurement procedure. Trends Amplif. 2010;14(2):113-120.
-
Holube I [EHIMA-ISMADHA Working Group]. Short description of the international speech test signal (ISTS). Oldenburg, Germany: Center of Competence HörTech and Institute of Hearing Technology and Audiology;2006.
-
Jenstad LM, Souza PE. Temporal envelope changes of compression and speech rate: Combined effects on recognition for older adults. J Sp Lang Hear Res. 2007;50(5):1123-1138.
-
Souza PE, Jenstad LM, Boike, KT. Measuring the acoustic effects of compression amplification on speech in noise. J Acoust Soc Am. 2006;119(1):41.
-
Stone MA, Moore BCJ. Quantifying the effects of fast-acting compression on the envelope of speech. J Acoust Soc Am. 2007;121(3):1654.
-
Stelmachowicz PG, Kopun J, Mace A, Lewis DE, Nittrouer S. The perception of amplified speech by listeners with hearing loss: Acoustic correlates. J Acoust Soc Am. 1995;98(3):1388.
-
Bor S, Souza P, Wright R. Multichannel compression: Effects of reduced spectral contrast on vowel identification. J Sp Lang Hear Res. 2008;51(5):1315-1327.
-
Schwartz AH, Shinn-Cunningham BG. Effects of dynamic range compression on spatial selective auditory attention in normal-hearing listeners. J Acoust Soc Am. 2013;133(4):2329.
-
Brons I, Houben R, Dreschler WA. Acoustical and perceptual comparison of noise reduction and compression in hearing aids. J Sp Lang Hear Res. 2015;58(4):1363-1376.
-
American National Standards Institute. Methods for Calculation of the Speech Intelligibility Index. ANSI/ASA S3.5-1997 (R2017). https://webstore.ansi.org/standards/asa/ansiasas31997r2017. 1997.
-
Houtgast TH, Steeneken HJM. A review of the MTF concept in room acoustics and its use for estimating speech intelligibility in auditoria. J Acoust Soc Am. 1985;77(3):1069.
-
Payton KL. A method to determine the speech transmission index from speech waveforms. J Acoust Soc Am. 1999;106(6):3637.
-
Huber R, Kollmeier B. PEMO-Q – A new method for objective audio quality assessment using a model of auditory perception. IEEE Trans Aud Sp Lang Proc. 2006;14(6):1902-1911.
-
Grant KW, Elhilali M, Shamma SA, et al. An objective measure for selecting microphone modes in OMNI/DIR hearing aid circuits. Ear Hear. 2008;29(2):199-213.
-
Gallun F, Souza P. Exploring the role of the modulation spectrum in phoneme recognition. Ear Hear. 2008;29(5):800-813