By Sergei Kochkin, PhD
Captioned phones offer a valuable functional solution for about 16 million people
People with hearing loss are at a distinct disadvantage compared to normal-hearing people when communicating on the telephone due to the fact that the telephone signal is weaker than what is found in normal face-to-face communication and the necessary visual cues required for effective communication are not available to the listener.
Executive Summary
Hearing aids may not be effective in helping hard-of-hearing individuals communicate on the telephone for a myriad of reasons. Currently, just more than half of consumers are satisfied with their hearing aids on the phone. In addition, consumers report that hearing aids provide on average only 55% benefit during phone conversation. While consumer satisfaction is related to degree of hearing loss (people with severe hearing loss are least satisfied), benefit would appear to be independent of degree of hearing loss. When queried, approximately 8 out of 10 consumers rate improvements in hearing aid telephone utility as being highly desirable.
While difficulty in hearing on the telephone is linearly related to degree of hearing loss, significant numbers of people with mild, moderate, and severe hearing loss report great difficulty communicating on the phone.
The following study shows that captioned telephones that are customizable to deliver a speech signal based on the unique needs of hard-of-hearing individuals, while quickly displaying the speech in text format, would appear to offer a viable functional solution for close to 16 million Americans with hearing loss.
ALDs and Telephone Technology
Due to technological advancements in recent years, today’s hearing aids do an excellent job of helping people meet many of their communication needs. However, sometimes there are situations where additional assistive listening devices (ALDs) are needed. For example, some hearing aid users may continue to experience difficulty understanding speech in noisy environments, such as in a restaurant, from a distance (eg, places of worship), when watching TV, attending a movie or play, or while listening on the telephone. At bedtime, a person with even a mild-to-moderate hearing loss may not hear the smoke alarm located down the hall given the fact that smoke alarms tend to emit high frequency sounds that are not audible to many people with hearing loss. This same person might miss a doorbell chime while listening to the TV a room away. Further, a child with normal hearing, who suffers from recurrent middle-ear infections or who has a central auditory processing disorder (CAPD), is at a definite educational disadvantage when seated in a typical classroom with poor room acoustics and excessive noise.
An array of technology, collectively known as ALDs, are available to help the hard-of-hearing function in important listening situations as a supplement to hearing aids or in place of hearing aids. This paper focuses on the important role that Captioned Telephone Service plays in assisting hard-of-hearing people to communicate effectively on the telephone.
For many people, listening on the telephone can be a frustrating experience as the signal produced by most telephones is not 100% intelligible. Even people with normal hearing often need to ask for certain names and other information to be spelled out or repeated. People with hearing loss experience even more difficulty for two reasons: 1) Due to the hearing loss, the telephone signal is softer and therefore less intelligible, and 2) Unlike face-to-face communication, there are no visual cues to help with understanding.1
Watching the talker’s face has been shown to improve speech understanding, and many hard-of-hearing individuals rely on these visual cues. When talking on the telephone, critical visual cues, such as eye contact, shifts in gaze, or facial expression to signal the end of an utterance or new conversational turn, are not available. The talker’s face also helps interpret the emotion of the talker and whether they have an intent to ask a question versus making a statement. In fact, seeing a total face while engaged in a conversation has been shown to improve the accuracy of consonant recognition in words.2 In the absence of visual cues, one would expect a diminished ability by hard-of-hearing individuals to communicate effectively on the telephone.
Additionally, some hearing aids may not be compatible with all telephones. This can result in feedback. If telecoils are designed into the hearing aids, they may mitigate problems associated with the use of hearing aids on the telephone. However, not all hearing aids have telecoils, the telecoil may not be activated in the hearing aid, the orientation of the telecoil may not be optimized for telephone usage, and the consumer may forget to turn on the telecoil if it is not automatic.3 The consumer, in fact, may not even be aware their hearing aid contains a telecoil; recent national data demonstrate that only 34% of hearing aid users are aware they have a telecoil in their hearing aid.4

|
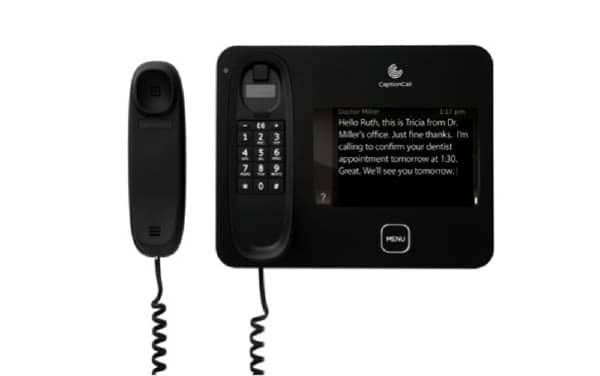
| Figure 1. Example of a Captioned Telephone Service phone with display (courtesy of CaptionCall). |
Reintroducing the Visual Cues into the Phone Conversation
Captioned Telephone Service is available to help hard-of-hearing people function on the telephone. It allows the person with hearing loss to almost simultaneously hear and read the communication from the person they are having a telephone conversation with. The service is free to the hard-of hearing individual through a program that is funded and administered by the FCC. The general features of captioned phones (Figure 1) are as follows:
- It works like a regular phone. The user hears the caller’s voice over a standard phone line.
- The hard-of-hearing person does not have to dial a special number to get captioned service. The phone sends the hearing person’s voice to a communications assistant who converts it into text for the hard-of-hearing user in real time using state-of-the-art voice recognition software.
- The text size is adjustable, which is of particular importance to the elderly, who often experience both visual and auditory loss as they age.
- Audio is customizable to the consumer’s hearing loss.
- The captioning is secure through an encrypted FCC-regulated transcription process.
Study Objectives
- Difficulty. Quantify the difficulty hard-of-hearing individuals have while conversing on the telephone.
- Need. Determine the importance of conversing on the phone compared to 18 other communication situations for people with hearing loss.
- Hearing aid utility on the phone. Document consumer satisfaction ratings with hearing aids on conventional telephones over the last 20 years, and measure subjective benefit with hearing aids on the phone.
- Degree of hearing loss. Demonstrate that Captioned Telephone Service is needed to serve a wide spectrum of hearing losses, not just the profoundly impaired, and not just current hearing aid users.
- Non-users of hearing aids. Demonstrate that current hearing aid utility on the telephone is a significant obstacle to hearing aid purchase for hard-of-hearing people.
Method
The author of this paper developed a tracking survey of the hard-of-hearing population and hearing instrument market in 1988. The survey was administered periodically, with extremely detailed surveys being conducted in 1991, 1994, 1997, 2000, 2004, and 2008. The latter two surveys were conducted while at the Better Hearing Institute (Washington, DC).
The methodology has never varied from the 2008 survey described below. Each survey contained questions designed to track many items longitudinally (eg, telephone satisfaction). Over the 20-year period of this tracking survey, various items were included in each survey to research specific issues about hard-of-hearing consumers or hearing aids. The full body of research emanating from this longitudinal survey currently resides on the Better Hearing Institute website.5
Referring to the most recent survey, in November and December 2008, a short screening survey was mailed to 80,000 members of the National Family Opinion (NFO) panel. The NFO panel consists of households that are balanced to the latest US census information with respect to market size, age of household, size of household, and income within each of the nine census regions, as well as by family versus non-family households, state (with the exception of Hawaii and Alaska), and the nation’s top-25 metropolitan statistical areas. The screening survey included the following items:
- Physician/staff screened for hearing loss during their physical in the last year;
- Whether the household had one or more people “with a hearing difficulty in one or both ears without the use of a hearing aid”;
- Whether the household had one or more people who were the owner of a hearing aid;
- Whether the household had one or more people with tinnitus (ringing in the ears);
- Perceptions of job discrimination in promotions and salary equity;
- Detailed quantification of employment status (beyond simpler NFO panel data); and
- Traffic accidents over the past 5 years and driving habits.
This short screening survey was completed by 46,843 households and helped identify 14,623 people with hearing loss and also provided detailed demographics on those individuals and their households. The response rate to the screening survey was 59%.
In January 2009, an extensive 7-page legal size survey was sent to the total universe of hearing aid owners in the panel database (3,789); 3,174 completed surveys were returned, representing an 84% response rate. In February 2009, an extensive 7-page legal size survey was sent to a random sample of 5,500 people with hearing loss who had not yet adopted hearing aids. The response rate for the non-adopter survey was 79%. Both hearing aid owners and non-adopters were given a $1 incentive to complete and return their surveys.
The data presented in this article refer only to households as defined by the US Bureau of the Census; that is, people living in a single-family home, duplex, apartment, condominium, mobile home, etc. People living in institutions have not been surveyed; these would include residents of nursing homes, retirement homes, mental hospitals, prisons, college dormitories, and the military. The reader should keep in mind that the demographics to follow refer only to those who are aware of and admit to their hearing loss (ie, self-reported hearing loss).
Measuring Hearing Loss
Since hearing aid adoption and communication performance are related to degree of hearing loss, both aided and unaided subjects were asked to complete the following subjective measures of hearing loss. They were then segmented into 1 of 10 groups (called deciles) based on their responses to all five measures of hearing loss:
- Number of ears impaired (1 or 2);
- Score on the Gallaudet Scale.6 An 8-point scale in which the respondent indicated whether they can understand speech under the following conditions: “whisper across a quiet room,” “normal voices across a quiet room,” “shouts across a quiet room,” “loud speech spoken into their better ear,” “not able to understand loud speech in their better ear.” In addition, “tell noises from each other,” “hear loud noises at all,” “hear any sound or any noise.” Individual scores range from 1 to 8. Typically, they are classified into 1 of 5 groups (1-hear whisper, 2-hear normal voice, 3-hear shouts, 4-hear speech in loud ear, 5-can’t hear speech). What makes the Gallaudet Scale of particular value is it has been validated against clinical information (dB loss in better ear). The Gallaudet Scale has historically been used by the Centers for Disease Control and Prevention (CDC) in their quantification of the hard-of-hearing population.
- Subjective hearing loss score. The respondent subjectively evaluated their hearing loss as “mild,” “moderate,” “severe,” or “profound.” This measure is given a score of 1 (mild) to 4 (profound).
- Difficulty hearing in noise. This 5-point scale runs from “extremely difficult” hearing in noise to “not at all difficult” and is based on the work of Plomp.7
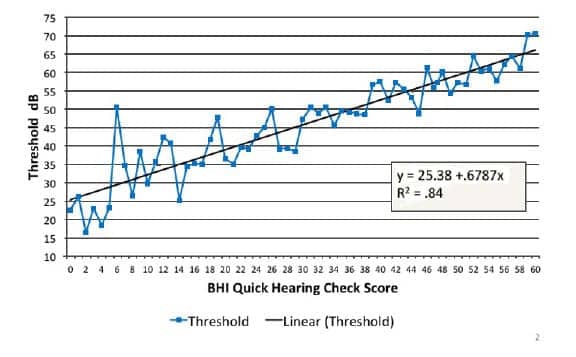
- BHI Quick Hearing Check. This 15-item 5-point Likert scaled hearing loss inventory is based on the revised American Academy of Otolaryngology-Head & Neck Surgery (AAO-HNS) five-minute hearing test8 and has been shown to be correlated with objective measures of hearing loss. In a recent large-scale validation study9 with 11,000 subjects, the scale was shown to have high reliability in 2 studies (.94, .95), to be correlated with objective measures of hearing loss (Figure 2), and to have high subjective validity (related to other measures of hearing loss) and concurrent validity (related to quality of life ratings known to be related to hearing loss such as depression, withdrawal, difficulty in communication, perception of cognitive functioning, self-confidence, emotional stability, etc).
|
| Figure 2. Relationship between the BHI Quick Hearing Check and average threshold scores. Model = 5PTA both ears. |
A factor analysis of the above subjective measures was performed, revealing a single subjective measure of hearing loss. Factor analysis is a method for extracting common variance among multiple variables. A composite hearing loss score was determined by computing factor scores for hearing aid owners and non-adopters. Based on their score, they were placed into 1 of 10 hearing loss groups, where Decile 1 represents the mildest hearing loss (the lower 10% of people with hearing loss) and Decile 10 represents the most serious hearing loss (the top 10% of people with hearing loss). Finally, the data were weighted to reflect hearing aid owners and hard-of-hearing non-owners in the general population. In 2008, the hearing aid owner population was estimated at 8.41 million and the non-owner population 25.84 million for a total of 34.25 million people with self-admitted hearing loss.18
In this paper, hearing loss decile will be used to segment both hearing aid owners and hard-of-hearing non-owners, since in the author’s opinion it is a much more comprehensive indication of degree of hearing loss compared to estimated threshold hearing loss (dB) based on pure-tone averages.
Hearing Loss Demography
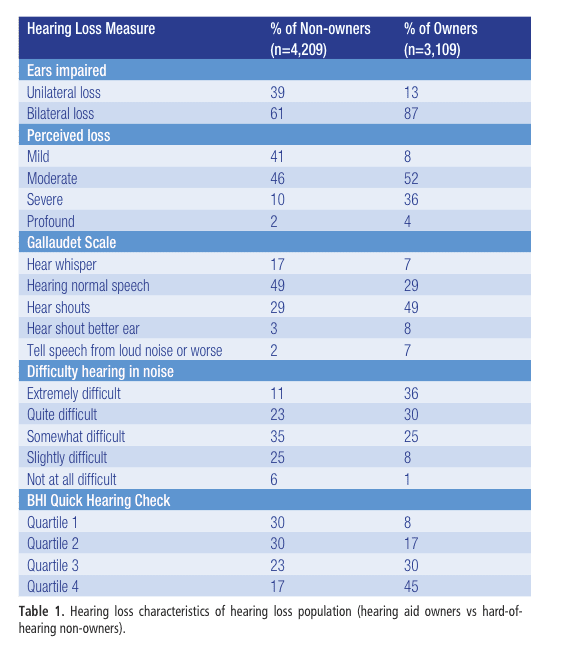
Tables 1-2 document the degree of hearing loss for 3,109 hearing aid owners and 4,209 hard-of-hearing non-owners. Hearing aid owners are more likely to have a bilateral loss (87% versus 61%), to have a perceived loss of severe to profound (40% versus 12%), to have more difficulty hearing normal speech across a room without visual cues (64% versus 34%), more likely (66% versus 34%) to have difficulty hearing in noise (quite difficult to extremely difficult), and more likely to score in the top quartile (75th percentile) of the BHI Quick Check more often (45% versus 17%).
|
|
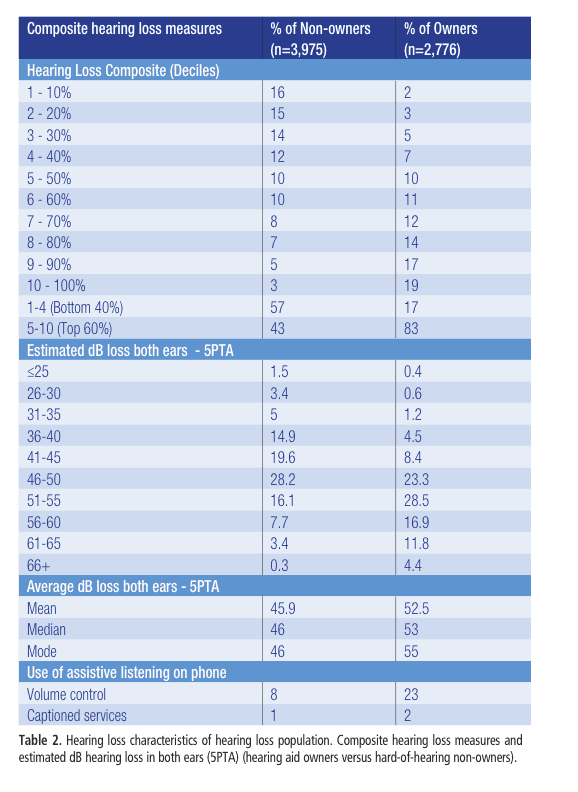
The composite measure of hearing loss broken down into deciles demonstrates that 83% of hearing aid owners are in the top-6 deciles (top 60% of people with hearing loss) compared to 43% for hard-of-hearing non-owners. Hearing aid owners are predicted to have a median threshold (5PTA) in both ears of 53 dB compared to 46 dB for hard-of-hearing non-owners
The minority of phone users report utilizing an amplified telephone (23% hearing aid owners, 8% hard-of-hearing non-owners), while the use of caption services was nearly non-existent in early 2009 (2% hearing aid owners, 1% hard-of-hearing non-owners).
Results
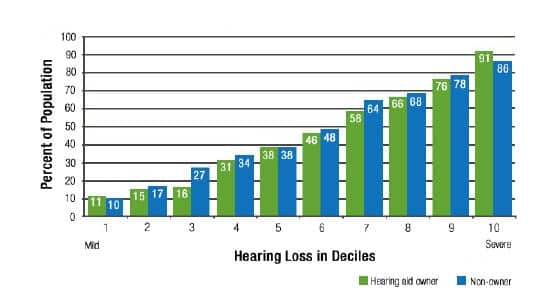
Difficulty conversing on the telephone. The BHI Quick Hearing Check is composed of 15 items. One item asks the person with hearing loss to indicate, on a 5-point Likert scale ranging from “strongly agree” to “strongly disagree,” if they “have problems hearing on the phone.” The percent of hearing aid owners and hard-of-hearing non-owners reporting “agree” or “strongly agree” are plotted in Figure 3.
|
| Figure 3. Reported difficulty hearing on the telephone without the use of hearing aids by hearing loss decile comparing hearing aid owners and hard-of-hearing non-owners. |
Difficulty hearing on the phone is highly related to degree of hearing loss. One out of ten people with a mild hearing loss (Decile 1), four out of ten with a moderate hearing loss (Decile 5), and nine out of ten with a severe hearing loss (Decile 10) report difficulty hearing on the phone without the use of hearing aids.
From this data, we can estimate the market size for assistive help on the telephone by multiplying percent-need by the population size for each decile (3.425 million people with hearing loss):
- Mild hearing loss (Deciles 1-4) = 2.78 million people
- Moderate hearing loss (Deciles 5-7) = 5.12 million people
- Severe hearing loss (Deciles 8-10) = 8.13 million people
- Total (Deciles 1-10) = 16.03 million people
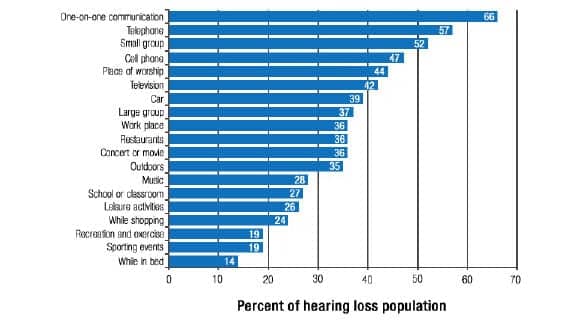
Need/Importance of conversing on the phone compared to other communication situations. Both hearing aid owners and hard-of-hearing non-owners were presented with a list of 19 listening situations and asked to indicate the importance of hearing in that situation using a 4-point scale (“Very important,” “Important,” “Somewhat important,” “Not at all important”). The rank ordering of listening situations for the total hearing loss population (hearing aid owners and hard-of-hearing non-owners) is shown in Figure 4.
|
| Figure 4. Relative importance of hearing in 19 listening situations; importance rated as “very important.” Total hearing loss population (n=7,260) |
Communicating on the telephone was rated the second-highest important listening situation behind one-on-one communication. A total of 57% of people with hearing loss indicated communicating on the telephone was “very important” to them.
Hearing aid utility and satisfaction on the phone (over 20 years) and subjective benefit with hearing aids on phone. The aforementioned consumer surveys measured consumer satisfaction with various hearing aid features, quality of hearing health service, and performance of the hearing aid in 19 listening situations, one of which is on the telephone. For the period 1991-2000, all items were measured on a 5-point Likert scale ranging from “very satisfied” to “very dissatisfied.” The 2004 and 2008 surveys expanded the scale to a 7-point Likert scale, adding “somewhat satisfied” and “somewhat dissatisfied.” Subsequent research has determined that “somewhat satisfied” is close to a “neutral” rating.4 The 20-year customer satisfaction trends (“very satisfied” + “satisfied”)4,10-13 are plotted in Figure 5.

|
| Figure 5. Consumer satisfaction with ability to hear on the telephone while wearing newer hearing aids 1991-2008. Users with hearing aids ? 5 years of age reporting they were “satisfied” or “very satisfied” with their experience. |
Consumer satisfaction with hearing aids on the phone has improved from 37% in 1991 to 55% in 2008 as we moved from analog to digital hearing aids. In a 2000 survey,14 82% of hearing aid consumers indicated that hearing aids that worked better on the telephone were either “desirable” or “very desirable.”
|
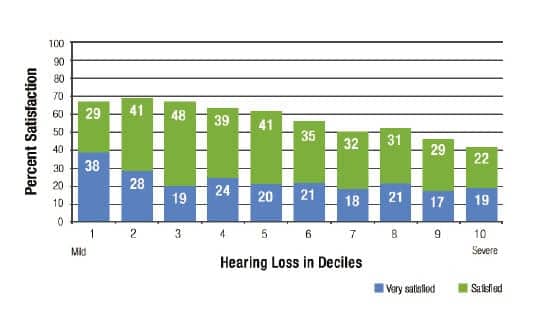
| Figure 6. Consumer satisfaction with ability to hear on the telephone while wearing newer hearing aids by degree of hearing loss measured in deciles. Total hearing aid owner population 2008 (n=2,445) |
|
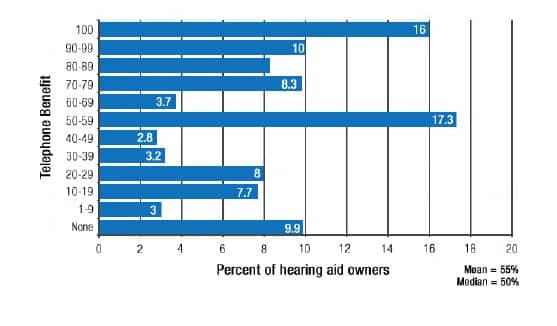
| Figure 7. Distribution of percent improvement (benefit) communicating on the telephone reported due to hearing aid usage. Total hearing aid owner population (n=2,474). |
|
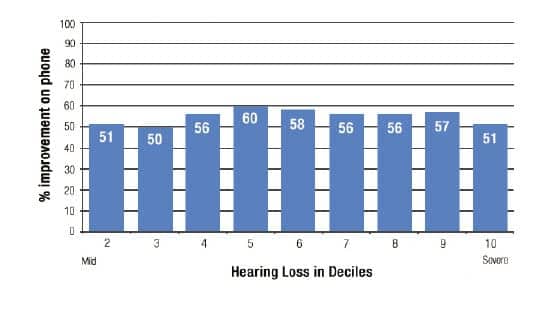
| Figure 8. Average percent improvement (benefit) communicating on the telephone by hearing loss decile reported due to hearing aid usage. Total hearing aid owner population (n=2,474) |
Degree of hearing loss and the utility of Captioned Telephone Service. Let’s now see if the results vary by degree of hearing loss. These results are plotted in Figure 6. For the milder hearing losses (Deciles 1-3) slightly less than 70% are satisfied, 60% with moderate hearing loss (Decile 5), while only 40% of those with the most severe hearing loss (Decile 10) are satisfied.
What about benefit derived from hearing aids in improving speech intelligibility? In our surveys using a 0-100% scale, we simply asked consumers to estimate the percent improvement they experienced specifically due to the use of their hearing aids in 10 listening situations, with one of the listening situations being the telephone. The distribution of achieved telephone benefit is plotted in Figure 7.
Hearing aid owners report hearing aids improved their ability to communicate on the phone by 55% (median 50%). Approximately 1 in 4 people experienced a 90% or higher improvement, while 1 in 10 experienced no benefit.
The results by degree of hearing loss are shown in Figure 8. The range of benefit on the phone is between 50% and 60% improvement due to hearing aids with no discernible benefit trend across hearing loss decile (note the sample size for Decile 1 was too small to include in this chart).
Non-users of hearing aids and the telephone as an obstacle to hearing aid purchase. A number of our national surveys queried hard-of-hearing non-owners on factors that impacted their decision not to purchase hearing aids. A long list of possible factors was presented to the respondent and they were asked to rate if each factor was “not a reason,” “somewhat a reason,” or “definitely a reason” for non-purchase. Regarding hearing aid utility on the telephone, we found the following:
- In our 1991 survey, 15.6% of non-owners (3.1 million people) indicated poor utility on the phone was an obstacle to hearing aid purchase.15
- In our 2004 survey, this obstacle grew to 25% of non-owners (6 million people).16
Would hearing aids that “worked perfectly” on the telephone help expedite demand for hearing aids? In our 2008 survey,17 we evaluated a long list of factors including hearing aid product enhancements and their impact on short-term (ie, the next 2 years) purchase intent. The following hearing loss segments indicated a strong likelihood of purchasing hearing aids if hearing aids “worked perfectly” on the telephone:
- 21% of non-owners with a mild hearing loss (Deciles 1-4);
- 34.2% of non-owners with a moderate to severe hearing loss (Deciles 5-10); and
- 28.2% of total non-owners would have a high likelihood of purchasing hearing aids, representing 7.4 million potential new hearing aid users.
Conclusions
People who are hard-of-hearing are at a distinct disadvantage compared to normal-hearing people when communicating on the telephone. This is due to the fact that the telephone signal is weaker than what is found in normal face-to-face communication and the necessary visual cues necessary for effective communication are not available to the listener.
Longitudinal research has demonstrated that hearing aids may not be effective in helping all hard-of-hearing people communicate on the telephone. Further, this finding appears to be independent of degree of hearing loss. Significant numbers of people with mild, moderate, and severe hearing loss report great difficulty communicating on the phone due to their hearing loss. Captioned telephones that are customizable to deliver a speech signal based on the unique needs of the hard-of-hearing, while quickly displaying the speech in text format, would appear to offer a viable functional solution for close to 16 million Americans with hearing loss.
Acknowledgement
This publication was made possible by a grant from CaptionCall, Salt Lake City, Utah, an FCC-authorized provider of Captioned Telephone Service and manufacturer of the CaptionCall phone. To learn more about CaptionCall, visit www.CaptionCall.com.
|
Sergei Kochkin, PhD, has 25 years’ experience in the hearing healthcare industry as past executive director of the Better Hearing Institute, Washington, DC, and director of market development & market research at Knowles Electronics, Itasca, Ill, a supplier of components to the hearing aid industry. Correspondence to [email protected]. |
References
1. Compton-Conley C. Assistive Listening Devices. Available at: www.betterhearing.org
2. Lansing CR. Visual speech perception in spoken language understanding. In: Montano JJ, Spitzer JB, eds. Adult Audiologic Rehabilitation. San Diego: Plural Publishing; 2009:Chapter 11.
3. Ross M. Telecoils: The powerful assistive listening device. Hearing Review. 2002;9(9):22-36. Available at: /all-news/15582-telecoils-the-powerful-assistive-listening-device
4. Kochkin S. MarkeTrak VIII: Customer satisfaction with hearing aids is slowly increasing. Hear Jour. 2010;63(1):11-19.
5. Better Hearing Institute (BHI). MarkeTrak. Available at: http://www.betterhearing.org/publications/marketrak/index.cfm
6. Schein JD, Gentile A, Haase KW. Development and evaluation of an expanded hearing loss scale questionnaire. National Center for Health Statistics. Vital Health Stat 2. 1970 Apr;(37):1-42.
7. Plomp R. Auditory handicap of hearing impairment and the limited benefit of hearing aids. J Acoust Society Am. 1978;63:533-549.
8. Koike J, Hurst MK, Wetmore SJ. Correlation between the American Academy of Otolaryngology-Head & Neck Surgery (AAO-HNS) five minute hearing test and standard audiological data. Otolaryngol–Head Neck Surg. 1994;111(5):625-632.
9. Kochkin S, Bentler R. The validity and reliability of the BHI Quick Hearing Check. Hearing Review. 2010;17(12):12-28.
10. Kochkin S. MarkeTrak VII: Customer satisfaction with hearing aids in the digital age. Hear Jour. 2005;58(9):30-37
11. Kochkin S. MarkeTrak VI: 10-Year customer satisfaction trends in the US hearing instrument market. Hearing Review. 2002;9(10):14-25,46.
12. Kochkin S. MarkeTrak V: Customer satisfaction revisited. Hear Jour. 2000;53(1):38-55.
13. Kochkin S. MarkeTrak III identifies key factors in determining customer satisfaction. Hear Jour. 1993;45(8):39-44.
14. Kochkin S. MarkeTrak VI: Consumers rate improvements sought in hearing instruments. Hearing Review. 2002;9(11):18-22.
15. Kochkin S. MarkeTrak III: Why 20 million in US don’t use hearing aids for their hearing loss. Hear Jour. 1993;46(1):20-27;46(2):26-31;46(4):36-37.
16. Kochkin S. MarkeTrak VII: Obstacles to adult non-user adoption of hearing aids. Hear Jour. 2007;60(4):27-43.
17. Kochkin S. MarkeTrak VIII: The key influencing factors in hearing aid purchase intent. Hearing Review. 2012;19(3):12-25
18. Kochkin S. MarkeTrak VIII: 25 year trends in the hearing health market. Hearing Review. 2009;16(11):12-31.