Unbundling definitely has its benefits.
By Amyn M. Amlani, PhD
Conventional hearing aid adoption rates in the United States have remained stagnant over the past 25 years, ranging between 20.4% and 24.6%.1 During this period, however, the percentage of devices adopted by first-time users has declined.1 Specifically, hearing aids adopted by first-time users comprised an estimated 53.4% in 1989. Since then, hearing aids adopted by this subpopulation have averaged an estimated 36.0%, ranging between 29.0% in 1994 and 40.5% in 1991. These estimates also suggest that 64.0% of hearing aids purchased in the United States stem from experienced users re-adopting this technology. Interestingly, less than one-half of experienced hearing aid users re-adopt their previous brand.1 The primary reason(s) for these behaviors has yet to be identified, despite decades of research.2
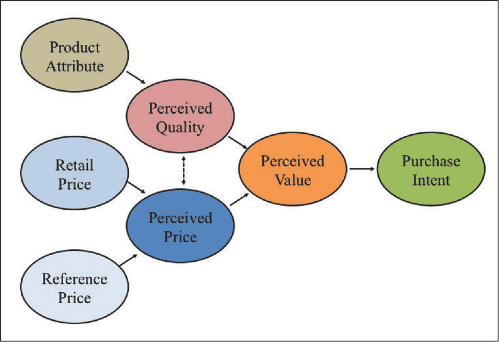
The longstanding purchase behaviors in the hearing aid market may stem from a lack of understanding about how consumers of amplification technology perceive attributes and price information of products, and, ultimately, how these perceptions translate into purchase and repurchase intent. Purchase and repurchase intent is predicated on perceived price, perceived quality, and, most importantly, perceived value.3,4 Figure 1 illustrates the relationship between these dimensions.
|
| Figure 1. Model illustrating the relationship between perceived quality and perceived price on perceived value, which influences purchase intent. |
Consumers derive a perception of price based on the retail (ie, actual) price and the reference price (ie, stemming from external sources, previous experience) of a product. Perceived quality is the consumer’s perception of the superiority of a given product to its intended purpose, relative to alternatives, including previously purchased products. Perceived price and perceived quality, together, result in a formation of value perceptions, which is the key variable to influencing choice. Perceived value is the consumer’s overall assessment of the utility of a product, and is dependent on the relationship between what is received and the price paid (eg, higher quality products are associated with higher retail prices). Therefore, increases in perceived value increase the likelihood of purchase intent, while decreases in perceived value decrease the likelihood of purchase intent.
Recently, Amlani and colleagues5 assessed perceived value, as measured by willingness-to-pay, for variations in product attribute framing (ie, perceived quality), and for variations in pricing strategy (ie, perceived price). The authors found that willingness-to-pay (ie, perceived value) increased significantly (p < .05) when the attributes of amplification technology (ie, perceived quality) were framed using non-technical language and demonstrated evidence-based benefit, compared to attributes of the same technology that were framed using vague and technical language. Likewise, perceived value increased significantly (p < .05), as a function of perceived price, when an unbundled pricing strategy was employed compared to the pure- and partial-bundled pricing strategies. The authors attributed this latter finding to the potential user’s perception that bundled pricing strategies masked value-based attributes.
The present article is an extension of our previous work, in which the primary objective is to quantify the dimensions of perceived value (ie, emotional, social, quality, and price) in first-time and experienced users of amplification technology. Results from this undertaking are expected to shed light on the end users’ purchase and re-purchase intent of amplification technology. A secondary goal is to assess the degree to which changes in pricing strategy influence perceived value, while holding the product attribute constant.
Method
Participants. Two groups, each consisting of 64 participants, were recruited for this study. All participants were retirees having an annual household gross income of $42,000 or less. Participants exhibited a bilateral symmetrical mild to moderately severe cochlear hearing loss, and were recruited through the University of North Texas Speech and Hearing Center, and through various assisted-living residents, service organizations (eg, Lions Club, Kiwanis Club), and elderly community and activity centers located throughout the Dallas/Fort Worth metropolitan area. The primary difference between participants in these two groups was their experience with amplification. Participants in Group 1 were experienced hearing aid users (ie, >1 year of experience with amplification) and participants in Group 2 were first-time hearing aid users (ie, less than 90 days experience with amplification). During their participation in this study, no participant in Group 2 attempted a trial period or underwent a hearing assessment. In addition, none of the participants in this study participated in one of our previous studies.
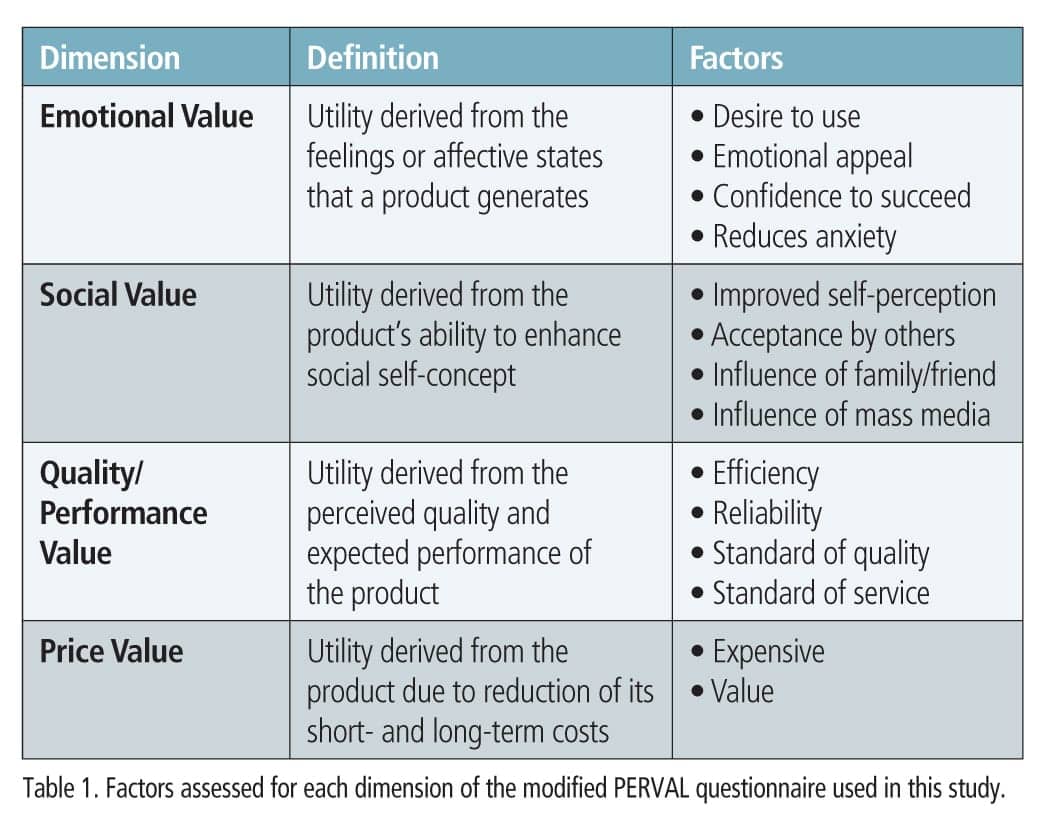
Questionnaire. Participant responses of perceived value toward amplification technology were obtained using a modified version of the Perceived Value (PERVAL) Measurement Scale.6 PERVAL is a 19-item questionnaire that measures a respondent’s attitude and behavior toward perceived value assessed in four dimensions: emotional value, social value, quality/performance value, and price value. For each item, respondents provide a categorical response ranging from 1 (strongly agree) to 7 (strongly disagree). Response ratings closer to 1 indicated positive perceived value, while responses closer to 7 indicated negative perceived value. PERVAL is valid and reliable in both the pre- and post-purchase conditions.6
Our version of the PERVAL questionnaire consisted of 14 items categorized in the same four dimensions and utilizing the same categorical response range as the original test instrument (Table 1). Questions across subscales were randomized. In addition, we reversed the categorical response range (ie, strongly disagree [1] to strongly agree [7]) for seven questions (ie, 2, 4, 5, 7, 10, 11, 13) to reduce response bias.
|
| (click to enlarge) |
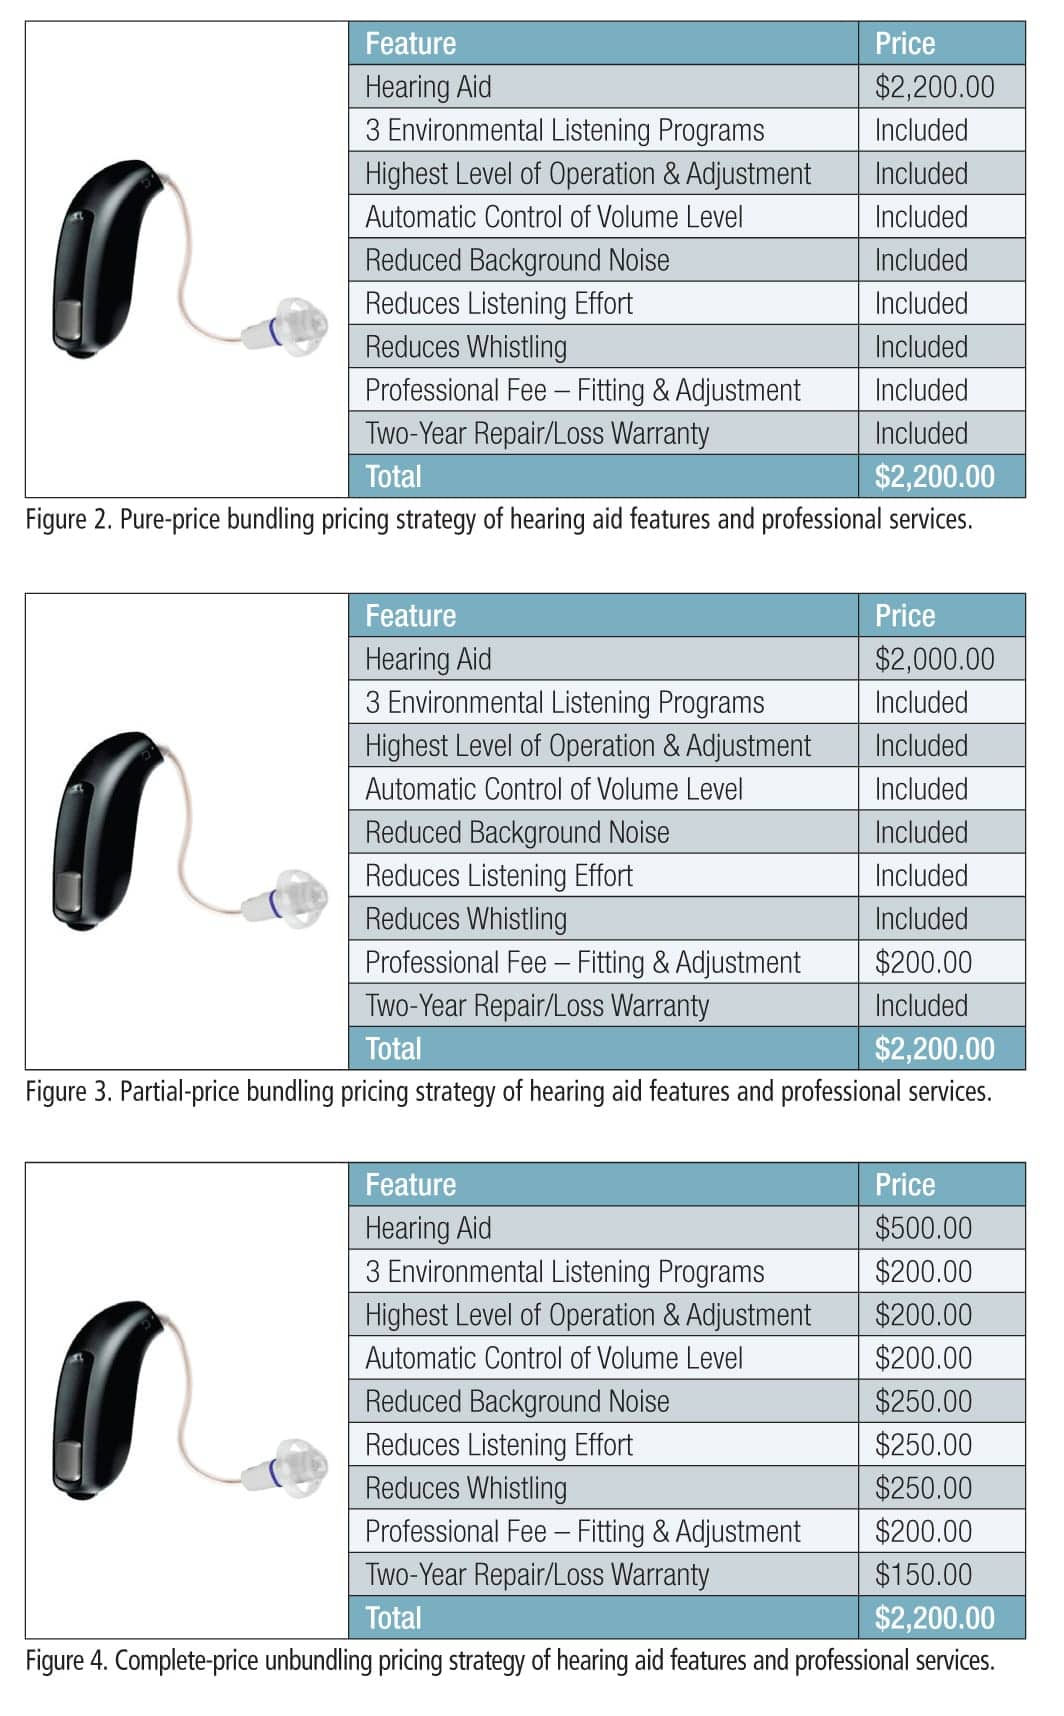
Procedure. Each participant provided responses to the same 14-item questionnaire for three high-resolution color photographic slides of a generic hearing aid. Each slide displayed the same hearing aid and evidence-based benefits written in non-technical language. However, each slide offered a different pricing strategy: pure-price bundling (Figure 2), partial-price bundling (Figure 3), and complete price-unbundling (Figure 4). Slides were counterbalanced across participants in both groups.
|
| (click to enlarge) |
Responses to the questionnaire were obtained during three separate, 60-minute sessions. Each session was separated by a minimum of 8 weeks and a maximum of 12 weeks (mean = 9.08 weeks; SD = 1.27 weeks). During data collection, a given slide was projected onto an 87-inch diagonal screen at an aspect ratio of 4:3, while participants sat at tables across from the experimenter in a quiet room. No more than three participants sat at the same table at any given time, with each participant separated from their neighbor by at least one seat. Each subject was asked to keep their written answers covered and to refrain from providing their responses verbally.
Results and Discussion
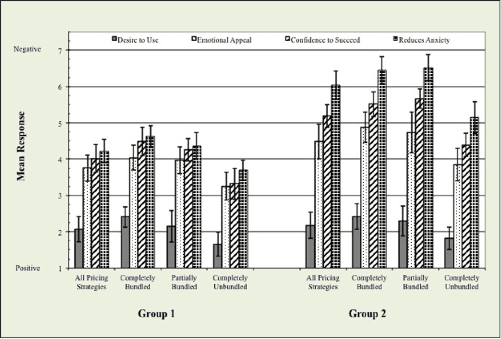
Figures 5-8 show mean responses, with ±1 standard deviation, across pricing strategy and group for each dimension of the questionnaire assessed in this study. Below is a summary of the findings.
|
| Figure 5. Mean responses to factors of emotional value that influence hearing aid adoption between groups, reported as a function of pricing strategy. (click to enlarge) |
|
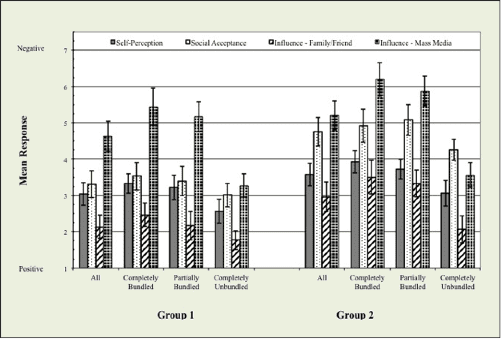
| Figure 6. Mean responses to factors of social value that influence hearing aid adoption between groups, reported as a function of pricing strategy. (click to enlarge) |
|
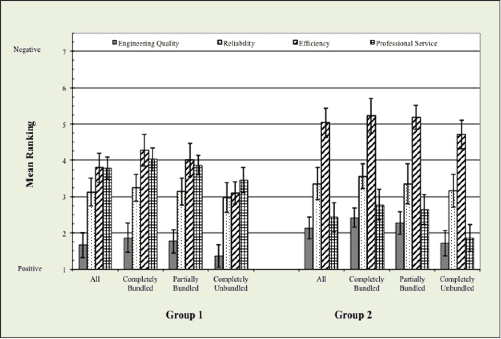
| Figure 7. Mean responses to factors of quality/performance value that influence hearing aid adoption between groups, reported as a function of pricing strategy. (click to enlarge) |
|
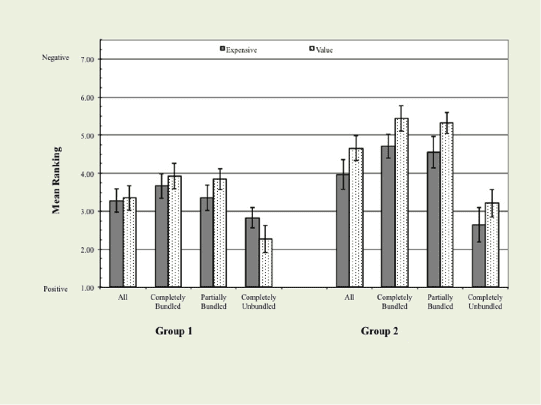
| Figure 8. Mean responses to factors of price value that influence hearing aid adoption between groups, reported as a function of pricing strategy. (click to enlarge) |
Emotional value. A nonparametric analysis of variance revealed a significant effect for emotional value (Friedman’s Chi-Square = 72.31; df = 3; p <.001) and pricing strategy (Kruskal-Wallis test; ?2(2) = 11.42, p < .01). Emotional value stems from marketing and promotional mix variables that arouse positive and negative emotional responses of one’s experience, or potential experience, with a product or service.7 Overall, mean responses revealed that experienced amplification users were more receptive emotionally to the marketing materials of amplification technology than their inexperienced counterparts (Mann-Whitney U; Z = -8.31, p < .001). For emotional value, four factors were assessed: desire to use, emotional appeal, confidence to succeed, and reduces anxiety.
In their desire to use hearing aids, post-hoc comparisons found that respondents in both groups responded equally (p > .05) positive (ie, value closer to 1). This finding suggests that the average respondent—independent of experience with amplification and type of pricing strategy—was accepting of their hearing loss and the need for treatment.
For the remaining three factors, mean responses were moderately positive, at best. The factor of emotional appeal is aimed at highlighting emotional features (eg, aesthetics, status, popularity) of a product, instead of practical or utilitarian features.7 As expected, respondents in Group 2 were significantly (p < .05) less influenced by emotional appeal than respondents in Group 1 (Figure 5). Interestingly, Group 2’s emotional appeal improved to a level similar (p > .05) to that of Group 1 when a completely unbundled pricing strategy was employed.
Respondents in Group 2 also perceived significantly (p < .05) less success and higher anxiety with amplification compared to respondents in Group 1. These negative responses improved significantly (p < .05) when a completely unbundled pricing strategy was employed compared to the completely and partially bundled pricing approaches (Figure 5). This finding suggests that unbundled pricing enhances the emotional dimension of perceived value for amplification technology over the bundled pricing approaches. Reasons for this improvement are unclear, but may stem from perceptual differences in the transparency of the product features and services to be acquired.
Social value. Next, we assessed the influence of social value on perceived value. Social value quantifies how consumers perceive themselves and how others perceive the consumer after acquiring a product or service. When the overall perception to acquire a product or service is positive, perceived value increases, potentially increasing purchase intent. Our questionnaire queried four factors relative to social value and hearing aid adoption: improved self-perception, acceptance by others, influence of family/friend, and influence of mass media.
Figure 6 shows the relationship between mean responses and group, as a function of pricing strategy. Statistically, results revealed a significant effect for social value (Chi-Square = 65.58; df = 3; p <.001) and between groups (Mann-Whitney U; Z = -7.16, p < .001). Respondents in Group 1, compared to respondents in Group 2, perceived social value more positively.
Results revealed that self-perception of adopting amplification was moderately positive and similar between groups (p > .05). With respect to self-perception versus social acceptance, respondents in Group 1 reported similar mean responses (Figure 6). Group 2’s value in adopting amplification, conversely, is negatively influenced more (p < .05) by social acceptance than by self-perception.
In addition, results revealed that perceived value of adopting amplification is influenced positively for both groups when a family member/friend participates in the acquisition process. Thus, purchase and repurchase intent of amplification can be improved by word-of-mouth referrals and through counseling efforts that include family members/friends, other experienced hearing aid users, or both.
The influence of mass media on social value was the final factor assessed. As seen in Figure 6, the influence of media had a similar negative effect (p > .05) on both groups. The negative mean responses to media are believed to stem from the respondents’ perception that marketing tactics focus primarily on technology and price, not benefit and value. In spite of the negative responses, mass media serve the important purpose of providing the end user with information about different products. The end user then uses the mass media information to compare products. This ability to compare products is one factor known to improve purchase intent.8
The influence of pricing strategy on social value revealed significant differences between pricing strategies (Kruskal-Wallis test; ?2(3) = 22.07, p < .001). Results revealed no significant (p < .05) improvement in social value for amplification technology promoted using the completely bundled and partially bundled pricing strategies for any of the factors assessed. While the completely unbundled pricing strategy statistically (p < .05) enhanced perceived value over the other two pricing strategies, this influence was significant (p < .05) only for mass media in Group 1, and all four factors in Group 2. Thus, pricing strategy toward social value appears to influence purchase intent more for first-time users than experienced users.
Quality/performance value. The third dimension of perceived value assessed in this study was the quality/performance of amplification technology. Specifically, we quantified the respondent’s opinion of the hearing aid to meet performance expectations and of the dispenser to fulfill these expectations. Results are displayed in Figure 7. Overall, results revealed a significant effect for quality/performance value (Chi-Square = 37.60; df = 3; p <.001) and between groups (Mann-Whitney U; Z = -3.74, p < .05).
Four factors were assessed in this dimension, of which three were related to the hearing aid itself. The first two questions queried respondent’s perception of the engineering quality and reliability. Here, we found that both experienced and first-time users positively view the quality of the product engineered, with no significant differences (p > .05) in their opinions. The reliability of the product was perceived to be significantly (p < .05) more negative than the engineering perception, but similar between groups (p > .05). Together, these data suggest that impaired listeners perceive hearing aids as quality products, which have a moderate degree of reliability. It is unclear from the responses whether the reliability factor was influenced by the average 5-year life span of this technology.
The third factor of quality/performance quantified was the efficiency of amplification technology to meet the listener’s needs. Results suggest that both groups negatively perceived efficiency. This finding was statistically significant (p < .05) relative to quality and reliability (Figure 7). In addition, efficiency was perceived differently (p < 05) between groups, with respondents in Group 2 providing greater negative responses than respondents in Group 1 did. This finding, we conjecture, is an extension of the long-standing issue related to understanding speech in presence of noise.
The fourth factor of quality/performance assessed the perception of professional service for the fitting of amplification technology for each group. A post-hoc comparison found that professional service was perceived to be significantly (p < .05) more positive by listeners in Group 2 compared to listeners in Group 1. This finding validates the notion that the first-time user perceives that the dispenser will provide communication strategies and support toward reducing the effects of hearing impairment.5 For experienced listeners, professional service was perceived more negatively, and may stem from the lack of standardized services—such as real-ear, speech-in-noise testing, and validation measures—provided over time. To improve the likelihood of loyalty toward a given hearing aid brand and, by association, the dispenser, standardizing professional services is necessary.
Lastly, the type of pricing strategy did not significantly (p > .05) influence either group’s perceived value relative to the technology itself. Pricing strategy was significant (p < .05) for the factor of professional service for Group 2, with the completely unbundled strategy providing significantly greater perceived value than the completely bundled and partially bundled pricing strategies. This finding also was found in our previous work.5 For Group 1, pricing strategies did not significantly (p > .05) improve the perceived value of adopting amplification technology.
Price value. The final dimension of perceived value assessed in this study was price. The primary goal in assessing price was to determine the influence of price on perceived value. Findings are displayed in Figure 8.
Overall, results revealed a significant effect for price (Chi-Square = 23.02; df = 1; p < .01) and group (Mann-Whitney U; Z = -3.49, p < .01). To answer the question of whether amplification technology was perceived as expensive, we found a significant (p < .05) difference between groups. Specifically, Group 2 perceived the retail price of amplification technology to be significantly (p < .05) more expensive than their Group 1 counterparts, but only when price was presented in a completely and partially bundled manner. No significant (p < .05) differences were found between groups for the completely unbundled approach, which were found to have mean rankings closer to 1.
Why did the perception of price improve significantly (p < .05) in both groups for the unbundled pricing strategy? The answer is a positive increase in perceived value, which stems from the unbundled approach enhancing the practical benefit provided by the device relative to the price paid compared to the two bundled approaches. This finding is supported by research on US consumers who place greater emphasis on practical attributes—not price—when deciding whether to purchase or repurchase a product.9
Conclusion
Findings from this study indicate that impaired listeners—independent of experience with hearing aids—have a desire to adopt amplification technology. Despite this desire to adopt or re-adopt amplification technology, negative perceptions in value are precluding purchase intent. The barriers to hearing aid adoption for inexperienced listeners are multivariate, with emotional value having the greatest influence, followed by social value. Specifically, first-time users experience anxiety that negatively moderates their confidence to be successful. These apprehensions can be reduced through counseling efforts, which, ultimately, increase the likelihood of purchase intent in first-time users.
For experienced listeners, the lack of brand loyalty stems from perceptions that amplification is moderately efficient and reliable. As a result, experienced listeners are on a quest to find a device that will further improve their performance in everyday conditions. This quest is fueled by product differentiation presented in the mass media and the recent proliferation in personal sound amplification devices. The negative perception of effectiveness provided by their current hearing aids appears to be amplified by the lack of standardized clinical procedures. Thus, practices that offer verification and validation measures, and those that provide outstanding customer service, are more likely to retain consumer loyalty toward the dispenser and, ultimately, the manufacturer.
Lastly, results revealed that the unbundled pricing strategy increased perceived value and, in essence, increased purchase intent compared to the pure and partial price bundled approaches. The primary reason for these results stems from the perception that transparent pricing highlights the practical utility of amplification and not the technology itself in both groups, and provides a perception of enhancing social value in first-time listeners. The unbundling pricing approach minimizes the value that a hearing aid is a high-risk, low-reward investment. Practices that incorporate the completely unbundled pricing approach can expect an improvement in the demand function for amplification technology and services.

|
Amyn M. Amlani, PhD, is an associate professor of audiology in the Department of Speech and Hearing Sciences, University of North Texas, Denton, Tex. CORRESPONDENCE to HR or Dr Amlani at: [email protected] |
Acknowledgement
The author expresses gratitude to Joshua Henley for his assistance with data entry and analyses.
References
1. Kochkin S. MarkeTrak VIII: 25-year trends in the hearing health market. Hearing Review. 2009;16(11):12-31.
2. Meyer C, Hickson L. What factors influence help-seeking for hearing impairment and hearing aid adoption in older adults. Int J Audiol. 2012;51:66-74.
3. Dodds WB, Monroe KB. The effect of brand and price information on subjective product evaluations. Advances in Consumer Research. 1985;12(1):85–90.
4. Zeithaml VA. Consumer perceptions of price, quality, and value: a means–end model and synthesis of evidence. Journal of Marketing. 1988;52(3):2–22.
5. Amlani AM, Taylor B, Weinberg T. Increasing hearing aid adoption rates through value-based advertising and price unbundling. Hearing Review. 2011;18(13):10-17.
6. Sweeny JC, Soutar GN. Consumer perceived value: the development of a multiple-item scale. Journal of Retailing, 2001;77:203-220.
7. Holbrook MB, Hirschman EC. The experiential aspects of consumption: consumer fantasies, feelings and fun. Journal of Consumer Research. 1982;9:132-140.
8. Amlani AM. How patient demand impacts pricing and revenue: understanding the concept of price elasticity. Hearing Review. 2008;15(3): 34-36.
9. Ko E, Lee M, Lee MY, et al. Product attribute’s effect on perceived values and repurchase intention in Korea, USA, and France. Journal of Global Scholars of Marketing Science. 2011;21(3):155-166.