Two versions are described of a self-test of hearing. The Clinic Version is designed to allow self-measurement of puretone air conduction thresholds at selected frequencies from 500 to 6000 Hz. The Home Version can be accessed via the Internet, and combines data from a number of sources to estimate hearing status based on publicly available US demographic data. Both versions are designed to identify people who could benefit from open-fit hearing devices and to prescribe appropriate gain for these open-fit devices or to make appropriate referrals for people who are not candidates. Data are reported on: 1) Reliability and accuracy of AC thresholds measured using a calibrated beta version of the Clinic Version software; and 2) Accuracy of the Home Version gain prescription methods.
Open-fit hearing devices do not require custom ear impressions and earmolds. Therefore, the same device can fit most ears, using a limited number of tubing, connectors, and tip sizes. This flexibility of physical fit has the potential to increase access to hearing devices for people who are open-fit candidates. Studies in the United Kingdom have already shown that open-fit devices can make hearing health care more accessible and less costly.1

This article was submitted to HR by Dianne J. Van Tasell, PhD, an independent consultant in hearing science and lead technical consultant to IntriCon Corporation, Arden Hills, Minn, in the development of the hearing assessment methods offered by hi HearingInnovations, Minnetonka, Minn, a subsidiary of UnitedHealth Group. Correspondence can be addressed to HR or Dr Van Tasell at .
hi HealthInnovations makes available technologically advanced open-fit hearing devices to people who are candidates for them. Candidacy is assessed using tests that the potential hearing device user can take either in a health care provider’s office or at home via the Internet, using a variety of platforms. The purpose of this article is to describe the methods developed for these self-tests and report the results of studies evaluating their reliability and accuracy.
The goals of the hi HealthInnovations hearing tests are:
- Accurately assess the hearing of users for the purposes of identifying people who could potentially benefit from open-fit hearing devices;
- Make appropriate audiological and medical referrals for people who are not candidates for open-fit devices so that they may get the custom earpieces, hearing device programming, and individualized assistance they need;
- For those users who are candidates, provide open-fit hearing devices accurately programmed according to methods that meet current audiological standards of practice.
Clinic and Home Versions of Hearing Test
The Clinic Version will be available on iPad and in an Adobe AIR® version that runs on PC and Mac computers. This version will use custom-designed earphones for which reference equivalent threshold sound pressure levels have been determined according to the methods described in ANSI S3.6–2010,2 and that may be calibrated in an HA-1 coupler. The resulting thresholds are used to program the hearing devices in one memory with the parameters prescribed by NAL-NL2.3 The two additional memories bracket the NAL prescription in order to accommodate individual preferences for variations from NAL.
The Home Version will be available on iPad, iPhone, iPod, and Android platforms, as well as in a Flash version that runs on PC and Mac computers. Any commercially available earphones may be used with the Home Version; insert earphones are recommended. Devices are also programmed using NAL-NL2,3 as described later in this article.
Referal Criteria
Asymmetry. Asymmetrical losses are detected using criteria based on differences between ears reported by Schlauch et al4 when acoustic neuroma is present in one ear. If the average thresholds between 2 and 6 kHz differ across ears by >15 dB, then the user is referred to a health care professional for further evaluation.
Inability to do the assessment. During an initial practice session, the user is instructed to make two threshold adjustments. If after five tries the user cannot produce two consecutive adjustments within 5 dB, he/she is instructed to seek additional assistance, be it office personnel in the Clinic Version, or a health care professional in the Home Version.
Loss too severe for open fit. If average AC threshold is >40 dBHL between 500 and 1000 Hz, or >65 dBHL between 2000 and 6000 Hz, then the hearing loss is judged too severe to be fit by NAL-NL2 gain in an open-fit device.1,5 The user is advised to see a health care professional for further assistance and evaluation.
AC Threshold Measurements
The development objectives for the method for measurement of air conduction (AC) thresholds were that it be:
- Engaging and interesting for the user;
- Reliable (test-retest reliability is equivalent to that reported in the audiology literature for standard audiometry in hearing-impaired population); and
- Accurate (measured difference between thresholds obtained by new method and standard audiometry is equivalent to test-retest reliability for standard audiometry in hearing-impaired population).
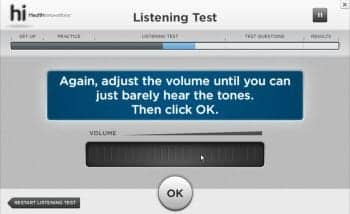
Figure 1. User interface for Flash and Air (non-touch-screen) versions of hi HealthInnovations hearing selfassessment. The volume slider is moved horizontally using a click-and-drag motion with a mouse.
Practice and Listening Test. Air conduction thresholds are measured in both Clinic and Home Versions of the hi HealthInnovations hearing test via a modified psychophysical method of adjustment. Responding to instructions from the software, the user moves an on-screen tool to adjust the level of puretone pulse trains. In the Flash and Adobe Air versions, where the tool must be manipulated using a mouse, the adjustment tool is an “endless” slider (Figure 1), much like the horizontal volume control wheel on an old-fashioned radio. For touch-screen applications, the adjustment tool is an “endless” wheel modeled after the click-wheel on the original iPod (Figure 2).
Measurement. After successful completion of practice, the test sequence commences. At each test frequency, the user is first asked if the tone sequence is audible; if not, he/she is asked to turn up the volume until it is. Then the user turns down the volume until the tones are no longer audible; at this point, the software further reduces the volume by a random amount so as to remove any on-screen cues regarding the level of the tones. The user is then asked to adjust the volume back up until the tones can just barely be heard.
This process is repeated up to five times until two adjustments within 5 dB are obtained. Threshold is computed as the mean of these two. The reader may recognize this as an application of the 1959 Carhart-Jerger method6 of adjustment: threshold adjustments are always made on ascending runs.
In the Clinic Version, AC thresholds (in dBHL) are measured at 500, 1000, 2000, 3000, 4000, and 6000 Hz in each ear. (The Home Version prescriptive gain rationale is explained later in this article.)
Evaluation of AC Measurement Method (Clinic Version). Feasibility studies of the method-of-adjustment threshold measurement (on iPad) were carried out with a beta test version of the Clinic Version software. Data collected from 25 hearing-impaired subjects at the University of Western Ontario (UWO) and 30 hearing-impaired subjects at the University of Arizona are reported here. All studies were approved by the participating institution’s Institutional Review Board (IRB).
Across locations, subject ages ranged from 21 to 86 years, with a median age of 71. All subjects had a known hearing loss in at least one ear. Average PTA across individual ears (500, 1000, and 2000 Hz) was 40 dBHL, with minimum of 8 dBHL and maximum of 92 dBHL. At both locations, the method evaluated was the (beta test) Clinic Version, running on an iPad and using Etymotic ER-3A insert earphones. Both the audiometer and the iPad were calibrated to ANSI S3.6-2010 specifications using an HA-2 coupler.
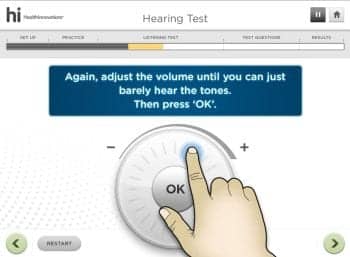
Figure 2. User interface for iPod, iPad, and other tablet versions of hi HealthInnovations hearing self-assessment. The volume wheel is moved clockwise with the finger to increase volume, and counterclockwise to decrease volume.
Each subject completed several hearing test conditions including: 1) Measurement of air conduction thresholds using standard clinical procedures and a calibrated clinical audiometer with ER-3A earphones, and 2) Two repetitions of self-test thresholds in each ear using the method of adjustment on the iPad. If there was an audiogram on file for a subject that had been taken during the previous 6 months, then that audiogram was used as the standard audiogram.
Subjects did not receive special instruction with the iPad other than the standard user instructions and practice that appeared on the screen. Supervisors of testing were allowed to answer subjects’ questions, but not to help them make threshold adjustments. At each research location, one subject could not complete the iPad self-assessment because he/she could not make consecutive adjustments within the required 5 dB. One of these subjects was 84 years old; the other was 77.
- Reliability. Test-retest reliability is quantified by the difference between the first and second thresholds measured. The usual clinical standard difference is ±10 dB, which roughly corresponds to the range of measurement error inherent in standard audiometry, including calibration tolerances.7 Almost all (99%) of subjects’ second iPad thresholds were within 10 dB of the first; this compares favorably even with test-retest data from young otologically normal adults, shown for comparison in Table 1, and with test-retest data from one study in which the subjects were hearing-impaired adults, also shown in Table 1.
- Accuracy. Ideally, the differences between standard audiometry and thresholds measured using a new method would be similar to test-retest differences for standard audiometry alone. This would mean that a threshold measured using the new method would be just as accurate as measuring the standard audiometric threshold a second time.
Average threshold difference data between iPad and audiometry therefore are compared to the test-retest data in the literature for standard audiometry; the iPad data are shown in the bottom row of Table 1. A total of 89% of iPad-vs-audiometer differences were within 10 dB. This compares with the audiometry test-retest differences for hearing-impaired subjects (93%),8 but shows a larger spread than standard audiometry for normal-hearing subjects (99%).7
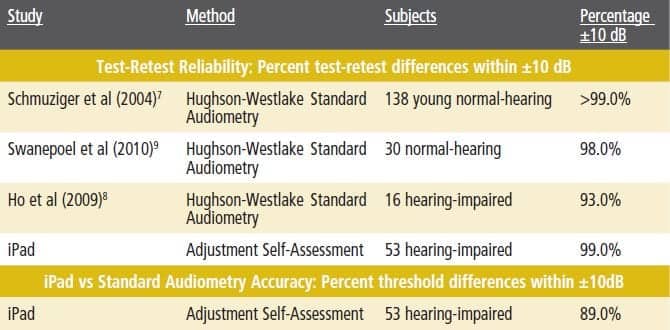
Table 1. Top: Percent AC test-retest differences within ±10 dB from three studies and present iPad study. Bottom: Percent threshold differences within ±10 dB for iPad and audiometry measures (bottom). All studies used insert earphones.
Ho et al8 reported an average signed test-retest standard audiometry difference of 1.84 dB across all test frequencies for their hearing-impaired subjects, with a standard deviation (SD) of 6.68 dB. This compares closely with the average observed iPad/audiometry signed difference of 0.90 dB, with an SD of 6.92 dB. The slightly larger variance of the iPad data when compared with normal subjects’ audiometric test-retest data is an expected outcome, given that the subjects in the iPad studies:
- Were much older than the subjects in the comparison studies;
- Received no verbal instruction on how to measure their thresholds;
- Were free to set their own threshold criteria in the iPad method; and
- Received no clinician feedback of any kind during the test.
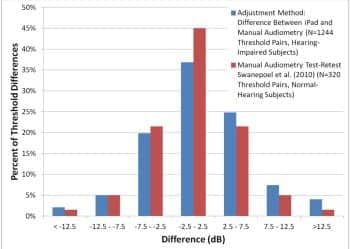
Figure 3. Distribution of iPad vs standard audiometry threshold differences. Comparison is estimated distribution of standard audiometry test-retest differences for normal-hearing subjects, taken from Table 3 of Swanepoel et al.9
Figure 3 shows the distribution of the iPad/audiometry threshold differences along with reported test-retest distribution for normal-hearing subjects of Swanepoel et al.9 The similarity of the distributions is clear.
Home Version: Gain Prescription Method and Evaluation
Basic rationale for gain prescription method. The development objective for the Home Version of the hearing test was an accurate method of prescribing hearing device gain that does not require calibration. An accurate method is here defined as one that prescribes the same hearing device parameters as the NAL-NL2 parameters that would be prescribed from the user’s audiogram obtained via standard audiometry.
The major challenge in the Home Version was to get a sufficiently accurate estimate of the user’s audiometric configuration for the purpose of accurate gain programming. This must be done in an environment where calibration of a test signal—that is, to know absolute sound pressure level in the user’s ear—is impossible due to wide variability in computer sound-cards and earphones.
The hi HealthInnovations approach (patent applied for) is to combine several minimally related sources of data about hearing loss to arrive at an accurate estimate of the user’s hearing. It is important to note that the Home Method does not measure an individual audiogram, and therefore it does not report an audiogram to the user. The purpose of the self-assessment is not to obtain an audiogram, but to program the hearing device so that it provides gain appropriate to the user’s hearing ability.
There are two main contributors to variance in audiometric configuration: severity and slope.10 In the hi HealthInnovations method, severity is estimated by taking advantage of the predictive relationship between the user’s score on a self-report questionnaire and his/her average puretone thresholds. The slope is estimated by obtaining air conduction thresholds in each ear at 2 and 4 kHz using the modified method of adjustment described above. Although the absolute thresholds cannot be known in an uncalibrated system, the differences between thresholds at 2 and 4 kHz (slope) can be quantified, as can the differences across ears. (If the difference in measured thresholds across ears meets the referral criteria for asymmetry, then the user is referred for further evaluation and fitting.)
If the hearing is symmetrical, the method takes the information gathered from the user (questionnaire score, estimated average slope 2-4 kHz across ears, age, and gender), and uses it to reconstruct the three most likely audiograms, based on demographic data from the publicly available National Health and Nutrition Examination Survey (NHANES).11 Each of the three memories of the hearing device is then programmed with the NAL-NL2 parameters appropriate for each of the three possible audiograms. The user is instructed to practice listening carefully with each memory, and to choose the one that sounds the best.
Evaluation of gain prescription method. The Hearing Screening Inventory (HSI) has been reported to show good predictability for puretone average.12 New correlation data were collected using the questions from the HSI for use in the Home Version. At each of two university locations (Northwestern University and University of Minnesota), 48 and 53 subjects (respectively) provided answers to the 12 questions of the HSI. Additionally, audiograms of the subjects were taken by an audiologist, or the subjects gave permission for use of audiograms already on file at the research location. All research was approved by the IRB at the participating institution.
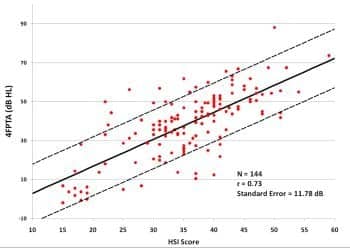
Figure 4. Binaural puretone average (500, 1000, 2000, and 4000 Hz) air conduction thresholds as a function of score on Hearing Screening Inventory12 for 144 subjects. All subjects had average thresholds at 2000 to 6000 Hz within 15 dB across ears (symmetrical hearing losses). Solid line is the best-fitting linear regression line; dashed lines are ±1 standard error.
The subjects who participated in the iPad studies at UWO and Arizona also answered the questionnaire, so their data were combined with the data from the questionnaire-only subjects to yield 144 people with questionnaire results and audiograms (data from people with asymmetrical hearing losses were omitted). Figure 4 shows the measured relationship between the HSI score and puretone average (across ears) at four frequencies: 500, 1000, 2000, and 4000 Hz. The resulting linear regression equation is used in the Home Method to predict the 4FPTA from the user’s questionnaire score; the known standard error is taken into account in the estimation of loss severity.
Data from the same 144 subjects were used to evaluate the accuracy of the gain prescription method to be used in the Home Version. We start with the assumption that, for each of the 144 people, we know only four things:
- Questionnaire score (and therefore predicted 4FPTA, with known error range);
- Difference between 2 and 4 kHz thresholds each ear (with a known error range attributable to difference among earphones of ±11 dB);
- Gender; and
- Age.
Using only the information that would be available from testing with the Home Version, we then reconstruct the three most likely audiograms, and from them derive the NAL-NL2 parameters. Of course, for these 144 subjects, we also know the “true” audiograms (measured with standard audiometric techniques), so we know the NAL-NL2 parameters that would have been prescribed had their audiograms been known. We evaluate our method by comparing the NAL-NL2 gain (for 65 dBSPL speech input) for the known audiogram with the gain that would be assigned by the Home Version in the “best” memory (the one in which prescribed gain is closest to gain for the known audiogram).
Figure 5 shows the results. At all measurement frequencies, the average difference between NAL-NL2 gain and Home Version gain is less than 1 dB, with standard deviations of 2.6 to 3.9 dB. The overall rms error between audiogram and Home Version gain is 3.62 dB. In at least one memory, gain prescription is within 3 dB of NAL for 72% of comparisons and within 6 dB of NAL for 91% of comparisons. This is well within the 3 to 9 dB that published data show as variance between initial settings for prescription methods and the gains that new users initially prefer.13,14
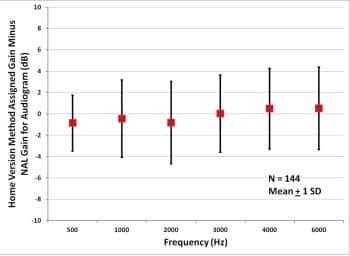
Figure 5. Average assigned gain minus NAL-NL2 gain for 144 subjects with symmetric audiometric thresholds..
Conclusions
- The hi HealthInnovations Clinic Version of the method-of-adjustment self-test for measurement of AC thresholds (when using iPad in a calibrated and controlled environment) has been shown to:
a) Be as reliable as standard audiometry for hearing-impaired persons; and
b) Yield thresholds equivalent to thresholds measured via standard AC audiometry for people with hearing loss. - The Home Version method for determining optimal gain prescription when calibration of earphones is not possible results in prescribed gains in at least one hearing device memory within 6 dB of NAL-NAL2 gains for 91% of comparisons (144 test subjects x 6 frequencies).
- The hi HealthInnovations Internet-based hearing test can be expected to:
a) Detect conditions requiring individualized services of a hearing professional, and make appropriate referrals for those services;
b) Prescribe appropriate gain for people who are likely candidates for hi HealthInnovations open-fit hearing devices.
Future Improvements
Device adjustments. Although the Home and Clinic Versions will result in accurate NAL-NL2 gain, and additional programs bracket NAL gain in order to increase the odds that the user will find one of them satisfactory, it is still anticipated that many users will want to make further adjustments to device parameters for improved listening satisfaction. An online expert system—based on the one developed by Jenstad et al15—will be implemented on the hi HealthInnovations Web site. Users will indicate which complaints are most descriptive of their experiences. Their hearing devices will then be reprogrammed based on the expert system specifications.
Improvements to Home Version. In the Clinic Version, users provide answers to the questionnaire in addition to providing AC threshold data; in this environment, the questionnaire answers are used to provide an accuracy check on the AC threshold data. The combined questionnaire and threshold data will also provide a rich source of data for continuous improvement of the accuracy of gain prescription in the Home Version. As more data are accumulated, computation methods in the Home Version will be periodically refined.
Acknowledgements
All research reported here was done at university sites under contract with IntriCon Corp, Arden Hills, Minn. Data were collected independently at each site under controlled laboratory conditions for purposes of evaluating predictability of puretone air conduction thresholds from self-tests and questionnaires. All data analysis, interpretation, and application to methods used in hi HealthInnovations programs were performed solely by the author. Universities that served as research sites do not necessarily endorse the conclusions stated herein, or the hi HealthInnovations model for service delivery.
References
- Smith P, Mack A, Davis A. A multicenter trial of an assess-and-fit hearing aid service using open canal fittings and comply ear tips. Trends Amplif. 2008;12:121-136.
- American National Standards Institute (ANSI). Specifications for audiometers (ANSI/ASA S3.6-2010). New York: ANSI; 2010.
- Keidser G, Dillon H, Flax M, Ching T, Brewer S. The NAL-NL2 prescription procedure. Audiol Res. 2011;1:e24.
- Schlauch RS, Levine S, Li Y, Haines S. Evaluating hearing threshold differences between ears as a screen for acoustic neuroma. J Speech Hear Res. 1995;38:1168-75.
- Van Tasell D, Edwards D, Hesse K, et al. Acoustical characteristics of open-fit hearing aids. Poster presented at: American Auditory Society Meeting; March 2008; Phoenix, Ariz.
- Carhart R, Jerger J. Preferred method for clinical determination of pure-tone thresholds. J Speech Hear Disord. 1959;24:330-345.
- Schmuziger N, Probst R, Smurzynski J. Test-retest reliability of pure-tone thresholds from 0.5 to 16 kHz using Sennheiser HAD 200 and Etymotic Research ER-2 earphones. Ear Hear. 2004;25:127-132.
- Ho A, Hildreth A, Lindsey L. Computer-assisted audiometry versus manual audiometry. Otol Neurotol. 2009;30:876-883.
- Swanepoel DE W, Mngemane S, Molemong S, Mkwanazi H, Tutshini S. Hearing assessment—reliability, accuracy, and efficiency of automated audiometry. Telemed J E Health. 2010;16:557-563.
- Woods W, Rickert M, Van Tasell D. Multichannel compression performance vs number of channels. Paper presented at: International Hearing Aid Conference (IHCON); 2000; Lake Tahoe, Calif.
- Centers for Disease Control and Prevention (CDC). National Center for Health Statistics (NCHS). National Health and Nutrition Examination Survey Data [1999-2004]. Hyattsville, Md. Available at: www.cdc.gov/nchs/nhanes.htm.
- Coren S, Hakstain A. The development and cross validation of a self-report inventory to assess pure-tone threshold hearing sensitivity. J Speech Hear Res. 1992;35:921-928.
- Marriage J, Moore B, Alcantara J. Comparison of three procedures for initial fitting of compression hearing aids. III. Inexperienced versus experienced users. Int J Audiol. 2004;43:198-210.
- Keidser G, O’Brien A, Carter L, McLelland M, Yeend I. Variation in preferred gain with experience for hearing-aid users. Int J Audiol. 2008;47:621-635.
- Jenstad L, Van Tasell D, Ewert C. Hearing aid troubleshooting based on patients’ descriptions. J Am Acad Audiol. 2003;14:347-360.
Unused Reference:
Citation for this article:
Van Tasell D.J. Methods for Prescribing Gain for hi HealthInnovations’ Hearing Devices: Reliability and Accuracy. Hearing Review. 2012;19(01):18-27.