
|

|

|
| Jürgen Kiessling, PhD, is a professor and director of the Department of Audiology, Justus-Liebig University, Giessen, Germany; Gitte Keidser, PhD, is a senior research scientist at the National Acoustic Laboratories (NAL), Sydney, Australia; Ruth Bentler, PhD, is a professor in the Department of Communication Sciences and Disorders at the University of Iowa; and Michael Müller (not pictured) is a PhD candidate at Justus-Liebig University. | ||
Most modern hearing aids provide multi-channel wide dynamic range compression (WDRC) and output limiting to ensure audibility of a wide range of input levels without making sounds uncomfortably loud. While the prescription of nonlinear gain has received plenty of attention over the years,1-4 interest in the maximum output level of hearing instruments seems to have lessened significantly since the introduction of WDRC. This is presumably because it was assumed that the input compression mostly kept the output sound pressure level for a 90 dBSPL input level (OSPL90) well below the OSPL90 prescribed for linear instruments. Such output levels were generally prescribed to be less than or equal to the hearing aid wearer’s measured or predicted loudness discomfort level.5-7 Consequently, loudness discomfort was assumed to be less problematic with nonlinear than with linear devices.
Ideally, gain and output are prescribed and verified to ensure that any form of loudness discomfort is avoided. Current “best practice” guidelines8-9 provide a protocol to verify that both gain and output are adequately achieved, and the evidence base is offered within the guidelines to support this important stage of hearing aid fitting.
Yet, according to the latest large-scale poll, more than 40% of current hearing aid users are still dissatisfied with the loudness provided by their own hearing aids.10 It also appears that many clinicians fail to prescribe and/or verify the appropriateness of the maximum output of the hearing aid.11
This is a worrying trend, and as a result, development of a hearing aid output verification test was proposed during a meeting between industry partners and researchers in 2005. At that meeting, the industry agreed that—if a universal, time-efficient, and valid test for verifying the output of hearing aids could be devised—they would like to make this test available in their fitting software. Specifically, it was envisaged that such a test be based on real-life sounds rather than on puretones or random noise in order to make the test applicable to everyday experiences.
A working group consisting of the authors was subsequently established and given the task of developing and evaluating a clinically feasible test for verifying the maximum output level in hearing aids using real-life sounds. In this paper, we present a proposed test layout and protocol that we envisaged would meet the criteria for being time efficient, reliable, and valid. The test was developed with a view to the extensive literature related in particular to prescribing output levels in hearing aids and measuring loudness discomfort levels.
|
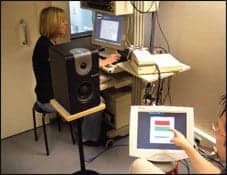
| FIGURE 1. Test setup. A test subject, seated about 1 m from the loudspeaker, working with the response scale on a touch screen, with the clinician operating the control software in the background. |
Test Platform
To make the test an integrated part of the hearing instrument fitting process, it was important to ensure that the test could be conducted in a typical clinical environment without requiring new and expensive equipment. The result was a test that is software-driven, with menus from which the clinician selects relevant test parameters. Stimuli, which are supplied with the software, were presented from the clinician’s computer to the aided client through a typical soundfield test setup consisting of an audiometer and loudspeaker, or an amplifier and loudspeaker. In a simple setup, the client is provided with a paper version of the test instructions and response scale, then verbally indicates responses to the clinician. Alternatively, the response scale may be presented on a touch screen or panel, allowing the test to run automatically (Figure 1).
Test Protocol
Stimuli. A specific request to the working group was that the protocol be based on real-life sound samples, as it was assumed that this would provide a more valid outcome of the verification test than the use of puretones or unfamiliar noises. The acoustic characteristics of real-life sounds vary tremendously across several dimensions, and differences in the acoustic characteristics can affect the threshold of loudness discomfort and the output levels produced by each hearing instrument and its specific signal processing strategy. Specifically, the spectral tilt, spectral peakiness, and bandwidth have been found to affect output levels and loudness discomfort.12-14
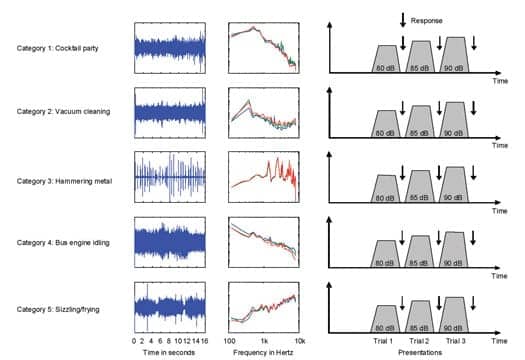
Although most environmental sounds are wideband, and output limiting in most hearing aids is adjusted across a single band, parameters other than the limiter could be adjusted to reduce loudness discomfort in a narrow frequency band. With this in mind, stimuli with different spectral and temporal characteristics, as well as bandwidth, were considered. Specifically, we thought it important to include broadband stimuli in five categories:
- A speech-like spectral and temporal characteristic;
- A stationary characteristic;
- A highly amplitude-modulated characteristic;
- A low-frequency weighted spectrum; and
- A high-frequency weighted spectrum.
Because hearing aid users have more problems with high-frequency weighted sounds, narrowband stimuli should focus on frequencies above 1 kHz. Further criteria for the selection of suitable stimuli included the applicability of the sound source to a worldwide clinical population and the natural occurrence of such sounds at high intensity levels.
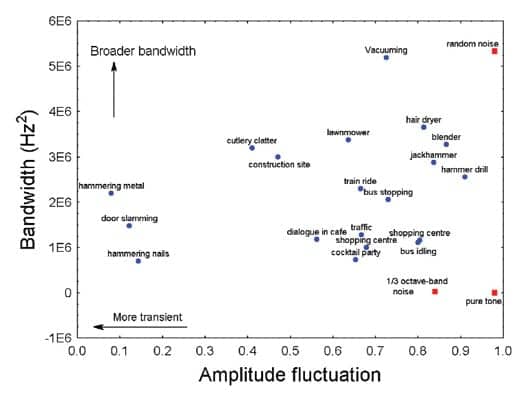
A range of common sound sources collected at National Acoustic Laboratories (NAL), recorded on location, and presented at an Leq above 75 dBSPL at the time of recording, were analyzed with respect to their frequency weighting, bandwidth, and amplitude fluctuation. The frequency weighting and bandwidth were obtained by measuring the first and second moments of the frequency spectrum, respectively, while the amplitude fluctuation was measured by the mark-space ratio of the envelope (MSR). Note that, according to the second moment of the frequency spectrum, broadband does not necessarily mean that there is consistent energy across a wide range of frequencies; rather, that there is substantial energy spread across a wide range of frequencies (often resulting in a peaky spectrum shape). Likewise, narrowband does not necessarily mean that there is only energy in a restricted frequency range; rather, that the main energy is found within a narrow frequency range. For the analyses, the sounds were sampled at 16 kHz and a mean value of each parameter was sampled every 16 seconds.
|
| FIGURE 2. The distribution of sound sources producing an Leq greater than 75 dB SPL across the parameters amplitude fluctuation and bandwidth. |
Figure 2 shows how a selection of high-intensity real-life sound sources varies with respect to bandwidth and amplitude fluctuation. The results of the analysis of a 1 kHz puretone, one-third octave band pink noise (center frequency of 2.5 kHz), and a wideband random noise are included on the graph (red squares) to give the values of the parameters some perspective.
Among the available sound sources, the cocktail party noise was selected to represent stimulus Category 1. This sound was selected because no single voices could be easily identified in the recording, the sound was fairly consistent over time, and it appeared more realistic than, for example, a single voice stimulus when presented at 80 dB SPL and above. To represent the broadband stationary sound, Category 2, the vacuum cleaner that had the broadest bandwidth and that was thought to be universally recognizable was selected for evaluation of the test protocol. Hammering metal was selected to represent sound Category 3, as it consisted of distinct transients and was a natural and easily recognizable loud sound. The first moment of the frequency spectrum was used to identify sound sources that were predominantly low-frequency or high-frequency weighted. The low-frequency weighted sound source that was considered universal and easy to relate to was that of an idling bus engine (first moment of 0.7 kHz), which was selected for sound Category 4. None of the loud sound sources depicted in Figure 2 had a true high-frequency weighted spectrum. From the library of sounds, the sound source that stood out as being truly high-frequency weighted (first moment of 5.4 kHz) was sizzling in a frying pan, which produced an overall level of 71.3 dB SPL. This source is also reasonably stationary (MSR = 0.83), and still sounded realistic at high intensity levels, so it was selected for stimulus Category 5.
According to Figure 2, there were no real-life sounds available with frequency-specific narrow bandwidths. Consequently, it was decided to include one-third octave band filtered random noise as narrowband stimuli in the Output Verification Test.
Presentation. The setting of the limiter in hearing aids is objectively verified for a 90 dBSPL input level (the OSPL90 test). From a range of publications that present intensity levels recorded for a wide range of common everyday sound sources, it would appear that exposure to long-term intensity levels over 90 dBSPL is rare, and is limited to sounds with most of the energy presented at very low frequencies.15,16 Further, the average levels rated as uncomfortably loud for narrowband and broadband stimuli by normal hearing listeners exceed 90 dBSPL.17-19 Consequently, it would seem that, if hearing aid users can accept everyday broadband sounds at 90 dBSPL, they should not suffer from loudness discomfort in real life. However, in anticipation of the output level initially being set too high for some clients, it was decided to choose a lower starting level and increase the intensity level in an ascending manner.
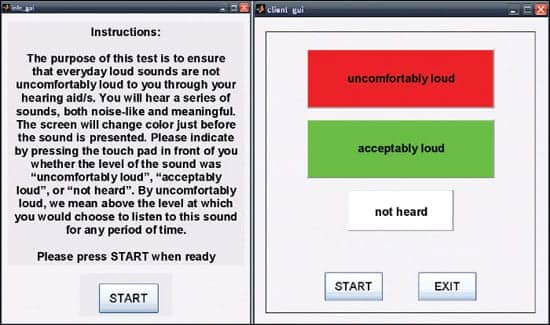
Response scale. Categorical loudness scales have been found to be easily managed by the clinical population.18 Initially, a 5-point categorical scale focusing on the “loud” end of the loudness scale was proposed and used with the discrete points labeled: OK, slightly uncomfortable, moderately uncomfortable, very uncomfortable, and STOP. However, after some pilot testing, there were concerns that these labels prompted the participants to think the test stimuli were “uncomfortably loud” and that many of the test participants felt compelled to move up the scale with each increase in presentation level. Pilot testing also demonstrated the need for adding a “not heard” button in the fully automated version of the test as some participants could not hear the most high-frequency narrowband stimuli at the starting presentation level. The response options were consequently simplified to two main categories, “uncomfortably loud” and “acceptably loud,” with a category at the side labeled “not heard.” The binary response option was also expected to speed up testing time.
|
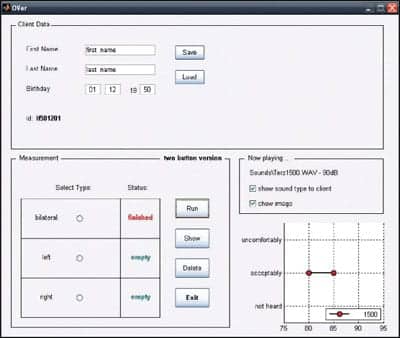
| FIGURE 3. Clinicians´ graphical user interface. |
Implementation
A stand-alone computer program was developed for the purpose of evaluating the concept of the Output Verification Test across different sites. The Matlab program (www.mathworks.com) consists of three parts, each of which manages the clinician’s graphical user interface (GUI), the client’s instruction and response GUI on a touch screen, and the presentation of the test stimuli using the SoundMex Basic application by HörTech (www.soundmex.de).
An example of the clinician’s GUI is shown in Figure 3. Client details are entered in the top window. In the measurement window (bottom left), the clinician selects which of three test modules to run. The modules refer to unilateral testing of each ear independently (with the opposite ear blocked) and bilateral testing using narrowband and broadband test stimuli in each module. When the desired test module has been selected, the clinician clicks the “Run” button to begin testing. Progress of the testing is viewed in the windows on the right, which display the current stimulus and presentation level playing and graphically show the client’s responses. In the measurement window, the status of the testing of each selected module changes from “empty” to “finished” as the test progresses. The results of each test module can be separately deleted (“Delete”) to repeat the module, if needed. At the conclusion of the test, the results from all selected modules are displayed on a new screen (“Show”) and printed.
|
| FIGURE 4. Clients´ instructions and response graphical user interface. |
For research purposes, the client information and the response scale were presented on a touch screen. However, the test can be administered using pencil and paper. Figure 4 shows an example of the standardized instructions for clients. When the client has read and understood the instructions, the client presses the start button. The simplified response scale, designed to achieve a better contrast between responses, is then displayed on the screen as shown to the right in Figure 4. The client again presses the start button when ready to listen to the test stimuli.
|
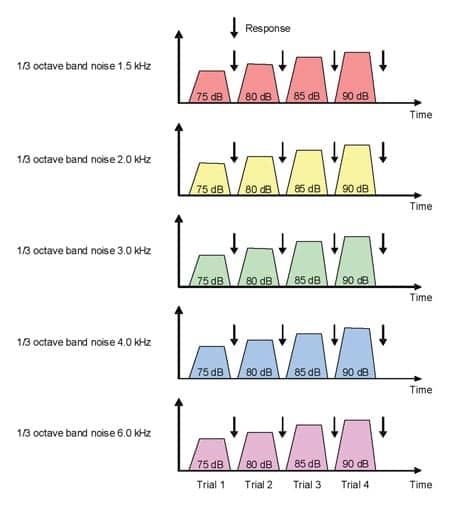
| FIGURE 5. Paradigm for narrowband noise stimulation. |
The narrowband stimuli, consisting of a series of third-octave band noise bursts at 1.5, 2, 3, 4, and 6 kHz, were presented in 5 dB steps from 75 to 90 dBSPL (Figure 5). The series of broadband environmental noise samples were presented in 5 dB steps from 80 to 90 dBSPL (Figure 6). All the stimuli had a linear ramping applied to the first and last 10 ms. Informal listening tests suggested that a duration of 2 s for the narrowband noises was sufficient for deciding whether the loudness level was acceptable or not, while a slightly longer duration time of 4 s was needed for the more time-varying real-life sounds. A presentation stops as soon as one of the response buttons is touched. If the “uncomfortably loud” button is touched, the program automatically moves to the next sound sample at the starting level. Because pilot testing suggested that some degree of adaptation to higher levels took place over repeated presentations, the program was designed to present each sound type twice, storing only the responses to the second trial. Because visual cues play an important role in identifying and relating to sounds we listen to,20 pictures characterizing the sound environments can be presented along with the sound presentations on the response screen.
|
| FIGURE 6. Paradigm for broadband environmental noise stimulation. |
Calibration Procedure
A Matlab-based calibration module was also developed. This procedure is run for each setup to initially calibrate the stimuli levels. The program presents all sound samples one by one. The sound pressure level of each sound is measured using a sound level meter and the measured levels are manually entered into the calibration program. According to this information, the program adjusts the RMS values of all .wav files presented during the Output Verification Test. Although this procedure is developed for the initial calibration, the procedure is not very time-consuming and therefore might be used for ongoing calibration checks.
Clinical Feasibility and Outlook
Pilot testing on a small number of listeners with normal hearing and hearing aid users suggest that the proposed test protocol is clinically feasible. In particular, it was found that, if a client does not experience loudness discomfort when tested bilaterally, it is unlikely that loudness discomfort is experienced in the unilateral modes. Therefore, to limit the testing time, it is suggested that clinicians routinely test all clients bilaterally, using the unilateral test modes to troubleshoot each aid separately and to determine at which frequency loudness discomfort occurs.
On average, hearing aid users completed the bilateral test module, presented twice using the entire range of narrowband and broadband stimuli, in about 4 minutes. It is anticipated that further experiences with the test protocol will lead to a reduction in the number of test stimuli, which will further reduce testing time.
Overall, comments from participants in the pilot studies suggest that the test is manageable and that hearing aid users can see the relevance in performing the test. A more important question, however, is how accurately the test can predict the occurrence of loudness discomfort in real life. A study to investigate the validity of the test was designed and conducted collaboratively at the Justus-Liebig University of Giessen, the University of Iowa, and the NAL, the results of which are forthcoming.
In summary, it has been shown that an Output Verification Test (OVer Test) employing environmentally valid sounds and a well-founded protocol that is easily managed by a clinical population can be designed and implemented for clinical use. However, according to a validation study of the OVer Test conducted across three continents, the outcomes of which will be published in a separate paper, some modifications are needed to improve the specificity of the test before it can be recommended as a clinical tool.
Acknowledgement
This study was coordinated by HörTech gGmbH, Oldenburg, Germany, and funded by GN ReSound, Oticon, Phonak, Siemens, Starkey, and Widex.
References
- Killion M, Fikret-Pasa S. The 2 types of sensorineural hearing loss: loudness and intelligibility considerations. Hear J. 1993;46(11):31-34.
- Cornelisse L, Seewald R, Jamieson D. The input/output formula: a theoretical approach to the fitting of personal amplification devices. J Acoust Soc Am. 1995;97(3):1854-1864.
- Valente M, Van Vliet D. The independent hearing aid fitting forum (IHAFF) protocol. Trends Amplif. 1997;2(1):6-35.
- Dillon H. NAL-NL1: A new prescriptive fitting procedure for non-linear hearing aids. Hear J. 1999;52(4):10-16.
- McCandless GA, Lyregaard PE. Prescription of gain/output (POGO) for hearing aids. Hear Instrum. 1983;34:16-21.
- Hawkins DB, Walden BE, Montgomery A, Prosek RA. Description and validation of an LDL procedure designed to select SSPL90. Ear Hear. 1987;8:162-169.
- Dillon H, Storey L. The National Acoustic Laboratories’ procedure for selecting the saturation sound pressure level of hearing aids: theoretical derivation. Ear Hear. 1998;19:255-66.
- American Academy of Audiology. Guidelines for audiologic management of adult hearing impairment. Audiol Today. 2000;18(5):6-10.
- American Speech-Language-Hearing Association. Guidelines for hearing aid fitting for adults. Asha. 1998;40(Suppl 18).
- Kochkin S. MarkeTrak VI: 10-year customer satisfaction trends in the US hearing instrument market. Hearing Review. 2002;9(10):14-25,46.
- Mueller GH. Fitting test protocols are “more honored in the breach than the observance.” Hear Jour. 2003;56(10):19-26.
- Warner RL, Bentler RA. Thresholds of discomfort for complex stimuli: acoustic and sound-quality predictors. J Speech Lang Hear Res. 2002;45:1016-1026.
- Fortune T, Scheller T. Duration, compression, and the aided loudness discomfort level. Ear Hear. 2000;21:329-341.
- Bentler RA, Nelson JA. Effect of spectral shaping and content on loudness discomfort. J Am Acad Audiol. 2001;12:462-470.
- Teder H. Noise and speech levels in noisy environments. Hear Instrum. 1990;41(4):32-33.
- Bjerg AP, Larsen JN. Recording of natural sounds for hearing aid measurements and fitting. Masters thesis 2006: DTU, Ørsted.
- Hawkins DB. The effect of signal type on the loudness discomfort level. Ear Hear. 1980;1:38-41.
- Cox RM, Alexander GC, Taylor IM, Gray GA. The contour test of loudness perception. Ear Hear. 1997;18(5):388-400.
- Keidser G, Seymour J, Dillon H, Grant F, Byrne D. An efficient, adaptive method of measuring loudness growth functions. Scand Audiol. 1999;28(1):3-14.
- Suzuki Y, Abe K, Ozawa K, Sone T. Factors for perceiving sound environments and the effects of visual and verbal information on these factors. In: Schick A, Meis M, Reckhardt C, eds. Contributions to Psychological Acoustics: Results of the Eighth Oldenburg Symposium on Psychological Acoustics. 2000;Oldenburg:209-232.
Correspondence can be sent to Jürgen Kiessling at .
Citation for this article:
Kiessling J, Keidser G, Bentler R. The Output Verification Test: Toward a Tool to Clinically Verify the Output of Hearing Instruments Hearing Review. 2009;16(4):12-19.