With the advent of digital signal processing (DSP) technology in the hearing industry, there has been a rapid introduction of new capabilities in amplification. These improvements have been based on intriguing design goals, with the expectations of increased user benefit. However, in many cases, these technical improvements have been introduced at such an accelerated rate that the corresponding confirmation of true clinical benefit has not kept pace.
The introduction of programmable analogue circuitry in the early 1990s, followed by DSP platforms in the late 1990s, allowed for widespread use of multi-channel, wide dynamic range compression (WDRC) as a solution for sensorineural hearing loss. The use of programmable WDRC circuitry has been demonstrated as offering the patient more benefit than can be achieved via the use of high quality linear amplification.1-4
More recently, advanced second-generation digital (2G-DSP) technology has offered improved feature sets that have introduced new potential advantages beyond the core advantages of WDRC circuitry. For example, the Adapto product line has taken the core advantages of WDRC circuitry and added three important improvements: VoiceFinder speech processing, OpenEar Acoustics, and Client-Focused Fitting.5,6 The goal of the current study was to examine the patient benefit provided by these improvements compared to two well-established alternatives: Linear and WDRC.
What should be expected? When comparing Linear to the two nonlinear technologies, we would expect certain core benefits to be reflected in the results. For example, multi-channel nonlinear technology is designed to provide greater gain for soft inputs and better comfort, acceptability, and/or sound quality in louder environments due to the decrease in gain for more intense inputs. In addition, the fully automatic nature of nonlinear technology should provide more effortless use in the changing environments that many users experience throughout the day. When looking more closely at the expected differences between the two nonlinear options (WDRC and 2G-DSP), we would expect to see the unique features of the digital instrument make an impact on patient responses. For example, the larger vents provided by Adapto’s OpenEar Acoustics would be expected to lead to higher levels of physical comfort and sound quality. The gain changes used in the VoiceFinder when speech is not present should be reflected as a reported relief from annoyance. The personalized selection of the fitting rationale as part of Client-Focused Fitting should be reflected in improved generalized communication effectiveness.
In order to get a true estimate of the additional benefit provided by such advanced features, several important study design safeguards were used. For example, the study used a blinded design in order to minimize any bias based on expectations on the part of the subjects. New sets of in-the-canal (ITC) hearing aids for all three technologies were built for all patients in order to guard against any “old” versus “new” comparison. The study was conducted at 13 different audiological facilities to gain experience from a variety of settings, and the clinical staff at all sites were required to have met minimum numbers of fittings of all three technologies prior to the study in order to ensure fitting expertise. A variety of objective and subjective measures were used in order to guard against a one-dimensional view of hearing aid benefit.
Study Design
Test Facilities: 13 different audiological practices agreed to participate in the study. Each of the facilities were required to have had completed fittings on at least 10 patients with each of the hearing aid models used in the study during the six months preceding the study. This requirement was instituted to ensure a minimal level of expertise with the particular hearing devices used. The practices were instructed to enroll patients from their normal patient population.
Subjects: 77 patients (36 males and 41 females) from across the 13 practices were included. Both new (n = 21) and experienced (n = 56) patients were enrolled. Of the experienced users, 40 were binaural users and 16 were monaural users. The average number of years of use was 9.5. In terms of technology for the experienced users, 39% wore DSP circuitry, 21% wore analog programmable, and 40% wore linear.
All patients were required to have sensorineural hearing loss within the fitting range of all three hearing aid models used (listed below). The average hearing thresholds for the subject group are displayed in Figure 1. These patients represent a typical population of hearing aid users seen by a dispensing practice.
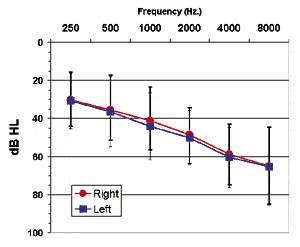
Figure 1. Mean audiogram (±1 SD) of the 77
patients in the study.
The mean age of the patients was 61.7 years old (range: 20-89 years). All patients were judged by the clinical staff at the participating clinics to be capable of completing all required tasks as described in the study protocol.
Hearing Aids: The Linear technology class was represented by the Oticon Ergo hearing aid. This product is a single-channel, analog programmable circuit. The product was fit to the NAL-R prescribed targets via OtiSet fitting software. The WDRC class was represented by the Oticon DigiFocus II hearing aid, a seven-band, two-channel DSP device. The product was fit to the “ASA2” fitting rationale via OtiSet software. The 2G-DSP class was represented by the Oticon Adapto5 device and was fit via Genie fitting software to either the Linear (n = 4), Fast (n = 44), Slow (n = 25), or Ski (n = 4) fitting rationale, depending on patient audiometric and demographic variables. The selection of different fitting rationales is an integral part of the Client-Focused Fitting process.
Patients with previous binaural experience were fit binaurally. Patients with previous monaural experience were fit to the same ear as their previous hearing aid. All new users were fit binaurally.
New hearing instruments in all three technology categories were constructed for all patients. The same earmold impression was used to create the shell for all three devices for a given ear. The Oticon production staff was instructed to produce all three hearing aids for a given ear to the same approximate size. The same production technician made all of the hearing aids for any given patient. The final instruments were examined by a production supervisor and one of the authors (RRP) to ensure similarity in overall size across the three devices for a given ear. All instruments were intended to be of the ITC style, although for a small number of smaller sized ear canals the devices were more accurately described as half-shells. No model names were used on the devices, only serial numbers.
Protocol: The patients wore each set of hearing devices for at least three weeks before any performance measures were obtained. The order of technology was randomly varied across the patients. The patients were informed only that there were three different types of hearing aids to be evaluated: one had a volume control (linear), one was fully automatic with a smaller vent (WDRC), and one was fully automatic with a larger vent (2G-DSP). Neither product names nor technology class indicators were used when describing the devices to the patients. Rather, they were referred to as the first, second, or third set. They were not informed of the presence or absence of DSP technology in any of the devices. All three technologies were programmed via the use of the PC and fitting software, so there was not an apparent difference to the patients as to technology level used in one product or another.
The patients were seen over a series of at least five scheduled sessions. In the first session, the purpose and design of the study was explained, an updated audiogram was produced, and earmold impressions were obtained. In addition, the Client Oriented Scale of Improvement (COSI)7 was used to elicit up to five different patient goals, in order of importance, for the new fitting.
At the second session, the first set of devices was fit. The first time that one of the two fully automatic options was fit, the Adaptation Manager was set to Step 1 for new users and Step 2 for experienced users. The patient returned within the first week to have the Adaptation Manager moved to Step 3. Other than that specific process, the clinical staff was encouraged to fit the patients to the prescribed device settings, with fine tuning used only if acoustic feedback or loudness tolerance precluded use of the devices. If needed, the patients were seen within the first week of the fitting of any of the devices for patient-initiated fine tuning. However, this option was used infrequently.
At the third session, the performance with the first set of devices was measured and the second set of devices was fit. At the fourth session, the performance with the second set of devices was measured and the final set of devices was fit. At the fifth session, performance with the final set of devices was evaluated and then a subjective comparison across the three sets of devices was obtained.
Performance Measures: Two types of measures were obtained: 1) performance indicators collected for each technology independently and immediately after the patient had been using a given set of devices, and 2) subjective preference comparisons made across all three technologies after the final use period.
• COSI Performance: After using each technology, the patient rated how successfully they performed with amplification on each of the stated goals. The patient used a 1 to 5 scale, with 1 representing “Hardly Ever” and 5 representing “Almost Always.”
• Word Recognition Performance: Percent correct word recognition scores were obtained in the soundfield with speech presented at 40 dB HL in quiet, at 60 dB HL in cafeteria noise (+10 dB SNR), and at 70 dB HL in cafeteria noise (+5 dB SNR). These conditions were designed to replicate, respectively, listening in quiet, listening in moderate noise, and listening in high noise environments. The CD version of the W-22 50-word lists was used, and speech and noise signals were presented at 0° azimuth.
• Situational Ratings: A locally developed questionnaire was administered to assess perceived performance using each technology in a variety of listening environments. Briefly, the patient was asked to use a five-point scale to rate perceived performance in the following environments (the scale was administered orally, as the patient did not see the document): 1) Cosmetics; 2) Overall Sound Quality; 3) Understanding Speech in Quiet; 4) Understanding Speech in Café/Party Noise; 5) Understanding Speech in Traffic Noise; 6) Acceptance of Loud, Non-speech Signals; 7) Physical Comfort; 8) Reduction of Day-long Annoyance; and 9) Transient Acoustic Feedback. A score of 1 represented “Very satisfied” and 5 represented “Very dissatisfied.”
• Situational Preferences: After using all three technologies, the patient was asked to express a preference in four different listening environments: 1) Physical comfort; 2) Easiest to use all day; 3) Overall sound quality ; and 4) Speech understanding in noise. The patient was allowed to select “No Preference” in any of the environments.
• Overall Preference: The patient was asked to select one of the sets of hearing aids as the overall preference. In addition, in an open response format, they were asked to provide the three most important reasons attributing to this overall preference. (Readers may view the study questionnaires on the Web version of this article found at www.hearingreview.com.)
Results
Table 1 summarizes the major findings of this study. There is: 1) A general tendency for the 2G-DSP instrument (Adapto) to clearly outperform Linear; 2) A tendency for WDRC to outperform Linear on many dimensions; and 3) A tendency for the 2G-DSP instrument to outperform WDRC on certain dimensions. Specifically:
|
||||||||||||||||||
| Table 1: Summary of results. The instruments tested were a linear single-channel device (Linear); a first-generation DSP two-channel device (WDRC); and a second-generation DSP (2G-DSP) device (Oticon Adapto). |
• COSI Performance: All 77 patients expressed at least two COSI goals and 75 patients expressed a third goal. The ability to formulate a fourth and fifth goal was inconsistent (n = 55 for a fourth goal and n = 26 for a fifth goal). Therefore, mean results for only the first three goals were analyzed.
The COSI goals were categorized following the scheme presented by Dillon, Birtles & Lovegrove.8 For the first goal, the two most common goal categories were “Conversation with 1 or 2 persons in quiet” and “Conversation within a group in noise.” For the second goal, the most common categorizations were “Conversation with 1 or 2 Persons in Quiet,” “Conversation within a Group in Quiet” and “Conversation within a Group in Noise.” For the third goal, the most common categorizations were “Conversation with 1 or 2 Persons in Quiet,” “Conversation with 1 or 2 Persons in Noise” and “Familiar Speaker on the Phone.”
In Figure 2, mean rated performance increased when moving from Linear to WDRC and then to 2G-DSP for all three goals. A factorial ANOVA revealed a significant (p<. 01) effect of technology and non-significant goal and interaction effects. These results indicate that mean differences from one technology class to another were statistically significant on a consistent basis across all three goals.
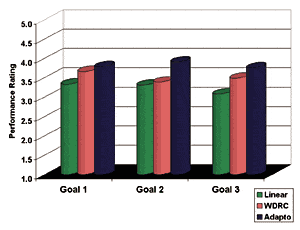
Figure 2. Mean rated COSI performance on
the three most important goals, as nominated
individually by the patients.
Follow-up testing revealed a highly significant (p<. 01) improvement when comparing Linear to 2G-DSP, and also significant (p<. 05) differences when comparing Linear to WDRC, and WDRC to 2G-DSP. In other words, as the technology class became more sophisticated, the perceived ability to meet the patient’s personalized goals were improved.
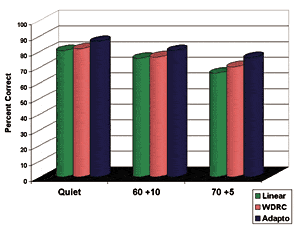
Figure 3. Mean word recognition in Quiet,
Moderate noise (60 dB HL, +10 dB SNR), and
High Noise (70 dB HL, +5 dB SNR) for 50-word
lists of the W22 test.
• Word Recognition Performance: Figure 3 provides the mean word recognition results for the three listening environments for all three technologies. The differences between the technologies became more pronounced as the listening task became more difficult. A factorial ANOVA revealed significant (p<. 01) effects of level (as would be expected) and technology, with a non-significant interaction effect. These results indicate, again, that the improvement afforded by higher technology classes was consistent across the test environments.
• Situational Ratings: Figure 4 provides the mean ratings of performance across the 10 environments for each of the technologies. In all situations, the mean ratings typically improve when moving from Linear to WDRC, and then to 2G-DSP. The differences between Linear and the two nonlinear options are most pronounced for the “Non-speech,” “Annoyance,” and “Changing Environments” questions. Pronounced differences between WDRC and 2G-DSP exist for the “Speech in Quiet” and “Feedback” questions.
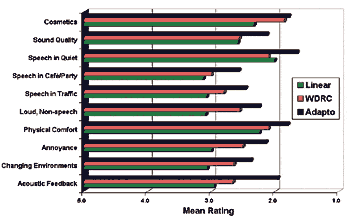
Figure 4. Mean situational ratings across 10
environments for the three technologies. A rating of 5
indicated “Very dissatisfied” and a rating of 1
indicated “Very satisfied.”
A factorial ANOVA revealed significant (p<. 01) effects of environment and technology, with a non-significant interaction effect. These results indicate that, although the ratings generally varied from environment to environment, the differences between the technology classes tended to be consistent across the 10 situations. Follow-up testing revealed significant (p<. 01) overall improvements when comparing Linear to 2G-DSP, Linear to WDRC, and WDRC to 2G-DSP.
To provide more detail, ANOVAs were conducted for each of the 10 situations individually. In all cases, the 2G-DSP technology was rated significantly (p<.01) more positive than Linear. In the following conditions, 2G-DSP was rated significantly (p<.05) more positive than WDRC: Sound Quality; Speech in Quiet, Speech in a Café or Party Environment, Speech in Traffic and Acoustic Feedback. In the following four conditions, WDRC was rated significantly (p<.05) more positive than Linear: Cosmetics, Loud Non-speech Sounds, Annoyance and Changing Acoustic Environments.
• Situational Preferences: The patient preferences across the four listening environments are presented in Figure 5. There is a clear preference for 2G-DSP over the other two technologies in all four environments. The relatively high rate of “No Preference” on the “Physical Comfort” dimension likely reflects the effort to carefully produce all three sets of devices to the same overall size and fit, especially since they were made from the same earmold impression. The fact that 2G-DSP was selected much more often than either of the other two alternatives likely reflects the additional effect of the larger vent.
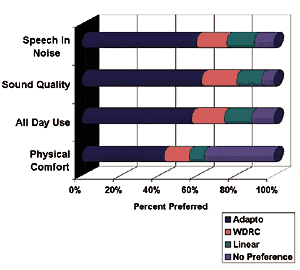
Figure 5. Preference rates for the three
technologies across the four listening environments.
For those patients expressing a preference, the rate of selection of 2G-DSP was statistically (p<. 01) greater than chance in all four environments.
• Overall Preference: Figure 6 provides the rate of Overall Preference across the three technologies. (“No Preference” was not an option for this question.) Three quarters (74%) of the patients (57 of 77 subjects) selected 2G-DSP, with 12 of the remaining patients choosing WDRC (16%), and eight choosing Linear (10%).
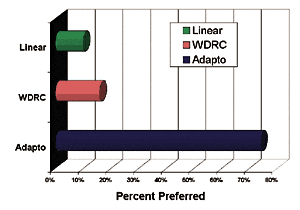
Figure 6. Overall preference rate for the three technologies.
The most common primary reason for selecting 2G-DSP was “Comfort,” “Sound Quality,” and “Speech Understanding.” The reasons for selecting WDRC were not consistent, but the most commonly mentioned reason was “Sound Quality.” For those patients selecting Linear, seven of the eight patients mentioned the presence of a volume control as either the first or second most important reason leading to an overall preference. No other reason was mentioned consistently across this small group of patients.
• Volume Control Follow-up Study: The desire for a volume control by a subset of patients who have had experience with fully automatic instruments has been documented.3 (Also see Sergei Kochkin’s article on the value of volume controls in this issue of HR.) Although these patients represent a minority of the users with advanced technology, it is important to be able to meet such an important, personalized need.
Since the inception of the current study, an additional model of Adapto has been released that includes the option of a volume control wheel. Seven of the eight patients who selected Linear as their overall preference have subsequently been refit with a newer model of Adapto with a volume control wheel. The patients were given a new three-week use period with the volume control model. Although this new model is larger than the ITCs used in the main study (typically produced as a half shell), all seven of those patients have changed their preference to the 2G-DSP device as long as they had the availability of a volume control. Situational ratings and preferences have all consistently been in favor of 2G-DSP compared to Linear despite the original preference for Linear.
• New vs. Experienced Users: A variety of analyses were performed to see if the new users provided data that was significantly different than the experienced users. In terms of Overall Preference of the new users, 14 chose 2G-DSP, 5 chose WDRC, and 2 chose Linear. These proportions are not significantly different than the experienced users.
On several other performance dimensions, such as COSI Performance, Word Recognition, and Situational Ratings, the new users demonstrated, on average, better performance than the experienced users. However, the new users also had between 5 dB-10 dB better hearing in the mid and high frequencies compared to the experienced users. There were significant correlations between hearing loss and performance on dimensions such as COSI, Word Recognition, and Situational Ratings for the group as a whole. Such high correlations are common in studies such as this.9 Therefore, the better performance demonstrated by the new users on the performance measures is most likely related to their better hearing and not necessarily related to their hearing aid experience.
In general, these results indicate that the 2G-DSP device appears to be an effective treatment option for those both with no experience and with extensive hearing aid experience. Previous work6 indicated that new users did not appreciate the beneficial effects of OpenEar Acoustics as much as experienced users (although they still provided positive ratings about the product overall). However, in the more comprehensive current study, ratings on dimensions such as Physical Comfort and Sound Quality (ie, factors that are expected to be positively impacted by large vents) were as positive for new users as for experienced users. In the previous study, new users were fit only with Adapto, and thus could only compare to the condition of using no hearing aid. In the current study, new users were fit with all three options, so they could compare closed versus open fittings.
Discussion
What conclusions can we draw from this study?
• The fact that patients performed significantly better with the second-generation DSP devices (2G-DSP) compared to Linear on every dimension studied in a blinded design establishes the superiority of the advanced digital design of this product.
• 2G-DSP outperformed the digital WDRC on several key dimensions (ie, Overall Preference, Easiest to Use All Day, Physical Comfort, Acoustic Feedback, and various measures of speech understanding in noise), indicating that Adapto combines both the general benefits of nonlinear sound processing with the features of OpenEar Acoustics, VoiceFinder, and Client-Focused Fitting.
• Patients experienced specific advantages when using WDRC compared to Linear (ie, Speech Understanding, Acceptability of Loud, Non-speech Signals, Acceptability in Changing Acoustic Environments), re-affirming the well-known general advantages of multi-channel, non-linear processing.
Some other specific observations can be made. The ability to institute a blinded design in a clinical study using actual production units is infrequent in the literature. Several design features were included in this study to minimize the effects of bias. The patients were provided with three new sets of hearing aids, with no indication of differences in technology. All three sets were programmable and were built to a similar size. All clinicians who performed the fittings were familiar with the three models used in the study. Importantly, not only were measures of side-by-side preference made (Situational Preferences, Overall Preference), but the COSI, Word Recognition, and Situational Ratings were performed independently for each technology. In other words, patients did not have access to their ratings from the first device used when providing ratings for the second or third set. Any mean differences between technologies are that much more robust.
Due to the lack of an agreed-upon “Gold Standard” for hearing aid performance, this study used a variety of outcome measures. The fact that the ranking of technologies was extremely consistent across a wide variety of measures is strong evidence that there are true advantages for patients of the more advanced options.
Another unique feature of this study was the use of the COSI as an outcome measure. Although this tool has gained widespread acceptance as a clinical tool, its use as a research tool has been limited. However, use of this tool has allowed us to demonstrate, compared to traditional Linear technology, the effectiveness of WDRC and especially DSP at meeting patients’ individually stated needs.
| This article was submitted to HR by Donald J. Schum, PhD, vice president of audiology & professional relations, and Randi R. Pogash, MS, manager of clinical evaluations of Oticon Inc, Somerset, NJ. Correspondence can be addressed to HR or Donald Schum, PhD, Oticon Inc, 29 Schoolhouse Road, Somerset, NJ 08873; email: [email protected]. |
References
1. Goedegebure A, Hulshof M, Maas R, Dreschler W, Verschuure H. Effects of single-channel phonemic compression schemes on the understanding of speech by hearing-impaired listeners. Audiology 2001; 40:10-25.
2. Kam A, Wong L. Comparison of performance with wide dynamic range compression and linear amplification. J Amer Acad Audiol 1999; 10:445-457.
3. Kochkin S. 10-year customer satisfaction trends in the US hearing instrument market. Hearing Review 2002; 9 (10):14-25, 46.
4. Verschuure H, Prinsen T, Dreschler W. The effects of syllabic compression and frequency shaping on speech intelligibility in hearing impaired people. Ear and Hear 1994; 15:13-21.
5. Schum D, Pogash R. Adapto: An introduction to the new generation of digital amplification [AudiologyOnline Web site]. January 17, 2001. Available at: http://www.audiologyonline.com.
6. Schum D, Pogash R Initial clinical verification of a DSP instrument. Hearing Review 2002; 9(9):48-51.
7. Dillon H, James A, Ginis J. Client Oriented Scale of Improvement (COSI) and its relationship to several other measures of benefit and satisfaction provided by hearing aids. J Amer Acad Audiol 1997; 8:27-43.
8. Dillon H, Birtles G, Lovegrove R. Measuring the outcomes of a national rehabilitation program: Normative data for the Client Oriented Scale of Improvement (COSI) and the Hearing Aid User’s Questionnaire (HAUQ). J Amer Acad Audiol 1999; 10:67-79.
9. Humes L. Factors underlying the speech-recognition performance of elderly hearing-aid wearers. J Acoust Soc Amer 2002; 112:1112-1132.

