Dispensing professionals reported that in 2001, hearing instrument prices decreased, gross revenues increased due to a greater percentage of digital sales, and profits stayed largely the same as in the previous 5 years, according to the results of the annual Hearing Review Dispenser Survey. The survey, which was conducted in April 2002, was sent at random to 750 dispensing hearing health care offices. One-quarter (26%) of the questionnaires were returned (Figure 1), representing 191 hearing care offices/practices—about 2%—in the US.
|
|

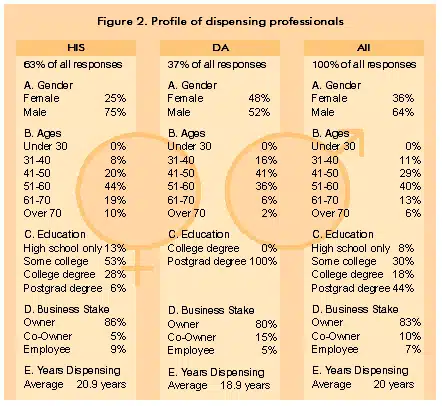
Respondents to the survey were overwhelmingly the owners (83%) or co-owners (10%) of businesses/practices (Figure 2). Sixty-three percent of those responding to the survey were hearing instrument specialists (HIS), and 37% were dispensing audiologists (DA). The average respondent was male, (64%, HIS 75%; DA 52%) between the ages of 41-60, with 20 years of experience in dispensing hearing instruments. There was a marked difference between the ages of the two professions. Seventy-three percent of hearing instrument specialists were 51 years or older, while 57% of dispensing audiologists were age 50 or younger. In terms of education, 87% of the hearing instrument specialists had either some college or college degrees (6%), while all audiologists had post graduate degrees.
The Average Office/Practice
Dispensing Affiliations. Although corporate retail consolidation continues to make a large impact on the hearing industry, three-quarters of the offices (74%, HIS 69%; DA 79%) that responded to this year’s survey were independently owned directly by the hearing care professional (Figure 3). Nearly half (45%, HIS 48%, DA 41%) of the offices reported no affiliation with any kind of network. Twenty-nine percent of all professionals belonged to an independent national network or buying group (eg, AHAA, Marcon, Audiology Co-op), with two in five (38%) dispensing audiologist offices belonging to an independent network, compared to one in five (21%) hearing instrument specialist offices. Eleven percent of survey respondents (HIS 15%; DA 6%) reported that their offices were affiliated with a traditional hearing instrument manufacturer network (eg, Beltone, Miracle Ear), while 14% were affiliated with, but not owned by a corporate retail chain like Sonus or Hearx (HIS 15%; DA 13%). Only 1% were actually owned by these corporate chains (HIS 1%; DA 0%).
Number of Offices and Practice Settings. A majority (60%) of dispensing professionals reported running only one office/practice (Figure 4), and little difference between HIS and DA-owned businesses was found in this respect. Nineteen percent of respondents owned two offices, 9% owned three offices, and 13% owned four or more offices. About nine in 10 of these dispensing offices were located in a private practice (63%, HIS 54%, DA 74%) or retail (29%, HIS 44%, DA 11%) setting.

Most of the businesses in this year’s survey were located in areas that serviced populations of 50,000-500,000 (53%, HIS 52%, DA 56%), with HIS-owned offices more likely to be located in rural areas (populations of 25,000 or less) than DA-owned offices (15%, HIS 20%; DA 9%). About one-quarter (24%) of the dispensing offices were located in cities having populations greater than 500,000 people.
Staffing and Dual-Profession Offices. On average, there were 2 dispensing professionals per dispensing office/practice (Figure 5). For the first time in the survey’s history, more audiologists reported that their offices employed hearing instrument specialists (24.2%) than vice versa (15.6%). As reflected in previous surveys, approximately one in five hearing care offices reported employing both audiologists and hearing instrument specialists, suggesting that there are approximately 2,400 offices in the US that have the two professions working side-by-side (Figure 6).
Unit Volume Sales. Hearing care professionals continue to report fairly low dispensing volumes (Figure 7). More hearing instrument specialists (59%) reported dispensing 20 or fewer units than dispensing audiologists (48%). Likewise, dispensing audiologists were more likely to dispense 30 or more aids per month (33% of offices) than hearing instrument specialists (23%). Overall, the majority (55%) of dispensing offices sold 20 units or fewer per month in 2001 (Figure 8, see page 21). For audiologists, this figure has remained the same for at least 20 years, while hearing instrument specialists in the 1980s were much more likely (46% of offices) to dispense between 21-50 hearing aids per month.1

Dispensing professionals indicated that 2001 was fairly flat relative to unit volume sales, with 70% of survey respondents indicating that their unit sales had either decreased (26%) by an average of 13% or remained the same (34%) (Figure 9). Compared to last year’s survey, 9% more hearing care businesses/practices reported a decrease in their unit volumes (26% in 2001 vs 17% in 2000).12 These figures support Hearing Industries Association (HIA) figures3 suggesting that unit volumes for non government (eg, non-VA) dispensing offices actually witnessed declines in unit volumes by 2.1% in 2001—or about three hearing aids per dispensing office.4 An increase in the units sold was reported in 40% of all offices/practices by an average of 15%—with 14% more dispensing audiologists reporting increased sales than did hearing instrument specialists.
Gross Revenues. One in five (20%) dispensing offices reported earning less than $100,000 in gross revenues, while about half (53%) had gross incomes ranging from $100,000-$500,0000 (Figure 10). Seventeen percent of offices experienced gross revenues of $501,000-$1 million, and 10% reported gross revenues exceeding $1 million. Over half of HIS-owned offices (56%) reported that their gross revenues were $250,000 or lower, while only one-third (31%) of DA-owned offices had gross incomes below $250,000. Dispensing audiologists were also more likely to report that their gross revenues exceeded $500,000 (DA 35%; HIS 22%).

When viewed next to the above unit volumes statistics, it can be seen that the higher priced digital and programmable instrument markets—which comprised 59% of 2001 unit volumes3 and an estimated 74% of gross revenue4—had a large effect on how dispensing professionals fared during the past year. About half (52%) of all dispensing professionals reported that their gross revenues increased by an average of 16% in 2001, while 24% said gross revenues decreased by an average of 15%. An equal number (24%) said revenues remained at Y2000 levels (Figure 11). As with unit volumes, offices/practices owned by dispensing audiologists were more likely to report increased gross revenues (61% reporting increases by an average of 16%) than those offices owned by hearing instrument specialists (46% reporting increases by an average of 15%).
Net Profits and Salaries/Compensation. Almost half (46%) of all dispensing offices/practices reported that their net profits in 2001 fell below $50,000, and nearly three-quarters (72%) of all offices netted less than $100,000 (Figure 12). The majority (51%) of dispensing audiologists said their net profits were between $51,000-$250,000, while the majority (54%) of hearing instrument specialists said that their net profits did not exceed $50,000. Eleven percent of all dispensing professionals reported net profits exceeding $250,000 (HIS 9%; DA 13%).

When discussing net profits, it should be noted that the majority of offices are owned and operated by the dispensing professional who often pays him/herself an annual salary (and/or draws income from the business profits when appropriate). The 2002 survey indicated that hearing instrument specialist and audiologist business owners in 2001 had declared salaries of $72,364 and $99,167 respectively (Figure 13, see page 23). On average, these owners earned $84,277. A hearing instrument specialist working in a DA-owned office earned $38,750, while an audiologist working in the same setting earned $50,167. An audiologist working in an HIS-owned office earned $49,818, while a hearing instrument specialist earned $52,037. (Editor’s note: Due to its personal nature, only about half of all returned surveys contained information on salaries. Because of this smaller sample size, care should be taken when considering these figures.)
About half (47%) of all dispensing professionals are paid via a fixed salary (HIS 41%, DA 55%), and 38% are paid using some kind of salary-plus-commission arrangement (HIS 39%, DA 36%). Commission-only salaries were used in 13% of the offices/practices (HIS 16%, DA 9%), while a commission-plus-expenses system was use in only 3% of offices (HIS 5%, DA 0%).

Hearing Instrument Fitting and Dispensing Trends
The Increasing Influence of High Performance Aids. The survey indicates that digital instruments now make up 39% of all hearing aid sales, while programmable instruments make up 29% of sales (Figure 14a). These statistics are close to the Q4 2001 statistics collected by the HIA (31% and 32% respectively).3 The rapid growth in popularity of digital instruments is readily apparent when looking at Figure 14a. HR surveys indicate that, in only 5 years, digital instrument use has increased from 6% to 39%. For the first time, it appears that programmable instruments are losing market share to digital aids, falling in usage by eight percentage points, from 37% in 2000 to 29% in 2001.
About one-third (32%) of all hearing instruments dispensed are analog aids, according to the survey, which compares favorably to HIA figures of 37% in the Q4 2001.3 The bottom has appeared to have fallen out of the analog non programmable non linear market; only 11% of all hearing aids sold in 2001 were of this technology type compared to 38% in 1997. Presumably, the lower-priced segment of programmable (and perhaps even DSP) instruments have cannibalized the market share of these instruments.
This year’s survey indicates a higher usage rate of digital instruments among audiologist-owned (46%) versus hearing instrument specialist-owned (35%) practices/offices, and this has been a trend during the last 4 years (Figure 14b). However, what should not be overlooked is that hearing instrument specialists more than doubled their usage rate of digital aids in 2001—from 17% in 2000 to 35% in 2001. Hearing instrument specialists tend to rely more on analog non programmable linear aids (26% of instruments dispensed) than do audiologists (14%)
Hearing Instrument Styles. Little has changed in terms of instrument styles (Figure 15) during the past 5 years, according to survey statistics, except that CIC use has increased from 16% in 1996 to 23% today. ITE use has declined concomitantly by 8% during the same period, and BTE usage has remained about the same.
HIA figures3 suggest essentially the same thing. Digital instruments (and possibly directional instruments) have probably increased the use of BTEs (to 21.9% in 2001). CICs (making up 15% of all instruments sold) have experienced a 33% increase since 1998, due to their use in high-end digital sales—CICs account for 24% of all DSP fittings. According to HIA, ITCs account for 21.5%, half-shell ITEs 8.6%, full-shell ITEs 31.1%, and other ITEs 1.8%.3

Directional, Starter, and Disposable Hearing Instruments. Probably no other technological feature in recent years has caught the attention of both manufacturers and dispensing professionals more than directional instruments. This year’s survey indicates that 22% of all the instruments dispensed in 2001 were directional (Figure 16). This number is not altogether surprising when considering that a large percentage of new digital and programmable instruments being introduced feature some provision for directionality in BTE, ITE, and even some mini-ITE configurations. Directional hearing instruments accounted for 17% of all HIS-owned office hearing aid sales, and 29% of all DA-owned office/practice sales. Again, this difference between professional offices is probably a reflection of the greater percentage of DSP and programmable instruments dispensed from the DA-owned offices. The percentage of directional instrument usage is almost sure to grow substantially in the years to come, along with other options (eg, FM and array mics) for fighting background noise.
Survey respondents reported that starter aids—lower priced hearing instruments designed to entice the reluctant first-time user to try amplification—accounted for 7% of their hearing aid sales (HIS 6%, DA 7%). (Editor’s note: There was some obvious confusion on the questionnaire relative to the definition of a “starter” device, and some answers were discarded due to their implausibility (eg, 100% of sales). Thus, care should be taken when considering this figure.) Disposable aids (ie, Songbird) accounted for 1% of reported hearing aid sales (HIS 1%, DA 1%).
Binaural Fittings: It is widely accepted that the increase in binaural hearing instrument fittings is responsible for higher industry unit volume growth in the 1980s and early-1990s. In 1983, binaural instruments accounted for less than one-third (29%) of all fittings1 (Figure 17, page 21). Ten years later, they accounted for over half of all fittings, and this trend of increasing binaural usage continued throughout the decade of the ‘90s. As expected, however, the percentage of binaural fittings is now starting to edge toward a saturation point—probably somewhere between 70%-80%. In 2001, 71% of all the fittings were binaural (HIS 71%, DA 71%), compared to the Y2000 reported rate of 72% (HIS 75%, DA 69%). MarkeTrak VI data5 suggest that 74.2% of all hearing instrument purchasers are fitted binaurally. The effects of this binaural saturation point has probably played a large role in retarding year-end unit volume growth numbers.
Using HIA unit sales statistics3 along with the above survey statistics, it can be seen that there were about 559,300 consumers who purchased monaural aids, and 684,600 consumers who purchased binaural aids. In other words, a total of 1.24 million consumers purchasing hearing aids in 2001, which is about 8,700 more people than in Y2000.
Hearing Instrument Pricing and Third-Party Payors: The impact that digital instruments have had on pricing and sales—as well as the entire market in general—can hardly be overstated. When all the data are analyzed, a complex picture of the market emerges. The average price of most styles and technologies of hearing instruments decreased in 2001 (Figure 18); however, the average overall price of hearing instruments continued to go up slightly due to the increased use of digital instruments—instruments that command significantly higher prices. When applying these survey price figures to HIA statistics,3 the average price of a hearing instrument in 2001 was $1,520. This represents a $40 increase over 2000—or a 2.7% price increase. But, considering the recent flat market, this increase is substantially lower than the typical 7%-14% increase in gross revenues experienced by dispensing professionals in the past 3 years, and may be a harbinger of a new era of falling prices, lower gross revenues and a greater urgency to attract new customers.
In particular, the average prices of analog ITE, ITC, and CIC style instruments decreased by 9%-11% compared to the previous year (Figure 18). The average prices for programmable (-1.4%) and digital (-4.3%) instruments also declined. Analog BTEs were the only style to increase in price (by 2.5%), possibly due to the increased use of directional microphones.
When extrapolating the pricing figures with HIA sales statistics,3 it can be seen that digital instruments made up the largest portion (42.5%) of the average dispensing professional’s gross revenue, followed by programmable instruments (32.5%). Sales of analog devices made up exactly one-quarter (25.0%) of all gross revenues.

Prices charged by HIS-owned versus DA-owned dispensing offices/practices for the various types of hearing instruments were fairly similar, usually not deviating by more than 5% (Figure 19). However, digital instruments tended to be more expensive in DA-owned offices than in HIS-owned offices, while programmable and non programmable non linear instruments tended to be slightly more expensive in HIS-owned offices (Figure 20, page 22).
It is important to realize that all of the above prices are based on the reports of dispensing professionals, the vast majority (74%) of whom “bundle” the costs of the hearing instruments into the price of the professional services and testing fees that are required for a successful fitting (Figure 21, page 22). HIS-owned offices itemized costs only 9% of the time. DA-owned offices itemized costs 48% of the time—a large increase from last year, when only 32% itemized. Unbundling of prices has been said to have advantages in positioning individual practices—as well as the profession—in assigning value to and getting paid for the myriad services offered by hearing health care practitioners.

It should be noted that the prices reported here probably do not fully reflect the impact of third-party, free, or discounted hearing instruments. For example, this year’s survey showed that 39% of all offices/practices deal with health maintenance organizations (HMOs) or other managed care entities (HIS 28%, DA 53%) (Figure 22a). This represents the first reduction in this statistic since 1995. Those dispensing professionals who indicated that they worked with third-party payers reported that 22% of their customers were covered by an HMO (HIS 13%, DA 27%)(Figure 22b). Knowles MarkeTrak VI5 figures for Y2000 indicate that when third-party payer, discounted, and free aids are considered, the average price of a BTE was $1,197, ITC $1,295 and ITE $1,009.

Hearing Instrument Brands. The complexity of programmable and digital instruments, along with the need for dedicated programming software (and familiarity with that software), may be driving dispensing professionals to economize the number of brands offered to clients/patients. However, in 2001, the number of brands carried by dispensing professionals was slightly higher than in 2000, according to survey respondents (Figure 23a). In last year’s survey (Y2000 statistics), the majority of offices/practices carried 2-4 brands of hearing instruments (55%, HIS 64%, DA 40%); in 2001, there was a more even split between those offices/practices carrying 2-4 brands (37%, HIS 37%; DA 37%) and those carrying 5-6 brands (34%, HIS 30%; DA 38%). Similar to Y2000 survey figures, dispensing audiologists were more likely to carry a larger number of brands, with three in five (60%) audiology practices reporting that they carried 5 brands or more, compared to 51% of hearing instrument specialist offices. Only 10% of all dispensing professionals’ offices/practices carried more than 10 brands of hearing instruments (HIS 12%; DA 8%), and a similar number reported that they were a single-line dispenser (8%, HIS 12%; DA 3%).

Reinforcing the theory that dispensing professionals are paring the number of instruments offered is the fact that the average business now dispenses three-quarters (72%) of all its hearing instruments from one brand (Figure 23b, see page 23). Dispensing audiologists reported a marked increase in this statistic (51% in 2000 to 67% in 2001). Hearing instrument specialists reported dispensing 76% from one brand in 2001, compared to 79% in 2000. Again, this trend makes sense when viewed from the perspective that dispensing professionals may feel more comfortable with a particular technology, audiological rationale, or fitting software program (not to mention other important factors, such as field representatives, volume discounts, and customer support) offered by a favored manufacturer. This may reinforce the need for manufacturers to concentrate on making deep product suites that represent easy-to-program products for a variety of consumer and dispenser needs.
Severity of Loss and Hearing Instrument Fittings. According to dispensing professionals, about three in five of the hearing instruments they fit are intended for clients/patients with moderate (40-70 dB HL) hearing losses (57%, HIS 55%, DA 61%). One in five hearing instruments goes to a client who has a hearing loss of more than 70 dB HL (23%, HIS 26%; DA 19%), and one in five goes to a client who has a mild loss below 40 dB HL (20%, HIS 19%; DA 20%). There has been some speculation that the incidence of mild loss fittings would increase with the advent of CICs, starter, and disposable instruments. However, survey statistics currently show no evidence for this.
Return rates. The rate of hearing instrument returns (Figure 24b, see page 23) in 2001 as reported by dispensing professionals was 8% (HIS 7%; DA 10%), which was essentially unchanged from last year’s survey (7%, HIS 7%; DA 8%). However, dispenser reported return rates for CICs increased to 9% (HIS 7%; DA 12%) from 6% in 2000. Dispensing audiologists in particular reported higher return rates compared to 2000 for the more premium end products of CICs, programmable, (13% compared to 7%) and digital (17% compared to 8%) products.

It should be noted that dispensing professionals and manufacturers tend to define a return differently. Manufacturers, unlike dispensing professionals, report any instrument that requires replacement as a “return for credit.” This includes exchanged instruments, remakes, and those aids that cannot be repaired. Conversely, dispensing professionals tend to consider a return as the single set of instruments that are returned by the client because they chose not to purchase them, or instruments requiring replacement due to some defect. Additionally, certain methods of dispensing—including those that are greatly discouraged due to their cost to all parties (eg, letting a customer try out a number of aids at the same time) may also lead to divergent reports of return rates.
HIA-reported3 that return rates in 2001 were 19.1% for all instrument models and technology types.3 The nonprogrammable analog instrument return rate was 14.8%, programmable analog 15.5%, and digital 24.4%. The CIC return rate was 22.2%.3
Office Instrumentation. With only a few exceptions, the equipment used in offices has remained fairly unchanged for the past several years. Audiometers (100% of offices/practices), sound booths (82%), hearing aid analyzers (70%), video otoscopes (68%), and impedance (62%) and real ear (61%) equipment are currently the most common features of all dispensing offices (Figure 25, page 23). In 2001, substantial gains were seen in the use of sound booths by hearing instrument specialists (74%, up from 64% in 2000), and in the use of video otoscopes by audiologists (62%, up from 42% in 2000). Dispensing audiologists also reported greater utilization of hearing aid analyzers (85%, up from 77% in 2000). OAE, ABR, and ENG equipment was found in about one in five audiologist-owned offices, and less than 2% of hearing instrument specialist-owned offices.
The Clients/Patients of Dispensing Professionals
Age of clients/patients. Nearly three-quarters of the customers purchasing hearing instruments at HIS-owned offices, and two-thirds of the customers purchasing instruments at DA-owned offices are over age 65 (Figure 26). Overall, this year’s survey indicates that 69% of all those purchasing hearing instruments are over age 65. This compares favorably with Kochkin’s MarkeTrak VI5 data, which indicate that 65.1% of hearing instrument owners are over age 65. The survey also indicates that 20% of all clients/patients are 45-65 years old (MarkeTrak VI: 26.7%5), 6% are 30-44 years old, and 5% are younger than age 30 (MarkeTrak VI: 4.8%5).

As with past surveys, hearing instrument specialists indicated they served more seniors than dispensing audiologists (HIS 73% of customers vs DA 64%), while audiologists serve nearly twice as many people under age 30 than hearing instrument specialists (HIS 3%, DA 9%). Of course, this is greatly aided by the fact that children (<18 years) are served almost exclusively by audiologists (HIS 1%, DA 6%).
First-time Clients. Only 45% of patients/clients purchasing hearing instruments in 2001 were first-time users who had never purchased hearing aids previously (HIS 44%, DA 46%) (Figure 27). Put another way, 55% of all hearing instruments are dispensed to people who already use the devices.
Obviously, this fact is not doing anything to help grow the market. It is evident that during the industry’s fastest period of growth, during the 1980s, first-time user rates exceeded 60% (Figure 28).1,6,7 In 1983, 75.6% of those purchasing hearing instruments—three out of four purchasers—had never previously owned an aid. Slightly more than 20 years later, that figure has declined by more than a third.

How bad is this? Consider that in 1983, there were 891,000 total purchasers of hearing aids (when taking into account binaural/monaural user rates); of these, 673,000 people were first-time users. In 2001—nearly 20 years later—there were 40% more purchasers (1,244,000 people total) of instruments, but only 560,000 first-time users. Clearly, the hearing health care field has a problem convincing people to come through its doors. When this is added to the fact that market growth can no longer come from binaural use and prices are beginning to decline across all hearing aid classes, it is apparent that something innovative needs to be done to initiate market growth.
Sources of New Clients. Word-of-mouth customer referrals continue to be the dominant method for bringing in new clients/patients (45%, HIS 50%, DA 40%) (Figure 29). Advertising accounted for 29% (HIS 36%, DA 22%) of new customers, while medical referrals (ie, physicians) accounted for 29% of dispensing audiologists’ new customers compared to only 6% of hearing instrument specialists’ new customers.

Non Purchasers and Reasons for Not Purchasing Aids. The percentage of potential first-time purchasers who come into an office, are diagnosed with a significant hearing loss, but choose not to purchase a hearing instrument, is reported by dispensing professionals to be 18% (HIS 18%, DA 17%).
When offered a list of six likely reasons why these potential customers chose not to purchase an aid, dispensing professionals estimated that 44% of the consumers balked at the price of the instrument; 33% were not convinced they needed a hearing aid; 11% were concerned about cosmetic/stigma issues; 6% declined purchase due to other (unstated) reasons; 4% were put off by feedback and/or occlusion; and 2% refused purchase due to poor sound quality. Answers of the two professions were nearly identical (within 3%) to each other.
Predictions and Outlooks for 2002
Predictions on 2002 Unit Volume. Compared to last year’s survey, slightly fewer dispensing professionals predicted that they would experience hearing aid unit volume gains in 2002 (59% by an average of 11% vs 62% by an average of 14% last year) (Figure 30, page 28). While this is not a poor number, experience with the survey suggests that respondents have a general tendency to be slightly over-optimistic when thinking about unit gains and revenues for the coming year. Thus, compared to previous surveys, where about 80% of respondents would predict unit gains, this year’s responses appear less optimistic.

As in previous surveys, dispensing audiologists were slightly more upbeat in their predictions, with about two-thirds (64%) predicting unit growth in 2002 by an average of 14%, while the other one-third predicting their volumes would remain the same (28%) or decline (8%) by an average of 6%. A more equal split was seen between hearing instrument specialists who predicted that their hearing aid unit sales would increase in 2002 (56%) versus those who predicted unit sales would remain the same (31%) or decrease (13%) by an average of 19%.
When referring back to reported actual increases/decreases in unit volumes, it can be seen that dispensing professionals have experienced far less gains during the past 3 years (Figure 31, page 28). This corresponds with HIA-reported figures that indicate unit volumes increased by 4%-9% between 1995-1998, then slumped below 2% from 1999-2001 (in fact, when VA sales are considered, figures indicate that private-practice dispensing gains have been nonexistent during the past 2 years).8

Predictions on 2002 Gross Revenues. Expectations for increases in 2002 gross revenues are also slightly reduced compared to previous years, but in all likelihood the popularity and higher prices commanded by digital instruments are buffering the effects of the slightly depressed unit sales. Sixty-one percent of respondents predicted that their gross revenues would increase by an average of 17% in 2002 (Figure 32). Thirty percent of dispensing professionals thought that their gross revenues would remain the same, while 9% thought their revenues would decrease by an average of 11%. Differences between the responses of hearing instrument specialists and dispensing audiologists relative to gross profits were fairly insignificant, with the exception that those HIS-offices predicting revenue decreases felt that their decreases would be much more pronounced (an average decrease of 17%).

When reviewing reported increases/decreases in gross revenues during the past 6 years (Figure 33, page 29), it can be seen that there was a gradual increase in gross revenues realized by dispensing professionals from 1996 until last year’s survey (Y2000). In 2001, roughly the same number of dispensing professionals indicated that their gross revenues increased versus those who indicated that their revenues decreased or stayed the same. This makes sense—as do the predictions related to 2002 gross revenues—when reviewing the information on the falling prices of hearing instruments shown in Figure 18 (page 22).

Office Work Load and Future Hiring. The survey also asked respondents to indicate how busy their offices were, and if they planned to add new staff members in the next 3 years (Figure 34, page 29). Only 7% of respondents (HIS 4%, DA 11%) reported that their offices were at full capacity (ie, they would either need to hire more staff or add more equipment in order to accommodate more clients). This represents a 5% decrease from last year’s survey (12%, HIS 9%, DA 15%), indicating that business has declined. Roughly equal numbers of dispensing professionals indicated that their offices/practices were at 90%-99% capacity (23%, HIS 23%, DA 23%), 75%-89% capacity (30%, HIS 26%; DA 35%), or 65%-74% capacity (21%, HIS 25%, DA 17%). One in four (23%) hearing instrument specialist offices indicated that their workload was below 65% capacity, while only one in seven (14%) dispensing audiologist-owned practices reported being below 65% capacity.

The future for hiring turned gloomier—but there still remain a lot of hearing care offices/practices looking to add professional staff. Dispensing audiologists, in particular, are more cautious about adding staff members compared to last year: 23% indicated that they expected to hire a staff member in the next year (compared to 30% in the last survey), while about half (47%) expected to add staff sometime in the next 3 years (down from 56%). About one-quarter (24%)of hearing instrument specialist offices are expecting to hire professional staff in 2002 (roughly the same percentage as last year’s survey), and 39% plan to hire another staff member in the next 3 years (down from 51%).
If these percentages are an adequate reflection of the potential job market, it would appear that there is a need for approximately 2,500 newly trained hearing care professionals in 2002, and 4,000-4,500 by the end of 2004. By all indications, it appears to be a job seeker’s market.
Other Dispensing Trends
Internet Use. The Internet has become a vital lifeline, similar to telephones and faxes, for many people in the hearing care field (Figure 35, page 32). This year’s survey saw large increases in the number of hearing instrument specialists having online access (84% compared to 62% during the previous year). Overall, when home use is included, the vast majority of dispensing professionals are now online (85%, HIS 84%, DA 86%).

Most dispensing professionals (54%) reported spending 1 hour or less each week online for hearing-related matters (HIS 63%, DA 44%). About one-quarter (23%) of survey respondents spend 2 hours online (HIS 20%, DA 25%), while 13% spend 3-4 hours online (HIS 11%, DA 14%). Twelve percent of dispensing professionals are online for 5 hours or more each week in hearing-related pursuits (HIS 6%, DA 15%).
Audiologists are relatively split in terms of where they conduct their hearing-related online activities. Slightly more than half (55%) do the majority of their hearing-related Internet activities at the office, while 45% do them at home. In contrast, hearing instrument specialists conduct the bulk of their hearing-related online activities at the office (69%), rather than at home (31%). Only 42% of dispensing professionals indicated that their business had a Web site (HIS 44%, DA 39%).
Although the majority of dispensing professionals have Internet access, the most common use of the Internet relative to hearing-related activities is for research (62% of respondents, HIS 52%, DA 73%), correspondence with colleagues (58%, HIS 51%, DA 66%), and for securing product information (52%, HIS 55%, DA 48%). Only one-fifth (22%) of dispensing professionals report that they purchase hearing-related items via the Internet (HIS 23%, DA 22%), and about one-third (30%) purchase other kinds of items/products online (HIS 38%, DA 21%). One quarter (26%) of all survey respondents said they used the Internet to correspond with clients/patients (HIS 22%, DA 31%). Twenty-nine percent of dispensing audiologists go online for CEUs or to upgrade their professional credentials compared to 10% of hearing instrument specialists.
Battery Sales, Purchases, and Labeling. Dispensing professionals estimate that their clients/patients purchase 55% of their hearing aid batteries directly from them (HIS 54%, DA 56%). Half of the respondents (49%) said they offered a battery club for their clients/patients (HIS 45%, DA 52%). Anecdotally, those dispensing offices that maintained a battery club seemed to have a higher client battery purchasing percentages than those without a battery club.
Nearly half (45%) of dispensing professionals indicated that they purchase their hearing aid batteries from a hearing aid manufacturer (HIS 41%, DA 49%), while 37% purchase their batteries from the battery manufacturer (HIS 35%, DA 39%). About one in six offices/practices (16%) purchase their batteries from a wholesaler or distributor (HIS 20%, DA 12%), while 2% indicated other purchasing sources (HIS 4%, DA 0%).
The majority of dispensing offices/practices (52%) now carry batteries that have the name of their office/practice on the battery packaging (HIS 48%, DA 56%). About one-third (36%) use the battery manufacturer’s label (HIS 34%, DA 40%), and only 12% of offices use batteries that are labeled with the name of a hearing instrument manufacturer (HIS 18%, DA 4%).
Diagnostic and Testing Equipment Purchases. Dispensing audiologists and hearing instrument specialists differ in their tendencies relative to where they purchase diagnostic and testing equipment. The majority (59%) of dispensing professionals purchase this equipment directly from the manufacturer (HIS 69%, DA 45%). However, about one-half (53%) of dispensing audiologists and one-quarter (24%) of hearing instrument specialists report that they obtain their equipment from special distributors. Five percent of all professionals said they purchased equipment from other sources (HIS 7%, DA 2%).
Key Findings
• Survey respondents reported that they use digital technology for 39% and programmable technology for 29% of their clients/patients’ fittings (Figures 14a and b, page 21).
• The average price of most styles and technologies of hearing instruments decreased in 2001 (Figure 18, page 22); however, the average overall price of hearing instruments continued to rise slightly due to the greater use of digital instruments. The average price of a hearing instrument in 2001 is now estimated by HR to be $1,520. This represents a $40 increase (2.7%) over 2000.
• The trend of increased binaural fittings is leveling off: binaural fittings equal 71% of all fittings (Figure 17, page 21).
• The majority of hearing aids dispensed in 2001 were purchased by people who already own a hearing aid (Figure 27, page 27). Fifty-five percent of patients purchasing a hearing aid were previous users, while only 45% were first-time users. This is in marked contrast to the early ‘80s when about three-quarters of all customers were first-time users.
• Only 40% of all dispensing professionals said their unit sales increased in 2001 (Figure 9, page 20). Almost an equal number (34%) said their unit volumes stayed the same, while 26% reported a decrease in units dispensed. About half (52%) of all dispensing professionals said their gross revenues increased in 2001, while equal numbers (24% each) said that their revenues stayed the same or decreased (Figure 11, page 20).
• Previous surveys9-12 have shown dispensing professionals to be fairly bullish when predicting how they will fare in the coming year; generally, 70%-85% of survey respondents predicted unit volume and revenue increases in these years. However, in the past 2 years, only about 60% of dispensing professionals have predicted this (Figures 30-33, pages 28-29).
• Seventy-one percent of dispensing offices/practices offer between 2-6 brands of hearing aids, which is about the same as last year (Figure 23a, page 23). However, the number of dispensing professionals reporting that they offer 5-6 brands of hearing aids rose dramatically—from 19% in last year’s survey to 34% in 2001. Continuing a trend seen in past HR Dispenser Surveys, the percentage of hearing instruments sold from an office’s most popular brand continues to increase: the average office dispenses nearly three-quarters (72%) of its hearing aids from one brand (Figure 23b, see page 23).
• Seventy-four percent of dispensing offices reported being owned by independent professionals with no ties to a corporate or manufacturer network. This year’s survey also indicates that 24% of audiologist-owned offices employ at least one hearing instrument specialist, while 16% of hearing instrument specialist-owned offices employ audiologists. This would amount to a total of about 2,400 hearing care offices.
Acknowledgements
The staff of The Hearing Review extends their deepest thanks to those professionals who took time out of their busy schedules to participate in this year’s survey. Without the valuable contributions of these respondents in filling out the three-page survey with more than 50 often-detailed questions, this report would have been impossible. No incentives, other than helping other professionals better understand the market, were offered. The willingness of these individuals to share information about their businesses/practices provides information that all hearing care professionals can use in years to come in their business planning.
The editor also extends thanks to Christina Jackson, an accountant in Two Harbors, Minn, for her excellent work in tabulating the questionnaires and formatting the data.
References
1. Cranmer KS. Hearing instrument dispensing—1983. Hear Instrum. 1983;34(5):9-12.
2. Strom KE. The HR 2000 Dispenser Survey. Hearing Review. 2001;8(6):20-42.
3. Hearing Industries Association. Quarterly statistics report for the fourth quarter 2001. Alexandria, Va: HIA; 2002.
4. Strom KE. Slouching into the new millennium: 2001 brings little market growth to the hearing industry. Hearing Review. 2002;9(3):14-22.
5. Kochkin S. MarkeTrak VI: The VA and direct mail sales spark growth in hearing aid market. Hearing Review. 2001;8(12):16-24, 63-65.
6. Cranmer KS. Hearing instrument market analysis. Hear Instrum. 1990; 41(5):6-10.
7. Grahl C. A dispenser yardstick: How to measure your 1992 performance. Hear Instrum. 1993;44(6):4-13.
8. Strom KE. An industry in transformation: Technology and consolidation lead hearing care into the new millennium. Hearing Review. 2001;8(3):28-44, 87.
9. Skafte MD. The 1996 hearing instrument market—the dispenser’s perspective. Hearing Review. 1997;4(3):8-36.
10. Skafte MD. The 1997 hearing instrument market—the dispenser’s perspective. Hearing Review 1998;5(6):6-32.
11. Skafte MD. The 1998 hearing instrument market—the dispenser’s perspective. Hearing Review. 1999;6(6):6-32.
12. Skafte MD. The 1999 hearing instrument market—the dispenser’s perspective. Hearing Review. 1999;7(6):8-40.


.gif)