Research | June 2016 Hearing Review
Findings of EuroTrak 2015 (ET 2015) and MarkeTrak 9 (MT9) worldwide studies about hearing loss and hearing aids, with a focus on the non-auditory benefits of amplification
The authors describe the methodology associated with the world’s largest consumer market surveys on hearing aids and hearing loss, and report their findings with a focus on the “non-auditory benefits” of hearing aids, including quality of life, relationships at home and work, sense of safety and independence, and mental health.
In 2009, the European Hearing Instrument Manufacturers Association (EHIMA) initiated EuroTrak (ET) in an attempt to better understand the nature of hearing impairment, as well as the prevalence and use of hearing aids, in three of Europe’s largest countries: Germany, France, and the UK.1 For the second round of EuroTrak in 2012, EHIMA partnered with different local hearing healthcare organizations and manufacturers’ associations across Europe (Italy, Denmark, Norway, and Switzerland) and in Japan, making EuroTrak the largest multi-country, hearing-related consumer survey so far.2 The most current results from the third round of EuroTrak 2015 include Germany, France, UK, Italy, and Switzerland.
MarkeTrak (MT) studies have been conducted every few years for more than 25 years in the United States by the Hearing Industries Association (HIA). The decision was made to conduct the 9th round of MarkeTrak in 2014 as a new baseline,3 converting from the traditional mail panel to an online panel for data collection. Subsequently, in addition to using similar questionnaires, both ET and MT now use the same method for data collection.
Survey Method
A short screening questionnaire was used to collect representative information about self-reported hearing loss and hearing aid ownership within the studied countries’ populations. The samples were weighted based on census information with respect to age and gender to calculate hearing loss prevalence (percentage of people with hearing loss) and hearing aid adoption rates (owners of hearing aids as a function of people with self-reported hearing loss). The screening survey was designed to recruit hearing-impaired people without hearing aids as well as hearing aid owners.
Authors’ Note: The reader should keep in mind that all data presented in this article are based on stated (self-reported) hearing loss, and thus will most likely differ from studies using objective measures of hearing loss, such as pure-tone threshold averages.
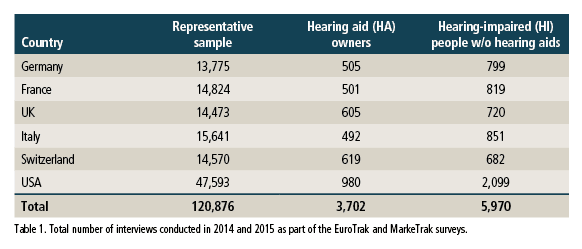
Sample sizes. Information about self-reported hearing loss and hearing aid ownership was collected from more than 120,000 people. Subsequently, a large number of online interviews were conducted, resulting in 3,702 interviews with hearing aid owners and 5,970 interviews with hearing-impaired people who do not yet own hearing aids. The distribution of the interviews across 6 countries is shown in Table 1. The largest number of interviews were conducted in the United States.
Basic Market Figures
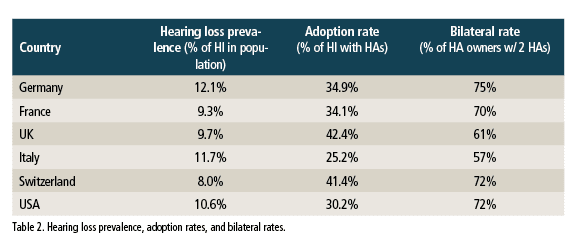
It would appear that those countries with lower financial barriers to obtaining hearing aids tend to have higher adoption rates. For example, in the UK where hearing aids are provided as part of the National Health System (NHS), the adoption rate is the highest among those countries surveyed. Switzerland, which has one of the highest per-capita incomes in the world, has the second-highest hearing aid adoption rate. It is possible that variations in healthcare systems, as well as cultural differences, can impact hearing help-seeking behavior and, ultimately, hearing aid ownership.

Hearing aid owners tend to be most satisfied in France, the United States and Switzerland, followed by Italy, Germany, and the UK. This general tendency is consistent with past studies except for the US, where satisfaction seems to have increased compared to past MarkeTrak studies. Swiss hearing aid owners reported the highest levels of satisfaction with the quality of counseling received (88%), while the Italians reported the lowest (79%). While the reported level of satisfaction with their HCP’s counseling was 91% in the United States, this data cannot be compared to the ET data as the question in the US was limited to the respondents’ experience with their HCP in the previous 5 years.
In terms of reported wear-time, the respondents reported wearing their hearing aids an average of between 8-9 hours per day across the nations surveyed —which is closer to “all day” than to “only in specific situations.” The respondents in the US reported the highest wear-time, but this data cannot be compared with the ET values as only daily hearing aid wearers were asked to respond to this question in the MT survey.
Beyond the Obvious
The most obvious benefit of amplification is improved audibility leading to decreased impairment, activity limitation, and participation restriction—what the World Health Organization (WHO) defines as disability.4 Hearing aids also appear to have “not so obvious” benefits. In recent years, for example, an increasing number of studies have investigated the relationship between hearing loss and depression, including the potentially positive contribution of professional hearing care.5-7 Similarly, the role of hearing aids and social engagement has been studied.8 Therefore, it was of particular interest for both the ET and MT9 studies to probe into these associations.
While it is likely that some of these non-auditory benefits are influenced by factors other than hearing, it is, nevertheless, impressive that many hearing aid owners reported several non-auditory benefits associated with their hearing aid use.

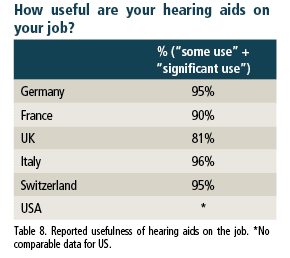
The data suggest that, on average, more than 8 of 10 hearing aid owners feel their hearing aids occasionally or regularly had a positive impact on their perceived quality of life, with residents of Switzerland reporting the highest positive impact.
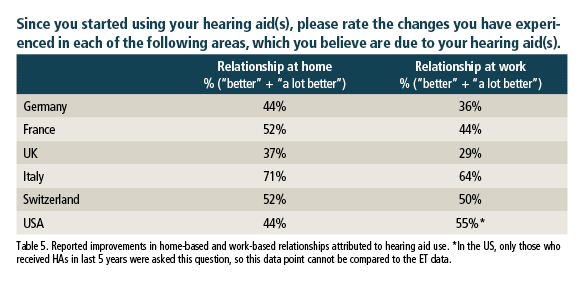
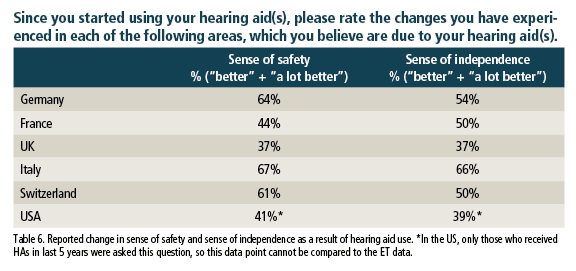
Based on the MT and ET data associated with quality of life, home and work relationships, and safety and independence, it would appear that hearing aids have a positive impact on the individual’s overall sense of well-being.

There was a tendency for those with hearing aids to report being less forgetful than individuals with hearing difficulty who did not wear hearing aids. The exceptions included Italy with high levels of reported forgetfulness among both hearing aid owners and non-owners, and Germany where the reported levels of forgetfulness did not differ between the two groups.
Better mental health. A report by the World Economic Forum and the Harvard School of Public Health9 in 2011 concluded that “the global cost of mental health conditions in 2010 was estimated at US$2.5 trillion, with the cost projected to surge to $6.0 trillion by 2030. About two-thirds of the total comes from indirect costs and the remainder from direct costs.” Indirect costs refer to the invisible costs associated with mental illness, such as lost productivity and income owing to disability or death.
Table 9 illustrates, as a function of country, the percentage of ET respondents who were identified as having an increased probability of depressive disorders based on their PHQ-2 scores.10
The PHQ-2 is a two-item screening questionnaire designed to determine how often an individual is bothered by having “little interest or pleasure in doing things” and “feeling down, depressed or hopeless” over the previous 2 weeks. The PHQ-2 is scored from 0-6 with a score of 2 (where the % of truly identified positives related to all positives is highest: sensitivity = 92.7) is used as the cutoff point.

Conclusion
For many decades, investigating the benefits of amplification and hearing rehabilitation has focused on measuring improvements in audibility and speech recognition performance. More recently, we have seen an impressive expansion of hearing rehabilitation research to include an exploration of the associations between hearing loss, and its treatment, on such non-auditory domains as health-related quality of life, depression, social isolation, and cognition, to name a few. The exceptionally large, representative, and multinational EuroTrak and MarkeTrak surveys offer a unique opportunity to add to this body of research in an attempt to further understand the impact of better hearing—as achieved through current hearing aids—on the well-being of individuals and, potentially, the society in which they live.
References
-
Hougaard S, Ruf S. EuroTrak I: A consumer survey about hearing aids in Germany, France, and the UK. Hearing Review. 2011;18(20):12-28.
-
Hougaard S, Ruf S, Egger C. EuroTrak + JapanTrak 2012: Societal and personal benefits of hearing rehabilitation with hearing aids. Hearing Review. 2013;20(3):16-35.
-
Abrams HB, Kihm J. An Introduction to MarkeTrak 9: A New Baseline for the Hearing Aid Market. Hearing Review. 2015;22(6):16.
-
World Health Organization, International Classification of Functioning, Disability and Health (ICF). Geneva: 2001, WHO
-
Li CM, Zhang X, Hoffman HJ, Cotch MF, Themann CL, Wilson MR: Hearing impairment associated with depression in US adults, National Health and Nutrition Examination Survey 2005-2010. JAMA Otolaryngol Head Neck Surg. 2014 Apr;140(4):293-302
-
Monzani D, Galeazzi GM, Genovese E, Marrara A, Martini A. Psychological profile and social behaviour of working adults with mild or moderate hearing loss. Acta Otorhinolaryngol Ital. 2008; 28(2)[Apr]:61-66.
-
Mener DJ, Betz J, Genther DJ, Chen D, Lin FR. Hearing loss and depression in older adults. J Am Geriatr Soc. 2013 Sep;61(9):1627-1629.
-
Dawes P, Emsley R, Cruickshanks KJ, Moore DR, Fortnum H, Edmondson-Jones M, McCormack A, Munro KJ. Hearing loss and cognition: The role of hearing aids, social isolation and depression. PLoS One. 2015;10(3):e0119616
-
World Economic Forum and Harvard School of Public Health. The Global Economic Burden of Non-communicable Diseases. Sept 2011.
Correspondence can be addressed to Søren Hougaard at: [email protected]
Original citation for this article: Hougaard S, Ruf S, Egger C, Abrams H. Hearing Aids Improve Hearing–and A LOT More. Hearing Review. 2016;23(6):14.?


How much do they cost ?
[email protected]