
Hearing and Fitting | April 2021 Hearing Review
Programmed MPOs might not be what you think. Here’s yet another reason to verify fittings.
Using 2-cc coupler measures, MPO values for different programmed settings were compared for the premier hearing aid products from six major manufacturers. Large differences were observed, and these differences were not directly associated with the product’s OSPL90. In general, at least for the sample audiogram used, it appears that the MPO is limited by the gain setting and the aggressiveness of the wide dynamic range compression (WDRC), often restricting useable headroom. Therefore, while we normally think that reduced audibility is the harm to the patient resulting from an inappropriate fitting, we see here that it is also an MPO/headroom issue—one more reason for adherence to best practices and the use of real-ear measurement and coupler verification.
By H. Gustav Mueller, PhD, Elizabeth Stangl, AuD, and Yu-Hsiang Wu, PhD
Selecting the appropriate maximum power output (MPO) for a given patient is a critical component of the overall hearing aid selection and fitting process. The primary concern is that the MPO at any frequency cannot be above the patient’s loudness discomfort level (LDL). An MPO above the LDL could lead to discomfort, which can cause reduced hearing aid use and even rejection of the instruments. At the least, it would prompt the patient to use less gain than needed, reducing audibility for speech.
On the other hand, setting the MPO too low—substantially below the patient’s LDL—has its own set of problems. Unnecessarily reducing the patient’s aided dynamic range will significantly reduce the dynamics and sound quality for speech and music. Additionally, for some speech-in-noise listening conditions, a too-low MPO can make the signal-to-noise ratio (SNR) worse (eg, in an initially positive SNR listening situation, the peaks of speech exceeding the noise level may be suppressed, equalizing the speech and noise, and thereby creating a more adverse SNR). The frequency-specific MPO, therefore, should be set so that amplified loud sounds are not too loud, or not too soft, but “loud, but okay”—the #6 rating of the 7-point Cox Loudness Anchors.1
The recommended procedure to determine the optimum MPO settings for a given patient is to first measure his or her frequency-specific LDLs (pulsed pure-tones; two or three frequencies/ear), convert these HL values from HL to 2-cc coupler using the appropriate reference equivalent threshold in sound pressure level (RETSPL), and then use these converted values to set the desired MPO (usually controlled by the kneepoints of the automatic gain control output compression—AGCo).2,3 Modern hearing aids have multiple output compression channels, so the MPO can be shaped much the same way as we program gain to match prescriptive targets. The MPO settings then can be verified with probe-mic measures and/or subjective loudness judgments.4 This usually is conducted at “use-gain,” or in some cases, with the gain set just-below-feedback or at max-gain if no feedback is present.
While the procedure just described is straightforward, and recommended in best-practice documents, it often is not followed in routine practice. Rather, frequency-specific LDLs are not conducted, and the MPO simply is determined by the default setting of the manufacturer, presumably based on the patient’s pure-tone thresholds. This means that two different patients with the same hearing loss will receive the same MPO, even though their LDLs and dynamic ranges may differ significantly.
It’s important, therefore, to question what MPOs are being selected by different manufacturers, and we did just that back in 2008 when we examined the default settings for the “Big 6” leading companies.5 Two interesting findings of this earlier comparative study were that:
1) At some frequencies, default MPO values differed by as much as 18-21 dB among manufacturers for the same audiogram, and
2) For some manufactures, the measured 2-cc coupler MPO was significantly different than that displayed in the fitting software.
In the years since this earlier study, hearing aid processing and fitting philosophies have changed, and it seemed reasonable to conduct a similar comparison with today’s leading products.
Procedure
We used the premier mini-BTE receiver-in-canal (RIC) hearing aids and current fitting software (December 2020) from the “Big 6” global hearing aid manufacturers. For all products, the manufacturer’s “mid-power” receiver was selected. All measures were conducted in the test box using the HA-1 2-cc coupler with the TRIC adapter of the Audioscan Verifit2. The input signal was the Verifit2 ANSI S3.22 90 dB SPL swept pure-tone signal.
Except for the ANSI OSPL90 measure, the hearing aids were programmed for the audiogram shown in Figure 1, with the following parameters selected in the manufacturers’ software: bilateral fitting, closed earmold, experienced user. No LDLs were entered, as we were interested in the MPO values that the software would select without this information. The manufacturer’s default settings for all features remained except:
- We verified that frequency lowering was not automatically activated, and
- The instruments were set to fixed omnidirectional to ensure that no directional effects related to hearing aid placement in the test box would be present.
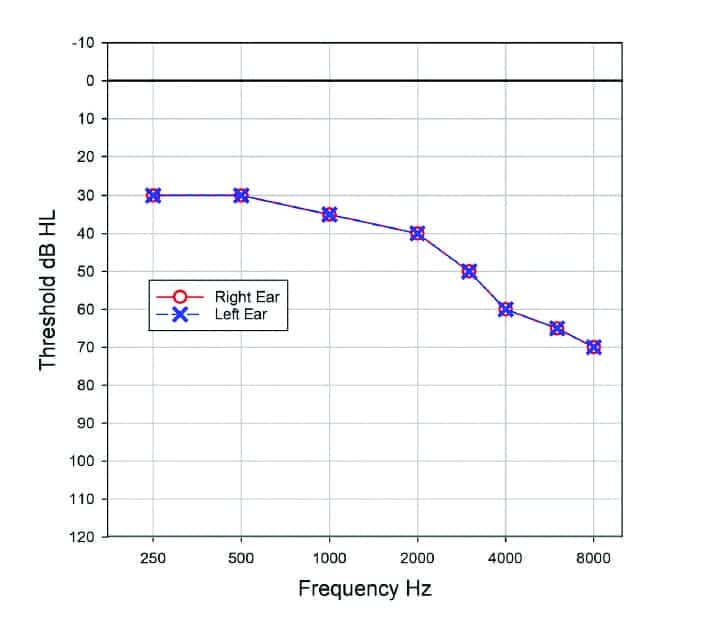
Figure 1. Representative audiogram used for programming the hearing aids.
Five 2-cc coupler measures of maximum output were conducted for each instrument:
- OSPL90. In accordance with ANSI S3.22, gain is set to full-on, AGC is at “minimum effect,” and automatic features are disabled.
- MPO (90 dB SPL swept tone) with the hearing aid programmed to the manufacturer’s proprietary first fit.
- MPO (90 dB SPL swept tone) with the hearing aid programmed to the manufacturer’s proprietary first fit, with overall gain adjusted to full-on.
- MPO (90 dB SPL swept tone) with the hearing aid programmed to the manufacturer’s NAL-NL2 fitting.
- MPO (90 dB SPL swept tone) with the hearing aid programmed to the manufacturer’s NAL-NL2 fitting, with overall gain adjusted to full-on.
Results
OSPL90. The OSPL90 (re: ANSI S3.22) was assessed for the six instruments, and these findings are shown in Figure 2. In general, the output values are quite similar. Although at some frequencies noticeable differences are present, the output for the six products averaged across key frequencies (500-4000 Hz) did not differ by more than 3-4 dB. As mentioned, the instruments had been fitted with the medium-power receiver from each manufacturer, so similar OSPL90 findings were expected.
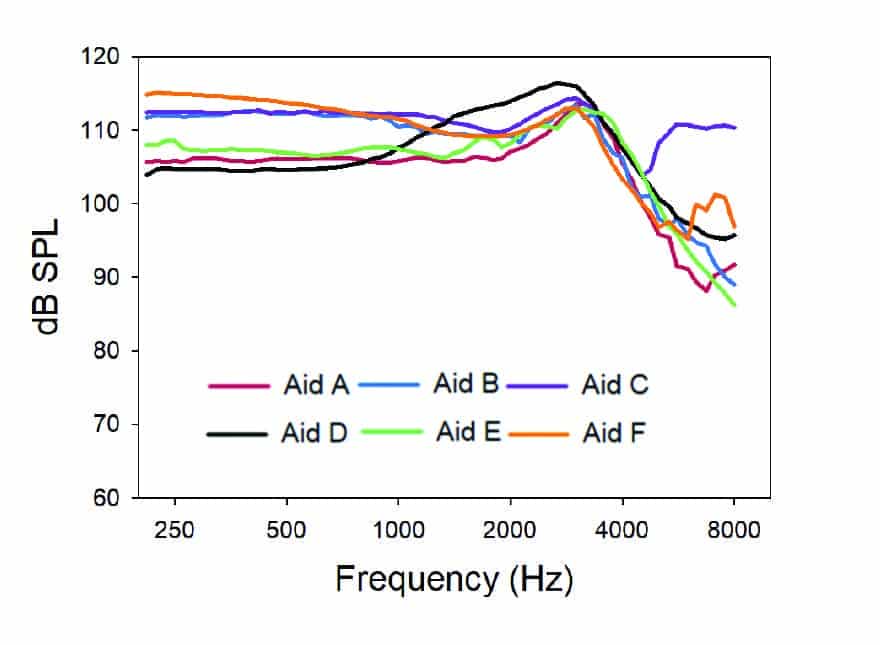
Figure 2. OSPL90 (re: ANSI S3.22) results for the six products.
Proprietary fitting formula. Each hearing aid was programmed to the manufacturer’s respective proprietary fitting, and the MPO was assessed. This was conducted for the original gain setting (Figure 3a), and then again with the gain set to maximum (Figure 3b). Regarding the latter test condition, it’s important to note that frequency-specific gain was not adjusted to maximum, but rather the change was for overall gain, to replicate what a patient might do with a VC or smartphone app.
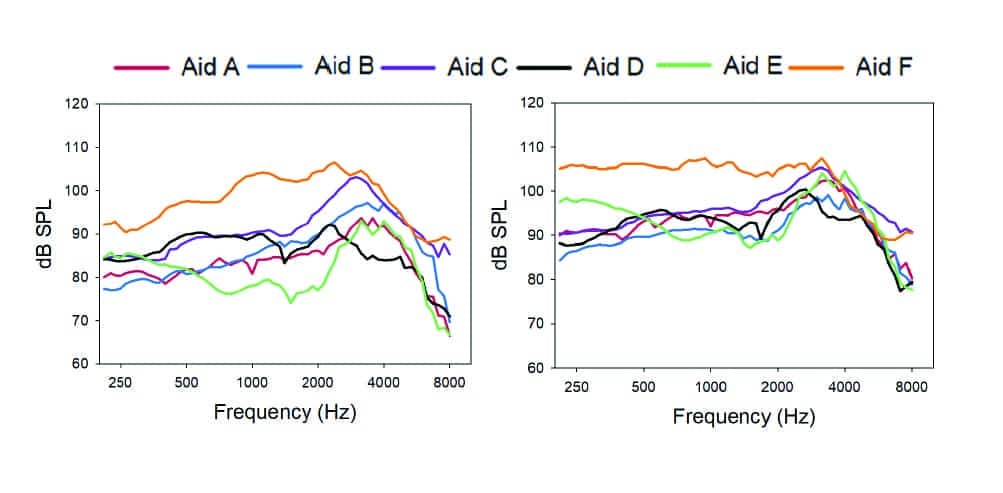
Figures 3a-b. MPO findings for each manufacturer’s proprietary fitting for the sample audiogram for two settings: 3a (left panel) as initially programmed, and 3b (right panel) with overall gain adjusted to full-on.
The most striking finding when viewing Figure 3a, is the resulting low MPO for most all of the products, with the exception of Aid F. From a clinical standpoint, we would expect a patient with this degree of hearing loss to have LDLs around 102 dB SPL (re:2-cc coupler).6 Note that Aid E has an average MPO of about 82 dB SPL, restricting 20 dB of useful headroom for the average patient. Aid F, which, when averaged across frequencies, only was 2-3 dB higher than Aid E for the OSPL90 measure, now has an output 20 dB higher than Aid E.
The fact that the MPO for most of these products is substantially below the OSPL90 measure suggests that it is the wide dynamic range compression (WDRC) or automatic gain control-input (AGCi), and not the AGCo limiting compression that is determining the MPO. This was confirmed when we conducted the second measure with the overall gain adjusted to full-on (Figure 3b). With the exception of Aid F, which already had a relatively high MPO, sizeable changes in the maximum output were present; the average MPO for Aid E, for example, increased by 13 dB. All products now have an average MPO of ~94 dB SPL or higher, although still unusually low in the mid-frequencies.
We know that manufacturers have different philosophies regarding the prescriptive gain for their default proprietary fittings.7 While our goal in these measures was to assess MPO (and indeed we are), indirectly the MPO appears to be driven by the prescribed gain of the proprietary fittings. That is, the higher MPO for Aid F might not at all be related to this company’s beliefs regarding the optimum maximum output, but rather, their beliefs regarding first-fit gain.
NAL-NL2 fitting. For this round of testing, each hearing aid was programmed to the manufacturer’s software-labeled NAL-NL2 fitting, and the MPO was assessed. As with the proprietary fitting, this was conducted for the original gain setting, and then again with the overall gain set to maximum. Importantly, testing was conducted with the initial software-programmed gain—there was no attempt to actually fit the hearing aids to the NAL-NL2 2-cc coupler prescriptive targets. The results of this testing are displayed in Figures 4a and 4b.
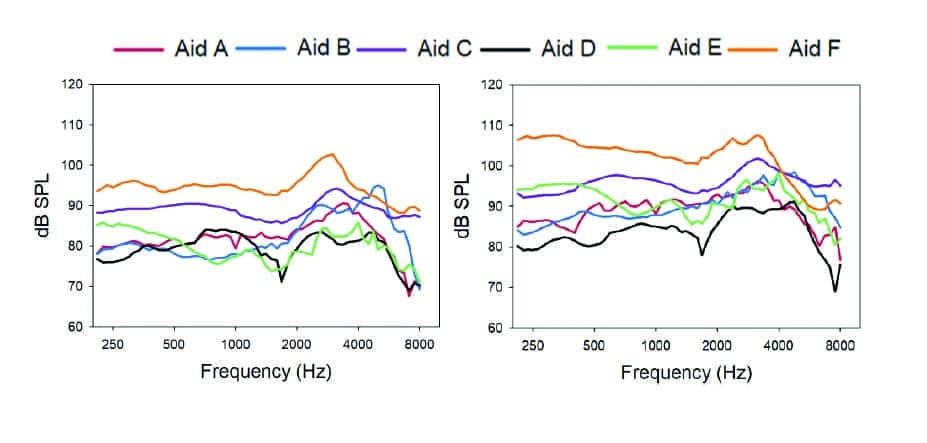
Figure 4a-b. MPO findings for each manufacturer’s NAL-NL2 fitting for the sample audiogram for two settings: 4a (left panel) as initially programmed, and 4b (right panel) overall gain adjusted to full-on.
As with the proprietary fittings, the most notable overall finding is the unusually low MPO for most all products. While Aid F remains the highest, its average MPO is now 5 dB less than what it was for the proprietary fitting. In fact, by at least 2-3 dB, all products have a lower MPO for the NAL-NL2 than the proprietary fitting. This could be because less gain is prescribed, or perhaps a more aggressive WDRC is employed. As with the proprietary fittings, we see that when we increase overall gain, the average MPO for all products increased by about 5 dB, with again the exception of Aid E, which increased by 10-12 dB. A summary of the average (key frequencies 500 to 4000 Hz) OSPL90 and MPO results for all the different test conditions is shown in Figure 5.
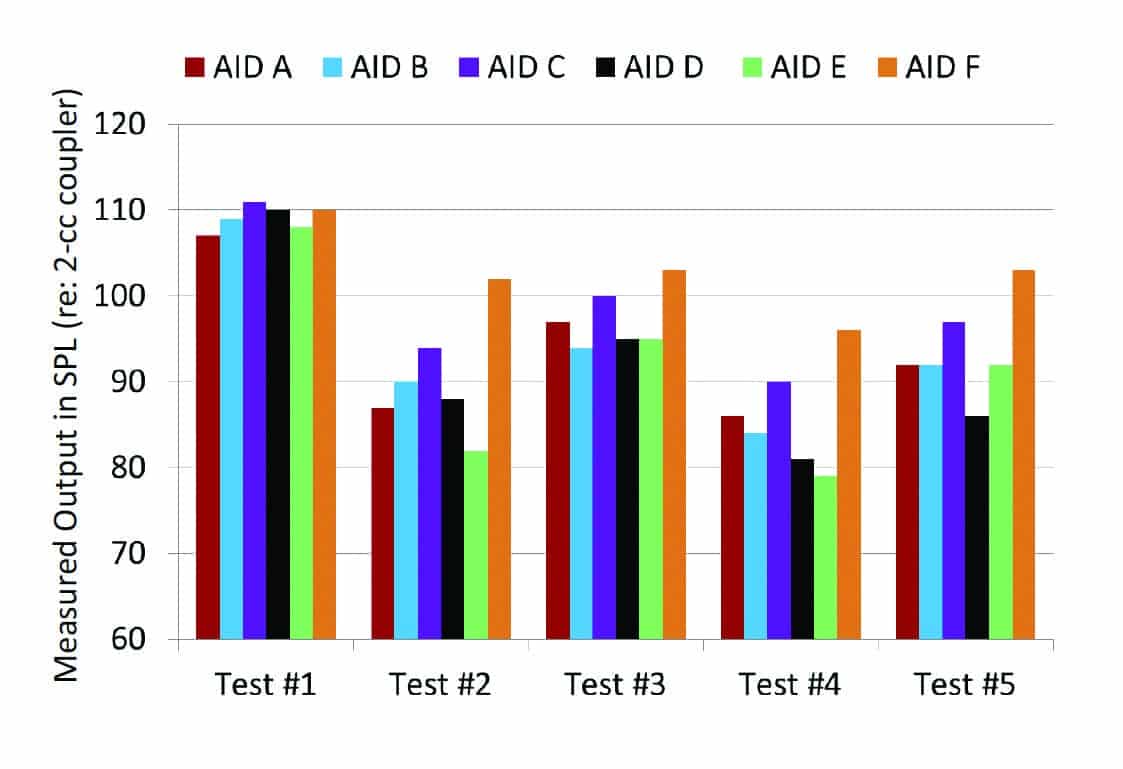
Figure 5. Average 0SPL90 and MPO for key frequencies 500-4000 Hz for five different test conditions. Test #1: OSPL90 re: ANSI S3.22; Test #2: MPO (90 dB SPL swept tone) with the hearing aid programmed to the manufacturer’s proprietary first fit; Test #3: MPO (90 dB SPL swept tone) with the hearing aid programmed to the manufacturer’s proprietary first fit, with overall gain adjusted to full-on; Test #4: MPO (90 dB SPL swept tone) with the hearing aid programmed to the manufacturer’s NAL-NL2 fitting, and Test #5: MPO (90 dB SPL swept tone) with the hearing aid programmed to the manufacturer’s NAL-NL2 fitting, with overall gain adjusted to full-on.
Software comparisons. While it appears that it is the overall gain setting and the WDRC that is controlling the MPO for the measurements we’ve obtained, we were interested in what the fitting software showed for the MPO settings for the NAL-NL2, which we assume, are the settings of the AGCo kneepoints. Using the NAL-NL2 stand-alone software, we entered our sample audiogram (see Figure 1), which then gave the prescribed NAL-NL2 MPO (re: 2-cc coupler). These values for key frequencies were 98 dB SPL at 500 and 1000 Hz, 101 dB SPL at 2000 Hz, and 104 dB SPL at 4000 Hz; all in close agreement with the data of Bentler and Cooley.6 Figure 6 illustrates the deviation of the manufacturer’s software values from the NAL-NL2 MPO prescription (standalone software) for the six products. As shown, Aid F is ~5 dB above the NAL-NL2, and Aid B is ~5 dB below, but the others vary substantially from the NAL-NL2 prescription values. If we look at the extremes, Aid D vs Aid E, we see a curious difference in the software MPO settings of about 25 dB. Recall that we did not enter LDLs, so this difference is not related to the fitting software using, or not using LDL values. Because the MPO of all the products was determined by the WDRC (see Figure 4a and 4b), we could not verify if the values shown in the software were truly the MPO for this audiogram. We do know that when the WDRC was set to minimum effect (ANSI S3.22 measure), the OSPL90s for the six products are quite similar (see Figure 5, Test #1). Aid E, which had the highest displayed MPOs of the group, had software settings for this audiogram in the 112 to 117 dB SPL range (see Figure 6), yet the average measured OSPL90 was 108 dB SPL (see Figure 5, Test #1).
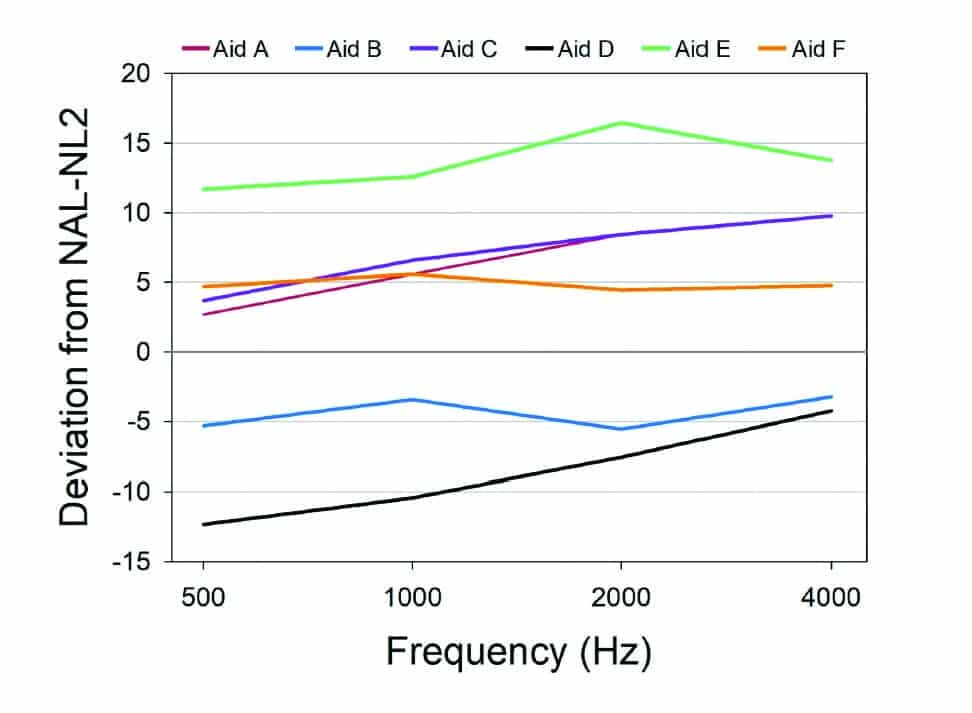
Figure 6. Software displayed deviation from the NAL-NL2 prescribed MPO settings for the sample audiogram in Figure 1 for each of the six products.
Summary and Discussion
The most remarkable finding from our coupler comparisons was the low MPO values, presumably because maximum output is being limited by the WDRC, not the output limiting compression. For most products—for both the proprietary fitting and the NAL-NL2—the resulting MPO is considerably lower than what would be desired for someone with a hearing loss similar to our sample audiogram (see Figure 1). We would expect someone with a hearing loss of this degree to have LDLs (re: 2-cc coupler) of 100-105 dB SPL, yet most of the products had an MPO lower than 90 dB SPL. It is somewhat ironic, that years ago there were serious concerns that the maximum output of hearing aids often exceeded the patients’ LDLs,8 where today it seems that the opposite is true; headroom is being unnecessarily reduced.
Another issue is the large MPO differences observed among manufacturers, especially considering that the OSPL90s were quite similar. This is somewhat understandable for the proprietary fittings, as manufacturers might have different fitting philosophies—which is why we have proprietary fittings. But what about the NAL-NL2 fittings? We still see large MPO differences. Given that we have determined that in this study, the MPO is being controlled by the WDRC, it could be that not all of these NAL-NL2 fittings are really NAL-NL2 fittings. This disconnect has been reported in past research.7,9,10
To examine this possible explanation, we conducted additional testing with the product with the highest MPO (Aid F) and the product with one of the lowest MPOs, Aid D. Their average MPOs differed by 15 dB for the NAL-NL2 fitting. With the products programmed to each manufacturer’s NAL-NL2, we assessed the coupler output for a 65 dB SPL input using the ISTS. For this measure we used the 0.4-cc wideband coupler with the TRIC adapter, recommended by Audioscan for speechmap testing. The results of these comparative speechmap measures are shown in Figures 7a and 7b. Note that the aided LTASS for Aid D (Figure 7b) falls 10-16 dB below that of Aid F (Figure 7a)—similar to the average MPO difference of the two products. While not shown on Figure 7a, the output for Aid F was a very close match to NAL-NL2 targets for this 65-dB-SPL ISTS input.
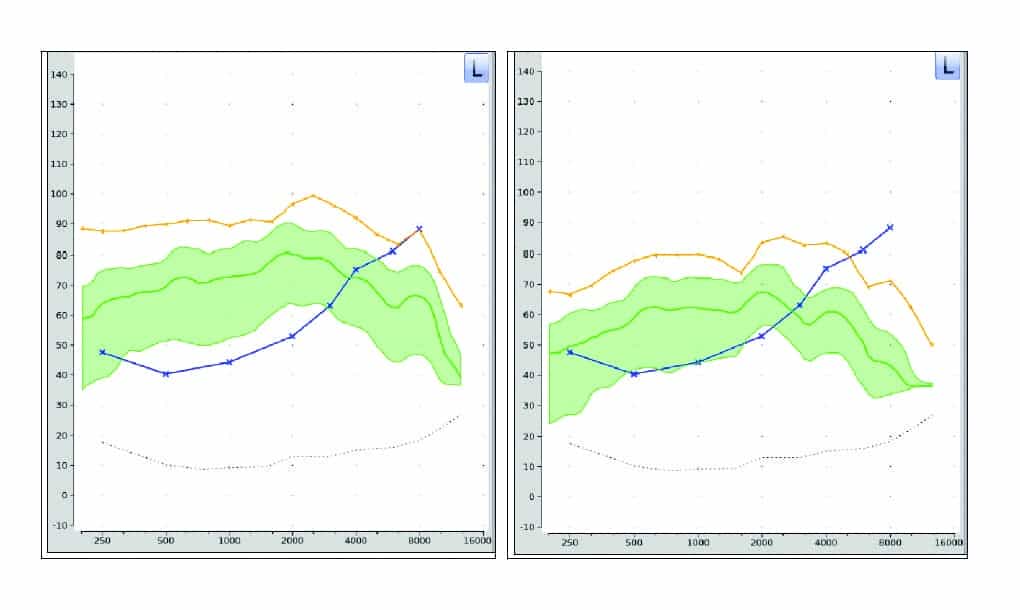
Figures 7a-b. Comparison of speechmap findings (ISTS; 65-dB-SPL) for Aid F (left panel) and Aid D (right panel). Both instruments were programmed to the manufacturer-specific NAL-NL2 based on the sample audiogram in Figure 1.
So yes, we could have programmed all the products to a precise fit for the NAL-NL2, rather than use manufacturer-derived values. Certainly, the MPO differences observed among products would have been much smaller. But our point in collecting these data was to show the magnitude of the mistakes that can be made when best practice is ignored, and real-ear (or coupler) verification is not conducted. While we normally think that reduced audibility is the harm to the patient resulting from an inappropriate fitting, we see here that it also is an MPO/headroom issue.
Finally, a couple caveats. The audiogram we selected represents a typical older adult patient being fitted with hearing aids. Because the MPO appears to be limited by the programmed gain and aggressiveness of the WDRC, and because LDLs only increase minimally as hearing loss becomes worse, individuals with more hearing loss would have a resulting MPO that is closer to their LDL than we have shown in our data. Secondly, our testing was conducted with the hearing aid tightly fitted to a coupler. If the patient is fitted open, or with vented or loose fitting ear tips, it is probable that for high inputs, at least for some frequencies, the direct sound to the eardrum will be greater than the MPO of the hearing aid. This might assist with sound quality.
Selecting the appropriate MPO for the patient in an important component of the overall hearing aid fitting process. It’s unlikely that this will be accomplished effectively using unverified default hearing aid settings.

Citation for this article: Mueller G, Stangl E, Wu Y-H. Comparing MPOs from six different hearing aid manufacturers: Headroom considerations. Hearing Review. 2021;28(4):10-16.
Correspondence can be addressed to Dr Mueller at: [email protected].
References
- Cox RM. Using loudness data for hearing aid selection: The IHAFF approach. Hear Jour. 1995;48(2):10.
- Mueller HG, Ricketts TA, Bentler R. Modern Hearing Aids: Pre-Fitting Testing and Selection Considerations. San Diego, CA: Plural Publishing;2014.
- Ricketts TA, Bentler RA, Mueller HG. Essentials of Modern Hearing Aids: Selection, Fitting, and Verification. San Diego, CA: Plural Publishing;2019.
- Mueller HG, Ricketts TA, Bentler R. Speech Mapping and Probe Microphone Measures. San Diego, CA: Plural Publishing;2017.
- Mueller HG, Bentler RA, Wu Y-H. Prescribing maximum hearing aid output: Differences among manufacturers found. Hear Jour. 2008;61(3):30-36.
- Bentler RA, Cooley LJ. An examination of several characteristics that affect the prediction of OSPL90 in hearing aids. Ear Hear. 2001;22(1):58-64.
- Sanders J, Stoody TM, Weber JE, Mueller HG. Manufacturers’ NAL-NL2 fittings fail real-ear verification. Hearing Review. 2015;21(3):24.
- Mueller HG, Bentler RA. Measurements of TD: How loud is allowed. Hear Jour. 1994;47(1):10:42-44.
- Amlani AM, Pumford J, Gessling E. Real-ear measurement and its impact on aided audibility and patient loyalty. Hearing Review. 2017;24(10):12-21.
- Mueller HG. Perspective: Real ear verification of hearing aid gain and output. GMS Z Audiol (Audiol Acoust). 2020;2:Doc05. DOI:10.3205/zaud000009.


It amazes me, as a trained sound recordist, that such fundamentals as max spl delivered to ear were not agreed upon – and engineered for – years ago.
My first, dreadful, UK NHS analogue aid was painful on loud sounds. No proper limiter, it just squared off. I asked a prominent hearing institution whether its use might harm my hearing: their consultant clearly had no idea.
Current instruments are much better dynamically but why on earth isn’t maximum spl easily prescribed, across the board or at individual frequencies? Why indeed do some instruments have a slow agc attack time – so we are treated to continual overshoot. In my sound studio, as in many others, these issue are simple routine: we set dynamic control to raise low levels and restrain high ones according to available headroom. And our software limiters/compressors have lookahead: no clicking. That might add perhaps 2mS sec latency, but many a digital aid already has more than that.
I have an opinion on design for MUSIC, too, but will save that for another route!
The HA industry has done enough damage t people’s hearing by keeping such high MPO values since the inception of hearing technology. This needs to change now. WE have been ignorant for too long!
I am looking forward to the day when the MPO will be only be used as a transit tool n maintaing the flow of sound pressure, so that only speech energy will be amplified by a max. of 10-12db SPL to run through the external ear and give rise to miminum stimulation for excitation of action potentials at the spiral ganglion. This added pressure will be necessary to maintain the flow of speech cues, and the relationship between the speech components in the flow through the cochlea! it is unfortunate that I get blank looks from hearing aid scientists on this account in my discussions!
Lets see some responsibility taken for this. We must stop the damage we are causing to our patients.!