This study evaluates how different hearing aid platforms, including the new Widex Allure, manage noise reduction to balance speech intelligibility with environmental awareness, highlighting the importance of adaptive processing strategies.
By Petra Herrlin; Naim Mansour, PhD; Frederik Nielsen; Karolina Smeds, PhD; and Laura Winther Balling, PhD
In order to help wearers in real life, hearing aid noise reduction systems need to balance focus on speech with appropriate awareness of the user’s surroundings. This article reports the results of a study measuring how different hearing aid platforms do this and shows how the new Widex Allure platform responds to the environment by taking into account signal-to-noise ratio, input level, background noise type, and frequency composition.
Hearing aid manufacturers have different ways of addressing the ubiquitous issue of hearing in noise, most obviously because their technological platforms function in different ways, but manufacturers also vary more profoundly in processing strategies. This impacts, for instance, how aggressive the signal processing is, i.e., at what expense of realism and naturalness the noise is reduced, and how sensitive the processing is to changes in the environment.
Adaptive speech tests such as the Matrix test [1] and the Hearing in Noise Test (HINT [2]) tend to measure the speech reception threshold at which 50% of speech is understood. If applied to noise reduction during hearing aid development, this entails a focus that is not representative of listeners’ everyday lives, firstly because understanding 50% of speech is not enough for meaningful interaction, and secondly because listeners do not tend to spend much time at the very negative signal-to-noise ratios (SNRs) at which these measurements are made [3], [4].
Based on this, there are two principles that should be fundamental to noise reduction. First, it is crucial that noise reduction provide benefit across a broad range of SNRs, not only at the very negative SNRs where standard speech tests tend to show the clearest results. Second, to achieve a natural experience across real-life situations, it is critical that the noise reduction balance appropriately between the target that the user is most interested in, typically speech, and the background, which is generally also of some relevance. There may be cases where the user wishes to exclude all noise, but in most real-life situations, appropriate noise reduction is all about the balance between speech and background [5]. In fact, Johnson and Healy [5] argue convincingly for reframing signal-to-noise ratio as speech-to-background ratio (SBR). They show how the optimal combination of speech intelligibility and environmental sound recognition for participants with hearing loss is achieved around an SBR of +5 dB, which also happens to be the average SNR of real-life situations where speech is present in a background of other talkers, as shown by Smeds et al. [4].
To understand the extent to which different hearing aid platforms adhere to these principles of noise reduction, this article reports a set of measurements of the noise reduction in the new Widex Allure hearing aids and in hearing aids from three other manufacturers.
A key feature in the Widex Allure hearing aids is the Speech Enhancer Pro noise reduction [6]. This operates with 52 analysis bands for a more accurate estimate of the noise than on previous platforms, while keeping the benefits of a time-domain filter bank, including natural sound quality and low processing delay [7]. Another major development is the individualized noise reduction included in the Speech Enhancer Pro, which places the noise floor at or just below the hearing threshold of the user. This is a key element of a tailor-made noise reduction experience, along with the noise reduction based on the Speech Intelligibility Index (SII [9]), which is a legacy feature [8] that also operates on the Allure platform. It aims to shape the signal to optimize the SII for the specific user and the specific situation, resulting in a range of objective and subjective advantages, as documented by Peeters et al.[10].
Recordings
The recordings were made with the Widex Allure receiver-in-canal (RIC) hearing aids and premium RIC devices on the latest platform from three other manufacturers (as of January 2025). Noise reduction was investigated by measuring hearing aid output with noise reduction switched ON and comparing it with the output when noise reduction was switched OFF. This was done for two types of background noise at two input levels and for a range of SNRs. Including a variation of recording conditions is crucial for understanding how noise reduction responds to different conditions in real life.
Recording setup and sound samples
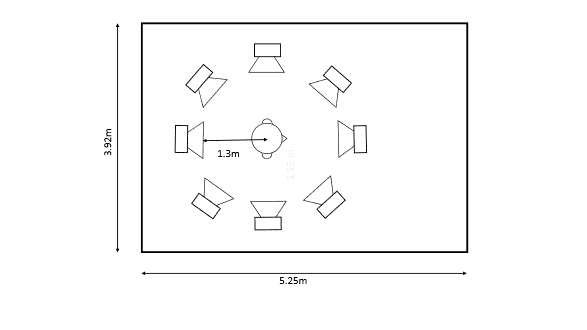
Recordings were made on a KEMAR manikin (version 45BB-5 with RA0045 IEC60318-4 Ear simulators, and 26AS-S3 1/4 pre-amplifiers) set up in an acoustically dampened room with a circular symmetrical eight-loudspeaker array (KRK R6 loudspeakers and RME Fireface 802 sound card), playing back 4th-order Ambisonically decoded versions of spatially recorded real-world environments [11], as well as target speech convolved with Ambisonically decoded spatial impulse responses (SIRs) (Figure 1).
The International Speech Test Signal (ISTS [12]) was used as the target signal presented from the front (0° azimuth). This signal has the advantage of being continuous, providing a stable signal for analysis, while preserving most relevant properties of natural speech—which is the typical target signal when noise reduction is active—such as average speech spectrum and modulation properties. The ISTS was spatialized with the spatial impulse response of the corresponding real-world environment and played back in separate sets of recordings against two different types of background noise: a car noise and a restaurant noise, presented from all eight loudspeakers. The car noise was a relatively stable noise dominated by low frequencies, and the restaurant background was a more variable noise with a broader range of different frequencies. Separate recordings were made with the speech played back at 62 and 75 dB SPL, and the background noise level was varied to create six different SNR conditions, ranging from very noisy (-9 dB SNR) to more quiet (+6 dB SNR) in 3 dB steps.
Fittings
The KEMAR was fitted binaurally to an N4 hearing loss [13], with the different hearing aids using M-receivers. The fittings were done with a closed ear tip to make sure that the effects of the noise reduction approaches were not diluted by venting. All hearing aids were programmed using the proprietary fitting rationale for each brand, since noise reduction settings may be optimized for proprietary rationales, and because different brands’ implementations of generic rationales such as the NAL-NL2 [14] tend to be different [15]. The fittings were audiogram-based and followed the mandatory steps for each brand. Two programs were created, one with all noise reduction turned on and one with all noise reduction turned off. For both programs, the microphone mode was set to omnidirectional, in order to isolate the effects of the non-directional noise reduction.
Analyses
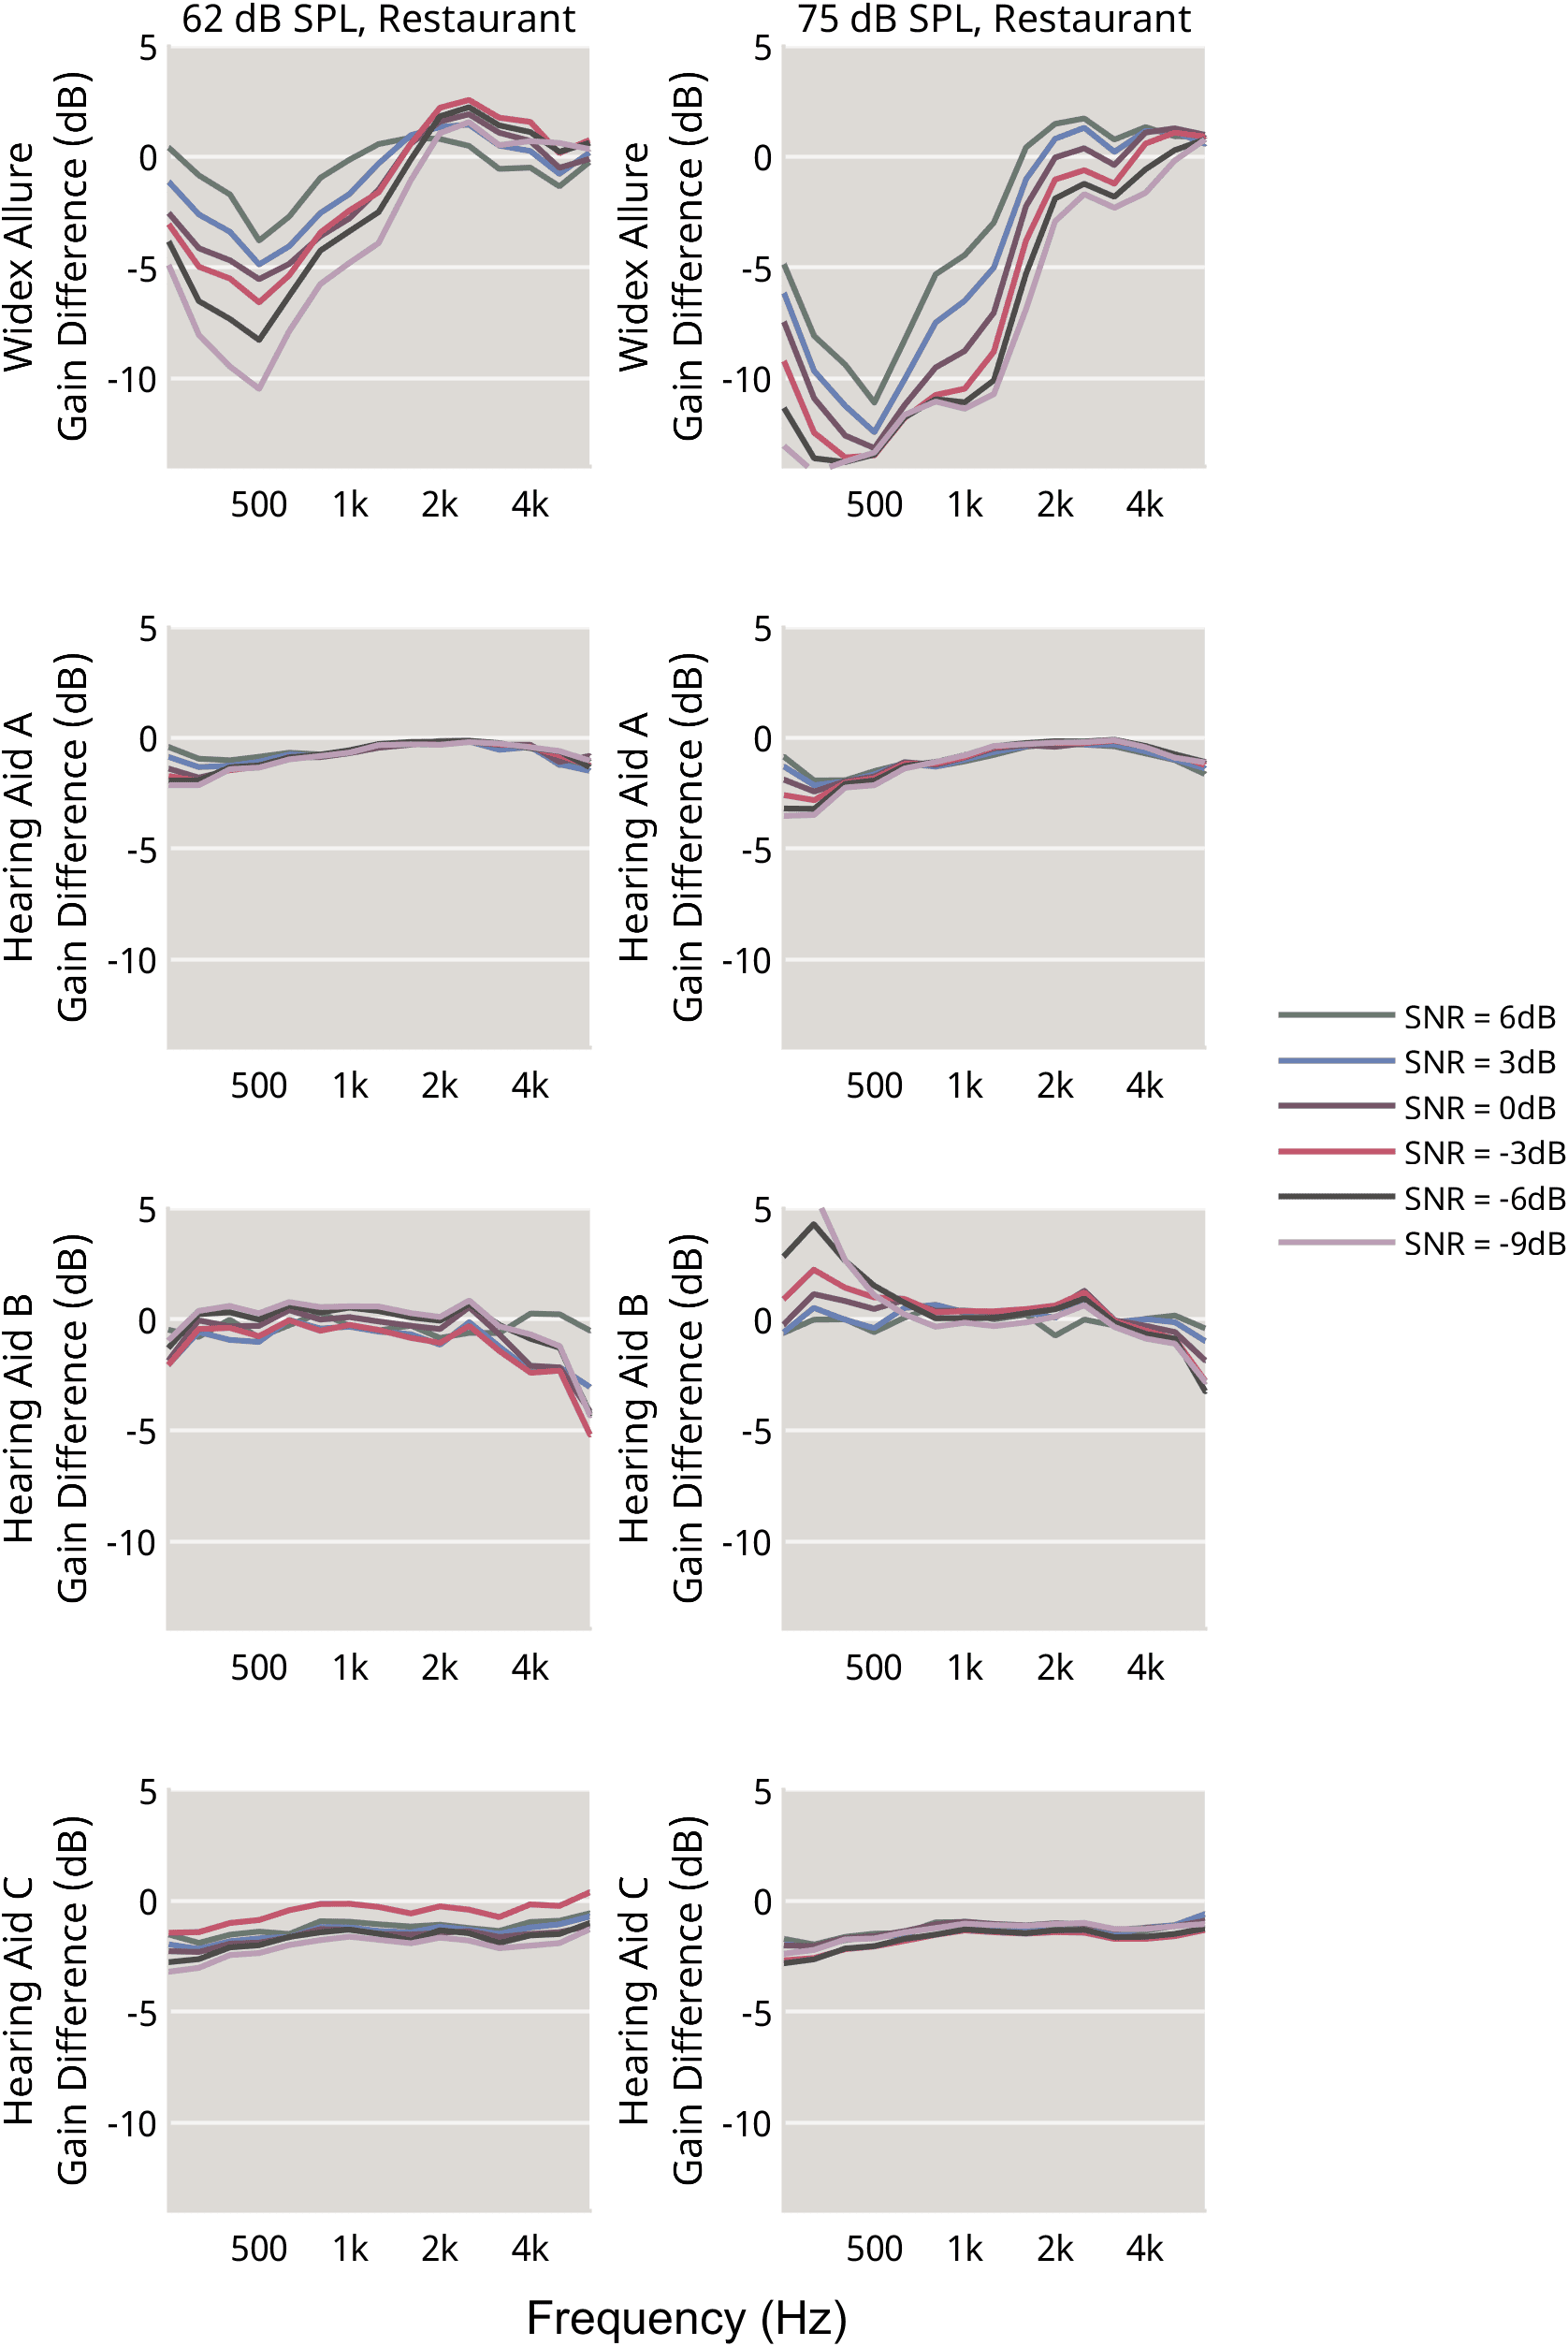
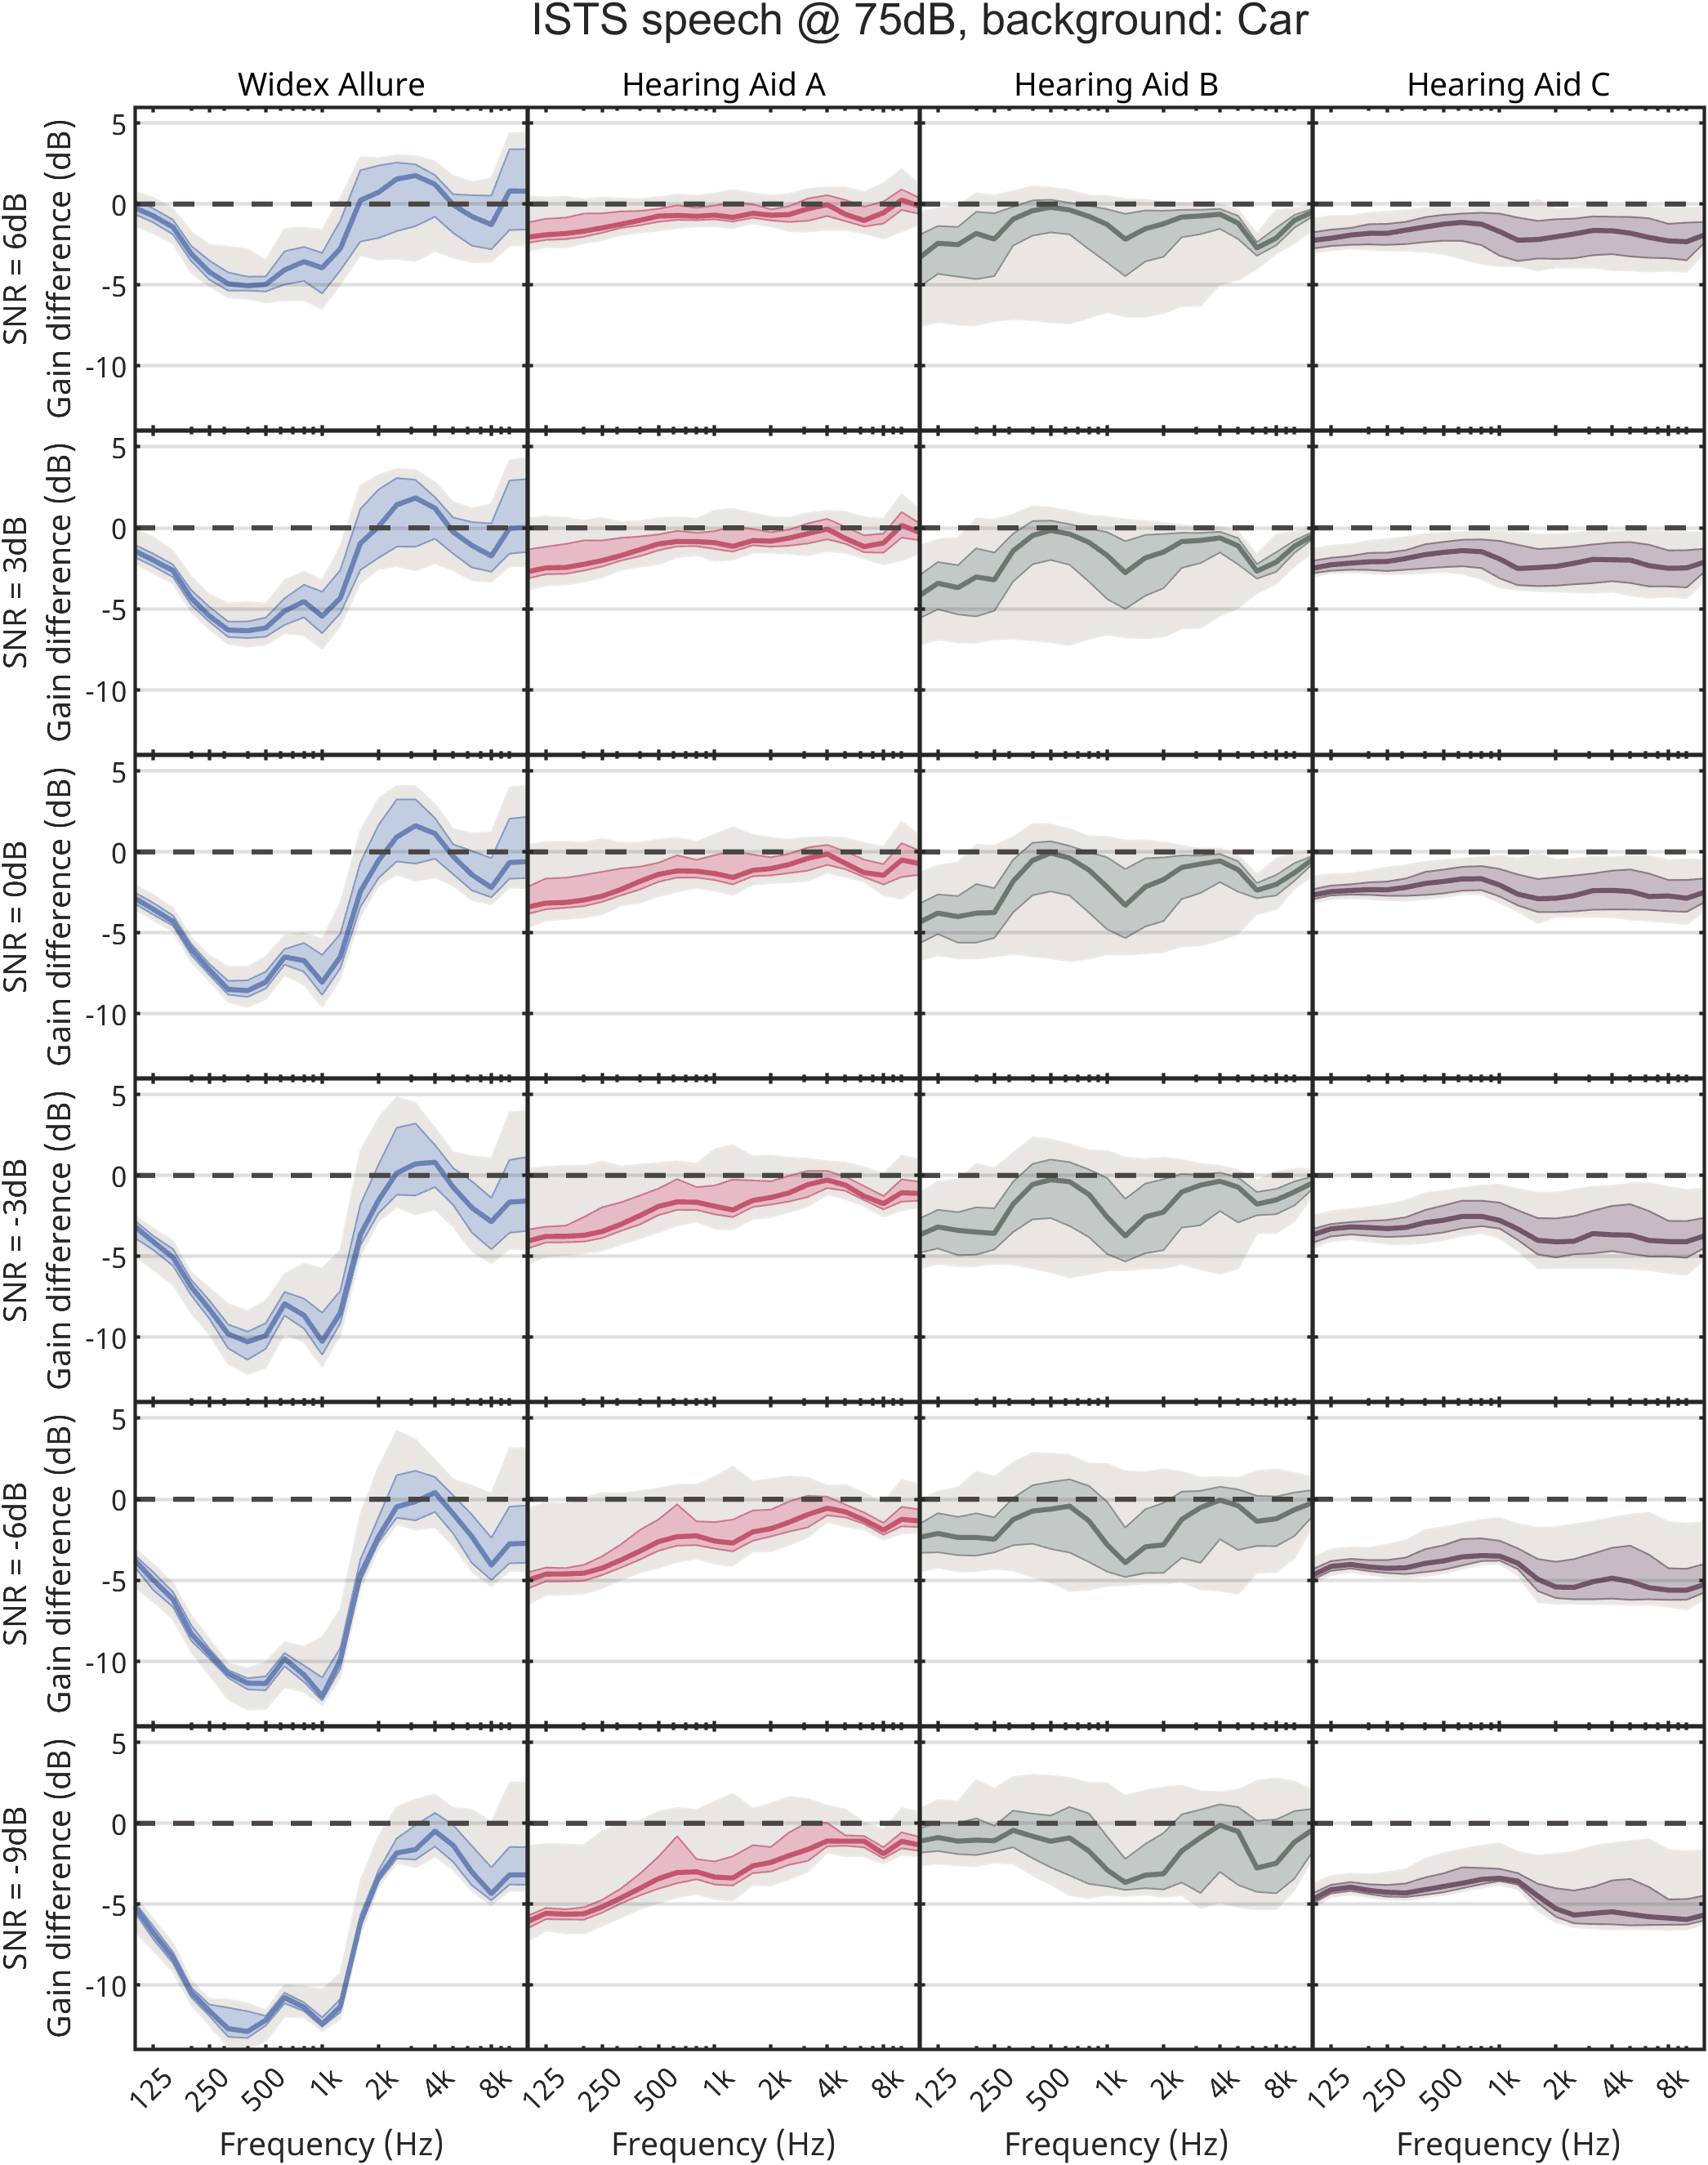
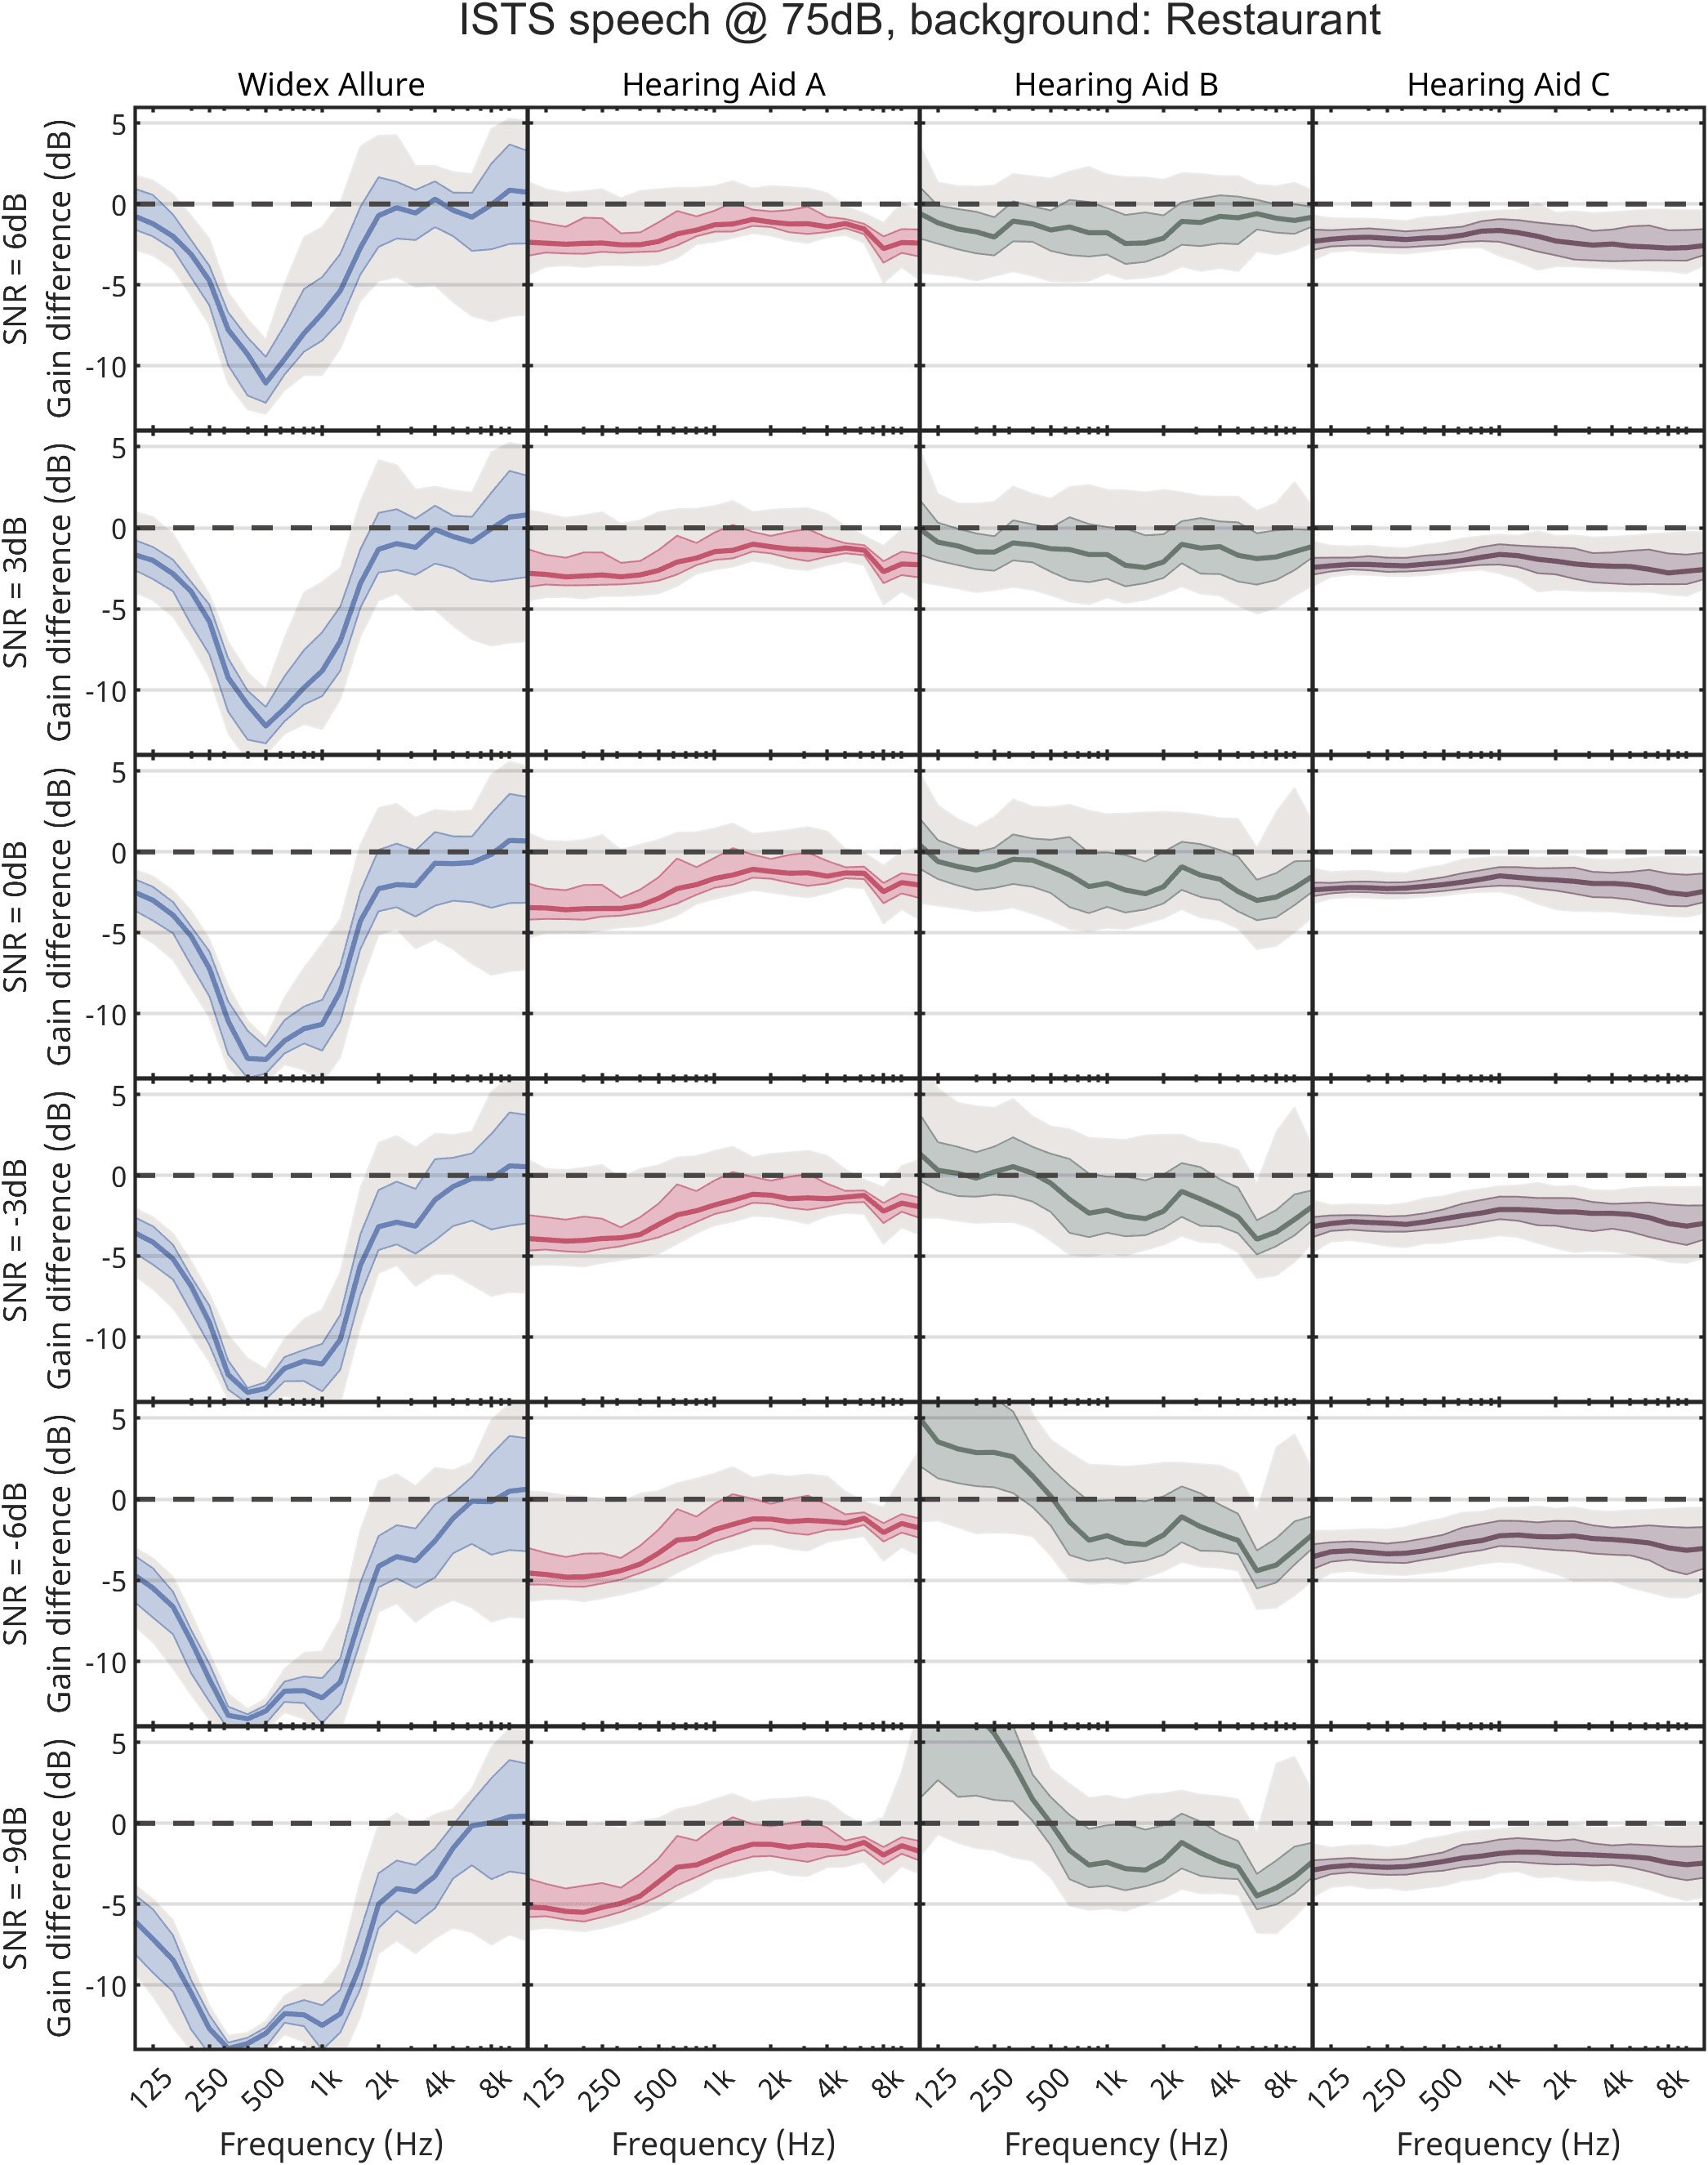
All analyses reported below present output differences, i.e., the difference in sound pressure level between a recording with noise reduction turned on and one with noise reduction turned off in the same recording conditions. Recordings were one minute long, but the first 30 seconds were not analyzed to avoid confounding the results with any effects of gain adaptation. The output difference was calculated in two ways: First, the long-term averages (see Figures 2 and 3) were calculated over 30 seconds using an integration time of 125ms. Second, short-term averages (see Figures 4 and 5) were calculated by analyzing the signals using a time-windowed filter bank updated every 40ms, with an integration time of 125ms. The resulting output differences illustrate how much the given hearing aid attenuates or amplifies the sound, and thus show the effect of the noise reduction.
Results
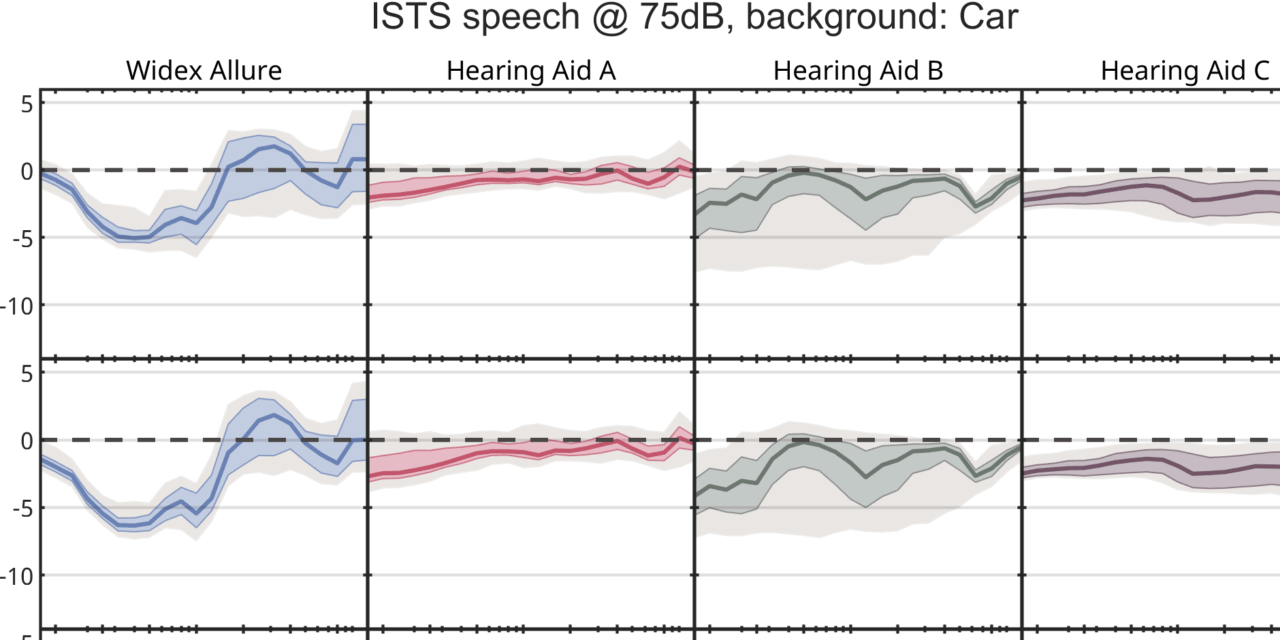
The long-term average output spectrum of the recordings is illustrated in Figures 2 and 3. These show the output difference between recordings where the noise reduction was on and where it was off for the four different hearing aids, i.e., the effect of the noise reduction on the output. The different signal-to-noise ratios are illustrated with the different colored lines. Four general trends stand out:
- The Allure noise reduction reduces output more than the noise reduction on the other three hearing aids.
- The Allure noise reduction shows a clear differentiation between SNRs, so that output is reduced more for more difficult (i.e., lower) SNRs. Importantly, when the input level is high (75 dB SPL, top right panels), the Widex Allure noise reduction is also active for the more positive SNRs in which hearing aid users tend to spend more time [4]. This is an important part of how Widex Allure responds to the environment. The other hearing aids generally differentiate much less between different SNRs, although hearing aid C shows some difference, especially for the car scene.
- The Allure noise reduction is targeted at the lower frequencies, to preserve crucial speech cues in the medium and high frequencies. For the louder input levels (top right panels of Figures 2 and 3) in particular, the higher frequencies are boosted in order to make speech more audible. This is different from the other hearing aids measured, where hearing aid B tends toward the opposite profile, and hearing aids A and C are much more uniform across frequencies.
- The differences between the two types of background are more marked for Allure than for the other hearing aids, possibly due to more fine-grained and accurate sound classes.
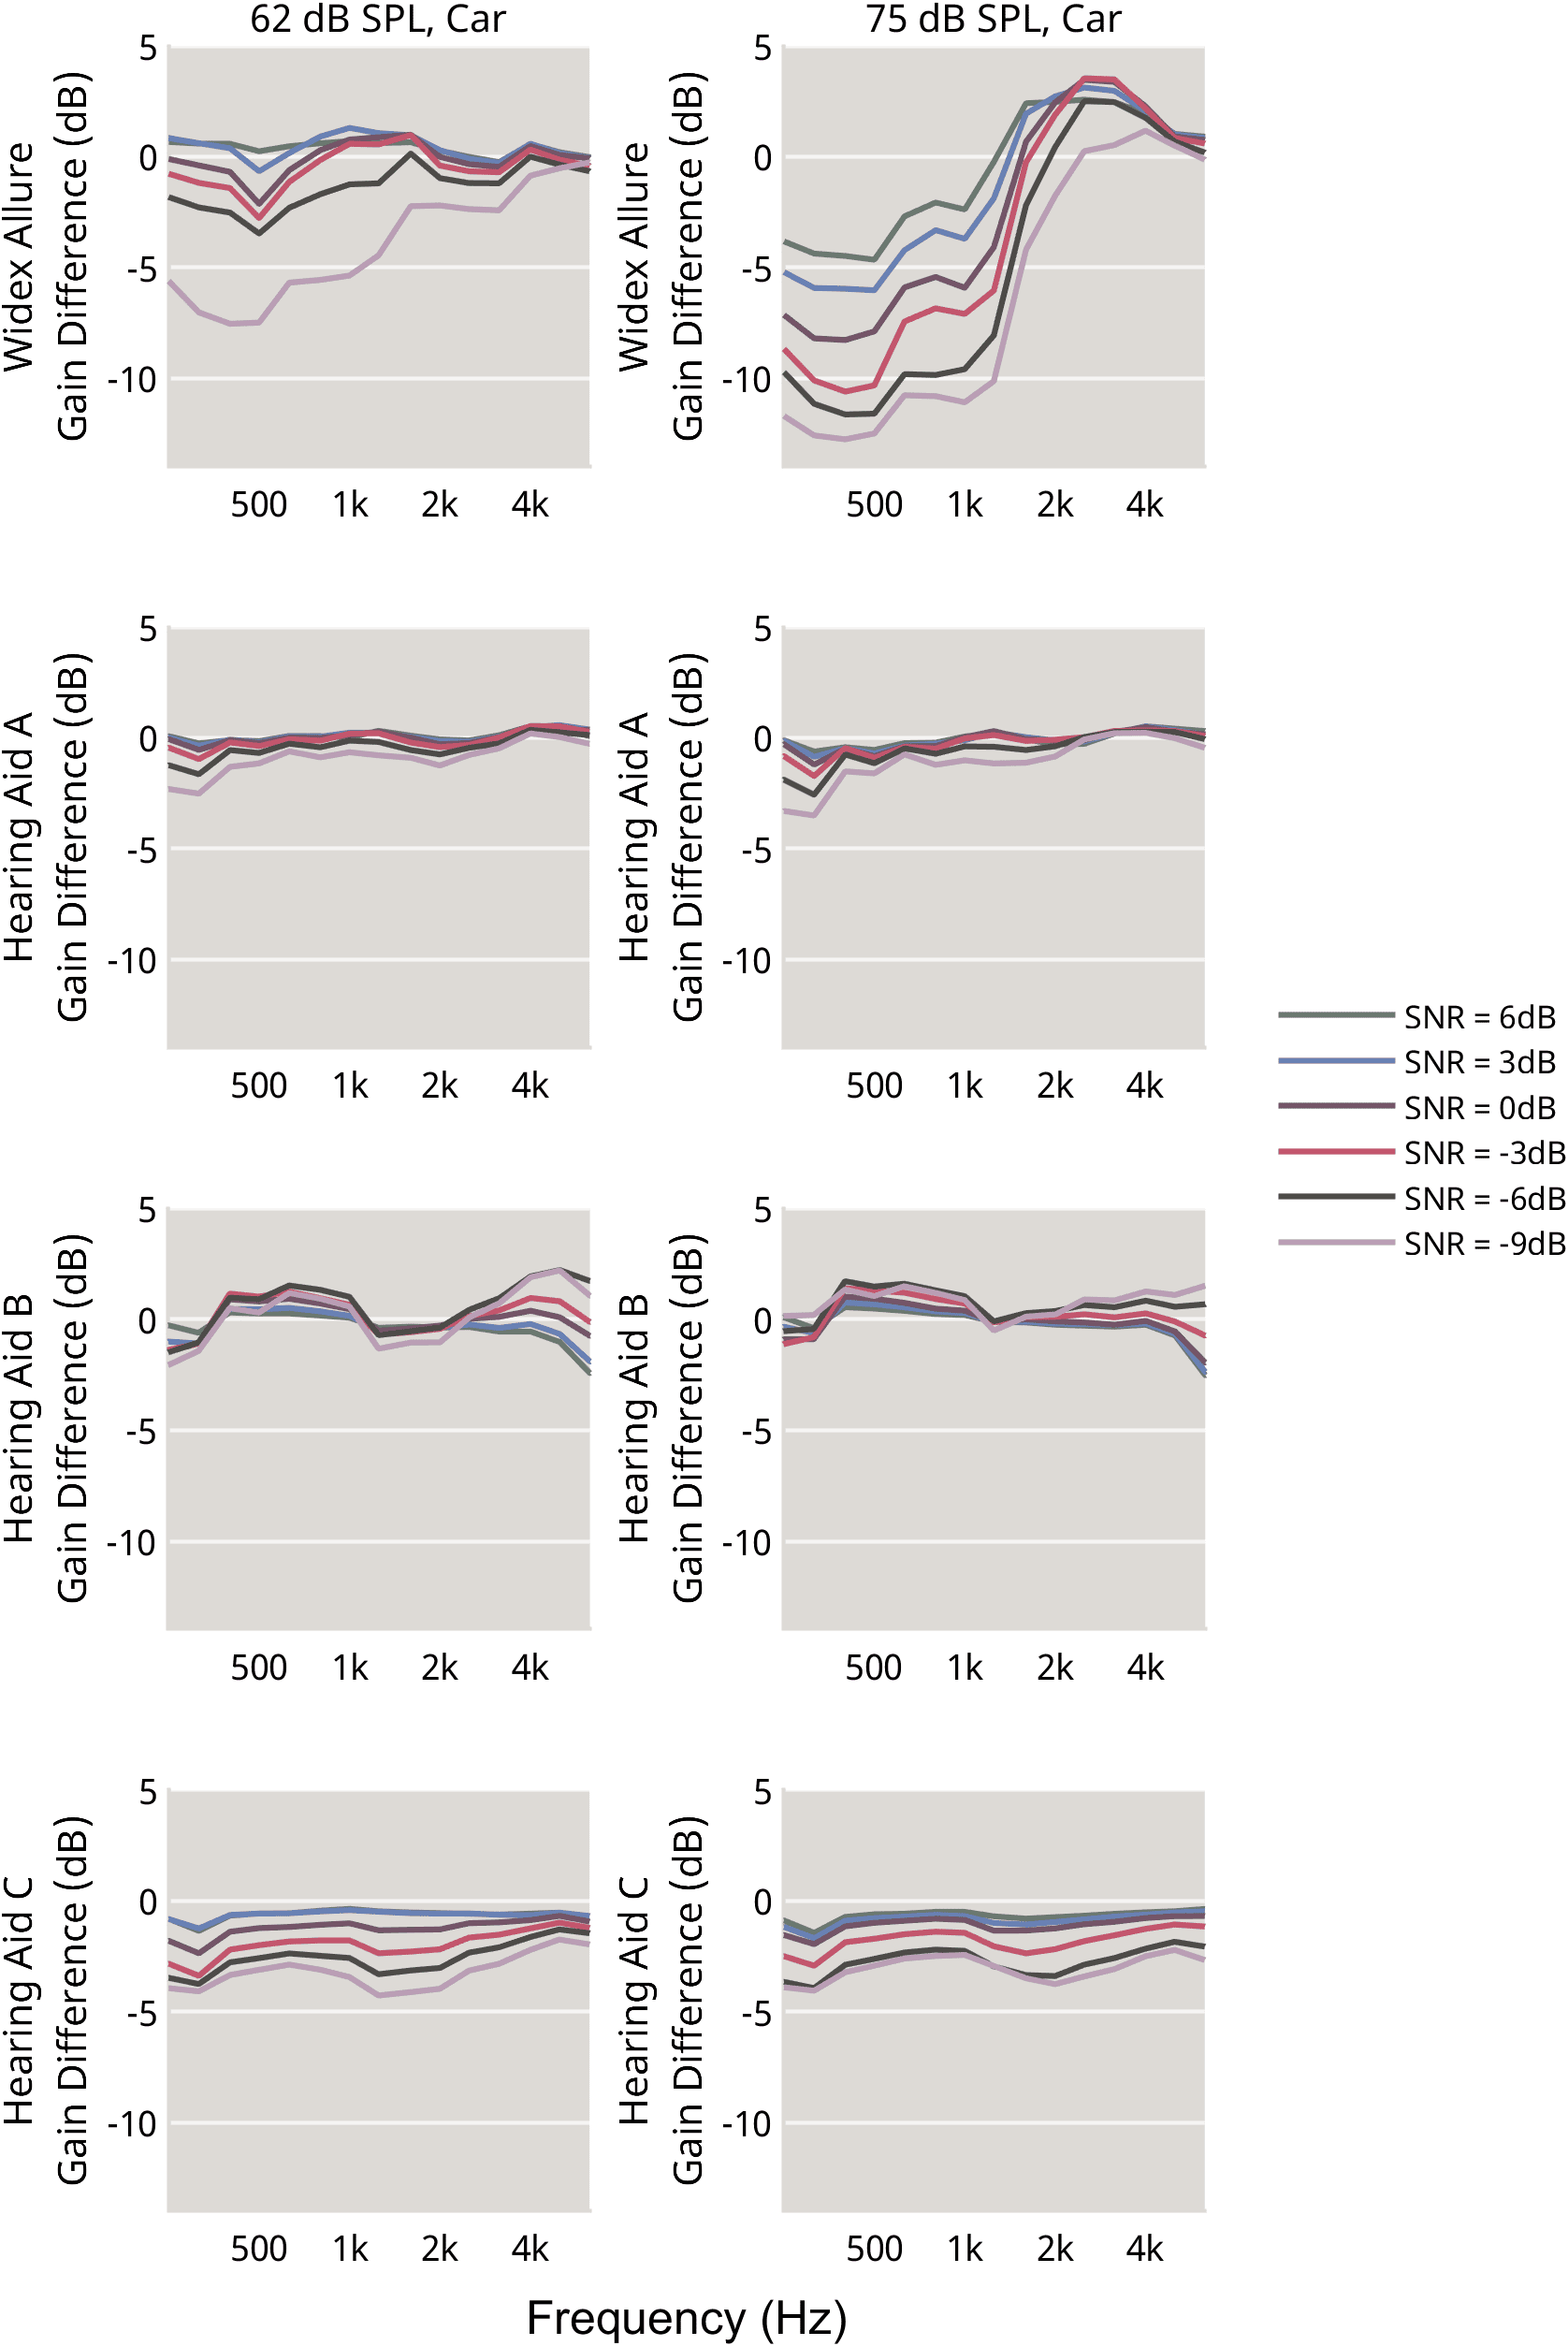
The long-term plots in Figures 2 and 3 are useful for getting an overview of how the different noise reduction mechanisms operate, but the possibility remains that averaging across the relatively long time window of 30 seconds makes fast-acting changes to the output invisible. To investigate this, we also analyzed the measurements in much shorter time windows of 40ms. These analyses are summarized in Figures 4 and 5, which show the distribution of output reduction for all 40 ms segments, with the colored lines representing the medians, the color-shaded area the range from the 25th to the 75th percentile, and the gray-shaded area the range from the 5th to the 95th percentile.
For reasons of space, the figures include only the results for the higher speech input level, but the trend is the same for all short-term analyses as it was for the long-term results shown in Figures 2 and 3: The Widex Allure noise reduction reduces output more; differentiates more between the different SNRs, SPLs, and backgrounds; and targets output reduction in the lower frequencies, while preserving the more speech-critical higher frequencies. For the other hearing aids, the short-term analyses suggest more active but also more variable noise reduction for hearing aid B, so that it looks less similar to hearing aid A than it did for the long-term analyses.
Perspectives
The measurements reported here show substantial variation in noise reduction between different hearing aids. One contributing factor is likely the Widex fitting rationale, which gives more gain in the lower frequencies for a full and balanced sound experience. This means that more output is available for the noise reduction to reduce. It also means that noise reduction in the lower frequencies is crucial for ensuring that the additional gain in the lower frequencies does not result in upward spread of masking impacting speech understanding negatively. However, rationale differences alone cannot explain the substantial differences seen in the measurements.
Instead, the explanation comes back to the fundamental differences in processing principles, with Widex Allure emphasizing a fine-grained response to the environment, in accordance with the first principle of noise reduction outlined above. The measurements relate less directly to the second principle – balance between target and background – though the small gain differences seen for hearing aids A, B, and C may be due to them relying on more aggressive directionality, instead of the general noise reduction measured here. Such a strategy risks distorting the balanced awareness and natural representation of both target and background.
The measurements illustrate the Widex emphasis on noise reduction that responds in a fine-grained way to the environment by taking into account signal-to-noise ratio, input level, noise type, and frequency composition. This results in noise reduction that works across a variety of real-life environments, helping users experience a balance between clear speech and natural awareness of the environment.
Petra Herrlin is a senior research audiologist and Karolina Smeds, PhD, a principal scientist at ORCA Labs in Stockholm, Sweden, while RD Communication Specialist Naim Mansour, PhD, Scientist Frederik Nielsen, and Senior Evidence and Research Manager Laura Winther Balling, PhD, all work at WS Audiology in Lynge, Denmark.
References
[1] Hagerman B. Sentences for testing speech intelligibility in noise. Scand Audiol. 1982;11(2):79-87. doi:10.3109/01050398209076203
[2] Nilsson M, Soli SD, Sullivan JA. Development of the Hearing in Noise Test for the measurement of speech reception thresholds in quiet and in noise. J Acoust Soc Am. 1994;95(2):1085-1099. doi:10.1121/1.408469
[3] Wu YH, Stangl E, Chipara O, Hasan SS, Welhaven A, Oleson J. Characteristics of Real-World Signal to Noise Ratios and Speech Listening Situations of Older Adults With Mild to Moderate Hearing Loss. Ear Hear. 2018;39(2):293-304. doi:10.1097/AUD.0000000000000486
[4] Smeds K, Wolters F, Rung M. Estimation of Signal-to-Noise Ratios in Realistic Sound Scenarios. J Am Acad Audiol. 2015;26(2):183-196. doi:10.3766/jaaa.26.2.7
[5] Johnson EM, Healy EW. The Optimal Speech-to-Background Ratio for Balancing Speech Recognition With Environmental Sound Recognition. Ear Hear. 2024;45(6):1444-1460. doi:10.1097/AUD.0000000000001532
[6] Balling LW, Vormann M, Mansour N. Widex Allure: A Better Speech-in-Noise Experience with Balanced Focus and Awareness. WidexPress, vol. 55, 2025.
[7] Balling LW, Mosgaard LD, Helmink D. Signal processing and sound quality. Hearing Review. 2022;29(2):20-23.
[8] Kuk FK and Paludan-Müller C., Noise-management algorithm may improve speech intelligibility in noise. Hearing Journal. 2006;59(4):62–71
[9] American National Standards Institute. American National Standard: Methods for the Calculation of the Speech Intelligibility Index (ANSI S3.5-1997). 1997.
[10] Peeters H, Kuk F, Lau CC, Keenan D. Subjective and objective evaluation of noise management algorithms. J Am Acad Audiol. 2009;20(2):89-98. doi:10.3766/jaaa.20.2.2
[11] Fela RF, Pastor A, Le Callet P, Zacharov N, Vigier T, Forchhammer S. “Perceptual Evaluation on Audio-Visual Dataset of 360 Content. 2022 IEEE International Conference on Multimedia and Expo Workshops (ICMEW), IEEE, Jul. 2022, 1–6. doi: 10.1109/ICMEW56448.2022.9859426
[12] Holube I, Fredelake S, Vlaming M, Kollmeier B. Development and analysis of an International Speech Test Signal (ISTS). Int J Audiol. 2010;49(12):891-903. doi:10.3109/14992027.2010.506889
[13] Bisgaard N, Vlaming MS, Dahlquist M. Standard audiograms for the IEC 60118-15 measurement procedure. Trends Amplif. 2010;14(2):113-120. doi:10.1177/1084713810379609
[14] Keidser G, Dillon H, Flax M, Ching T, Brewer S. The NAL-NL2 Prescription Procedure. Audiol Res. 2011;1(1):e24. Published 2011 Mar 23. doi:10.4081/audiores.2011.e24
[15] Mueller G, Stangl E, Wu Y-H. Comparing MPOs from six different hearing aid manufacturers: Headroom considerations. Hearing Review. 2021;28(4):10-16.