Research | May 2017 Hearing Review
A comparison of audiology best-practice services versus an OTC delivery model
The authors present a summary of findings from their recent study published in the March 2017 edition of the American Journal of Audiology that compares a professionally driven best-practice hearing aid service delivery model to a version of an over-the-counter (OTC) model. One important message that should not be lost in the extremely relevant findings of this RCT study is that hearing aids are, in fact, efficacious and provide considerable benefit to older adults with mild-to-moderate hearing loss.
Approximately 35% of Americans over age 65 have a significant hearing loss sufficient to make them hearing aid candidates.1,2 Yet, only about 20% of those older Americans who could benefit from hearing aids actually seek them out, and of those who do, only about 40-60% are satisfied with them and use them regularly.3 These figures for hearing aids, moreover, are similar for the UK and elsewhere.4,5
The large discrepancy between the number of older adults in need of hearing healthcare and those receiving benefit from hearing aids was one of the motivating factors behind the organization of a National Institute of Deafness and Other Communication Disorders/National Institutes of Health (NIDCD/NIH) working group on accessible and affordable hearing health care for adults with mild-to-moderate hearing loss. This international working group identified research areas that could lead to the improvement of hearing healthcare for adults with such hearing loss; in particular, enhancing the accessibility and affordability of hearing healthcare.6
This clinical trial addressed three high-priority research questions identified and summarized by the NIDCD/NIH working group6:
- How can current delivery systems (including the system and the provider) be utilized or modified to increase accessibility and affordability of hearing healthcare?
- What is the comparative effectiveness between two delivery schemes (current best practice vs others) with technology held constant?
- What is the minimal hearing health care delivery system needed for successful outcomes and quality care?
Although the study is limited to a generalization of findings due primarily to its white, middle-class, educated study sample, it is unique because it represents:
- The first-ever, placebo-controlled, double-blind randomized clinical trial (RCT) of hearing-aid efficacy in older adults, and
- The first comparison of a standard best-practices audiology-based model to an over-the-counter (OTC) service-delivery model that has the potential to increase accessibility and affordability of hearing aids.
Two recent high-level reports, one by the US President’s Council of Advisors on Science and Technology (PCAST)7 and one by the US National Academies of Science, Engineering, and Medicine (NASEM),8 have reinforced the importance of these questions in addressing the hearing healthcare needs of millions of older Americans. One of the alternative service-delivery models advocated in the National Academies’ report8 is an OTC model, one version of which was examined in this trial. US Senators Warren and Grassley have introduced Federal legislation to open the door for OTC devices and service-delivery on a widespread basis.9
No prior placebo-controlled, randomized clinical trial of hearing aid efficacy has been published. As a result, this trial included a comparison of the treatment effects of two service-delivery models for the provision of hearing aids to older adults, each relative to the performance of placebo controls. The two service-delivery models evaluated were the current audiology best practice model and an experimental OTC model that did not involve an audiologist in the delivery of the hearing aids to the patients.
A much more detailed and thorough presentation of this clinical trial and its results has been published in the March 1, 2017 edition of the American Journal of Audiology (AJA).10 The more detailed and lengthier report targets other audiology professionals, hearing scientists, and hearing-aid dispensers as the primary audience.
In the brief report here, the targeted readership includes many of these same readers, but provides a less dense overview of the primary methods and findings. The anticipated audience is also broader—including many other professionals who might be the initial contact for older adults who express concerns about their hearing or who seek out hearing aids. As will become apparent, one of the important messages from this double-blind placebo-controlled randomized clinical trial is that hearing aids are, in fact, efficacious and provide considerable benefit to older adults with mild-to-moderate hearing loss.
Methods
This was a placebo-controlled, double-blind randomized clinical trial with three parallel branches:
1) Audiology-based (AB) best-practices service delivery;
2) Consumer-decides (CD) or OTC service delivery; and
3) Placebo (P).
The purchase price of the hearing aids provided to the participants was also manipulated: either a “typical” purchase price of $3,600 or a reduced purchase price of $600 for both hearing aids. Purchase price was manipulated because the OTC service-delivery model typically has been envisioned as one that delivers devices at lower prices than the audiology-based best practices service delivery model.
However, there are no data available on the effects of purchase price alone on outcomes. As a result, factorial combinations of service delivery and purchase price were used to evaluate the impact of each of these variables separately and in combination. In the end, no significant (p>0.05) main effects of, or interactions with, purchase price were observed for aided outcome measures. (A full factorial analysis of the six combinations of service delivery and purchase price is presented in detail in the original AJA article.10) As a result, data for each service-delivery model were pooled across purchase prices in all subsequent presentations of data and analyses in this report.
Subjects and Session 1 procedures. All procedures for this protocol were reviewed and approved by the Indiana University Institutional Review Board (IRB). Participants were recruited primarily by ads posted in local newspapers and around the community. Those interested contacted the Clinical Trials Coordinator (CTC) by phone for an initial eligibility screen and then arranged an initial assessment to make a final determination of eligibility (Session 1). Inclusion and exclusion criteria are provided in detail elsewhere.10 After informed consent was obtained from each participant for Session 1, measures completed were:
- A detailed case history;
- Otoscopic examination of both ears;
- A complete audiological assessment, including pure-tone audiometry, speech audiometry (both speech-recognition thresholds and word-recognition scores), and immittance measurements (tympanometry and acoustic reflex thresholds), and
- The Mini Mental State Exam (MMSE).11
A sound-field measure of speech audiometry included in Session 1 was the Connected Speech Test (CST).12 This unaided CST score was used to block study participants prior to randomization (see below). One of two audiologists, A1 or A2, were assigned to complete these Session 1 measures.
A total of 323 individuals were assessed for eligibility; 188 were eligible for enrollment following Session 1, and 163 of these individuals enrolled. The trial commenced November 2, 2012 and data collection ended August 31, 2016.
The 163 participants who enrolled in the trial were separately consented for participation in Sessions 2 and 3, agreed to return for Session 2 (typically the next day), and were subsequently randomized to one of three groups: AB, CD, or P. Details regarding the randomization process can be found in the previous AJA report.10 As explained in more detail in that report, the CD and P participants, at the conclusion of the 6-week trial, were given the opportunity for an additional 4-week trial making use of hearing aids delivered via audiology-based best practices. Almost all of these individuals opted for the additional trial period and the results of that additional trial can also be found in the original report.10 Of the 163 participants who enrolled, 98% self-reported their race as “white” and their ethnicity as “not Hispanic or Latino,” 78% had a college degree, and 80% reported annual household income greater than $45,000. The top portion of Table 1 provides other demographic information for each group.
Study devices. The study devices were ReSound Alera digital, mini behind-the-ear (BTE) open-fit hearing aids having 9 compression channels and 4 programs available. These mini-BTE, open-fit devices are representative of the most popular type of hearing aid sold in the United States to older adults.12 Default programming for all devices made use of fixed directional microphones, dynamic feedback suppression, and noise reduction. Some placebo devices (N=35) made use of omni-directional microphones and others (N=20) made use of the default directional microphones. With one exception (see below), there were no significant differences (p>.05) in outcome measures between these two placebo implementations, and these data were pooled to represent the entire placebo group (see original report10 for full details). All markings and materials revealing manufacturer or model of the devices were obscured. Manufacturer and model were revealed to all participants only after the conclusion of the entire trial. All hearing-aid fits were bilateral.
Session 2 procedures. The procedures in Session 2 varied with group assignment. First, for all participants, unaided baseline scores were collected for two self-report outcome measures: The 66-item Profile of Hearing Aid Performance (PHAP)13 and the 25-item Hearing Handicap Inventory for the Elderly (HHIE).14
Audiology best practices (AB) and placebo (P) groups. For groups AB and P, the procedures in Session 2 were nearly identical except that the hearing aids for the placebo participants were programmed to be acoustically transparent (ie, no electroacoustic compensation for the participant’s hearing loss was provided by the placebo devices). For those in group AB, target gain prescriptions were generated using the common NAL-NL2 formula16 to compensate for the participant’s hearing loss.
For both AB and P participants, verification of the desired acoustic output of the hearing aids was accomplished via a tiny probe-tube microphone inserted into the ear canal, with good matches between prescribed and measured real-ear responses achieved for the AB group.10 Flat 0-dB insertion gain was also verified with real-ear measurements for the placebos. In both cases, the matching criterion was for measured values to be within 4 dB of target from 250-4000 Hz, but measured values within 7 dB of target were acceptable, especially in the higher frequencies (? 2000 Hz).
Audiologist A1 or A2 did the hearing aid programming, real-ear verification, and any required fine-tuning to match targeted output. A third audiologist, A3, was blinded regarding group AB or P and was involved with the remainder of Session 2 for these two groups. This consisted of a 45 to 60-minute hearing aid orientation session, during which audiologist A3 reviewed the components, features, and function of the hearing aids, the insertion and removal of batteries, the insertion and removal of the hearing aids, maintenance practices, telephone use, and adjustment of volume. Supervised hands-on practice was provided for several of these skills. Participants were also counselled about benefits and limitations of hearing aids and effective communication strategies to use. All participants (AB, CD, P) also received a written user’s guide for the hearing aids.
The use of probe-tube microphone measurements to fine-tune the devices to the hearing aid wearer’s hearing loss and the inclusion of hearing aid orientation information, including hands-on practice with these skills, are considered to be to critical aspects of audiology best practices (AB).17,18 Participants in both AB and P groups received these services; participants in Group CD, however, did not receive real-ear adjustments of their hearing aids’ response or a hearing aid orientation.
Consumer-decides (CD) group. For the CD participants, Session 2 commenced with the CTC escorting the participant to a small room. On a table were containers for the ear tips and tubing to be used and three bins containing 6 hearing aids each, with the hearing aids in each bin differing only in color (grey, beige, brown). Each bin was partitioned into three compartments, each containing a pair of hearing aids labeled X, Y, or Z, and programmed in advance to match the NAL-NL2 acoustic output prescriptions for three of the most common patterns of hearing loss among older adults in the United States.19
The participant watched a brief instructional video overviewing the hearing aid self-selection process then completed each step of the self-selection process. (This video is available online with the AJA article.10) A hardcopy of the step-by-step instructions was also provided to the participant with the contents based on work with self-fitting hearing aids.20 The CD participant first selected an appropriate-sized ear tip and tube, then the desired hearing aid color, examining several in a mirror, then the particular acoustic characteristics desired (X, Y, or Z). A compact-disc player was available to provide standardized samples of speech, music, and environmental sounds for listening. Participants were allowed to have a significant other in the room with them during the selection process, but only one opted to do so.
When the participant’s selections were finalized, the participant pressed a button to alert the CTC that the selections had been made. Details regarding the choices made by the CD participants with regard to the tubing, ear tip, and hearing aid gain characteristics selected are provided elsewhere.10 In general, though, the CD participants tended to select hearing aids programmed with gain somewhat less than that prescribed for their hearing loss as indicated by the NAL-NL2 prescription formula.
Session 3 procedures. During Session 3, typically 6 weeks after the initial fit of the hearing aids in Session 2 (M = 44.5; SD = 10.1 days), either audiologist A1 or A2 (the one not involved in Session 2 programming) obtained electroacoustic performance measures “as worn” for each hearing aid, then inspected the hearing aids, tubes, and ear tips.
Outcome measures were then obtained by another audiologist, A4. A4 was blind to participant group. The primary outcome measure for this trial was the Profile of Hearing Aid Benefit (PHAB). The Profile of Hearing Aid Performance (PHAP) was administered prior to (unaided, Session 2) and following a 6-week period of hearing-aid use (aided, Session 3), with the difference in ratings on the questionnaire used to compute the PHAB scores. The PHAB was chosen because of its comprehensive assessment of self-reported hearing aid benefit, especially with regard to speech communication, across a wide range of everyday listening conditions. It has also been proven to be reliable14 and was used in one of the few prior clinical trials of hearing aids.23 The five speech-communication subscales of the PHAB were averaged to form a single global score, PHABglob, as the primary outcome measure in this study. The remaining two subscales deal with the perception of aversive and distorted sounds and were also averaged, yielding PHABavds as another measure. Based on prior research,14,21 however, hearing aids are not expected to improve the PHABavds scores.
Estimates of treatment effects, effect sizes, and common standard deviations for the primary outcome measure were derived from analyses of the de-identified raw data from an earlier clinical trial of hearing aids.21 In that trial, multiple unaided and aided PHAP scores were obtained from over 300 participants. To estimate the placebo effect, no effect was assumed and the difference between two separate unaided measures for the PHAP were computed to calculate the PHABglob measure for the placebos.
For an estimate of the aided benefit, the data for the hearing aid circuit closest to that in the present study (single-channel wide-dynamic-range-compression) were used. A total of 40 random samples of the full data set from this prior trial, targeting 50% of the sample in each group, were selected to generate expected independent-group placebo effects, AB treatment effects, and standard deviations for this outcome measure. This was necessary due to the absence of standard deviations in prior published reports of the PHAB from the prior clinical trial and to the unavailability of comparable PHABglob scores in these and other datasets.
For the primary outcome measure in the proposed project, the PHABglob, the estimate of the mean placebo effect was 0.02 and the mean aided effect was 0.28, yielding a mean treatment effect of 0.26 (SD=0.18) for PHABglob relative to the simulated placebo. Assuming the experimental OTC intervention (CD) was half as effective, PHABglob = 0.13, then a sample size of 31 per group would be needed to detect this difference in outcome between the AB and CD groups with power = 0.80 and a Type 1 error rate of 0.05 (nQuery Advisor, V7.0). When each of the six groups in the full factorial model (3 service delivery arms x 2 purchase-price groups) reached about 80% of the enrollment targets, a preliminary analysis revealed the lack of significant main effects and interactions for purchase-price. Enrollments ceased at this point, given 53-55 participants for each of the three service-delivery groups (AB, CD, P).
The secondary outcome measure to be used in this clinical trial was derived from the unaided and aided CST speech-recognition scores. This measure was included because, unlike the self-report PHAB, the CST assesses unaided and aided speech understanding directly by asking the listener to repeat back sentences heard in a background of competing speech. Moreover, the sentences all relate to a common topic which was provided to the listener prior to presentation. This adds to the face validity of the test as a measure of everyday speech communication which typically involves sentences, competing speech, and topics of conversation known to the listener. Further, the reliability of this test in older adults with impaired hearing had been established.12 The secondary outcome measure was based on the difference in aided and unaided CST scores, CST benefit. Each CST score was based on two passage pairs or 100 keywords and was obtained for a speech level of 65 dB SPL and a signal-to-babble ratio (SBR) of +3 dB. The speech level and SBR are similar to those used previously for the CST, including in a randomized clinical trial comparing hearing aids.21
Because hearing aid outcome in older adults has been demonstrated to be a multidimensional construct with 3-4 dimensions,22-24 some additional outcome measures were obtained from all participants. These included self-reported benefit measured as the difference between the unaided and aided HHIE scores, using 32 items of a 42-item survey of satisfaction with hearing-aid function,25,26 referred to here as the Hearing Aid Satisfaction Survey (HASS), and the average daily usage of the hearing aid in hours/day obtained for the datalogging feature of the digital hearing aids used in this trial.
Results
![Table 1. Means (M) and standard deviations (SD) for demographic measures, unaided baseline scores, and outcome measures for the audiology best-practices (AB) group (N=53; 28 males), consumer decides (CD) group (N=55; 27 males), and placebo (P) group (N=55; 37 males) in this clinical trial. Significant (p<.05) ANOVA values [F(df)] are shown in bold. *PTA = pure-tone average with hearing thresholds averaged bilaterally at 500, 1000, and 2000 Hz; HFPTA = high-frequency PTA with hearing thresholds averaged bilaterally at 1000, 2000, and 4000 Hz; ^N = 35 placebos with omni-directional microphones; #For HASS and Usage, per-protocol analyses (N = 154) and df = 2, 151.](https://hearingreview.com/wp-content/uploads/2017/05/Humes_Table1.png)
Table 1. [Click on images to enlarge.] Means (M) and standard deviations (SD) for demographic measures, unaided baseline scores, and outcome measures for the audiology best-practices (AB) group (N=53; 28 males), consumer decides (CD) group (N=55; 27 males), and placebo (P) group (N=55; 37 males) in this clinical trial. Significant (p<.05) ANOVA values [F(df)] are shown in bold. *PTA = pure-tone average with hearing thresholds averaged bilaterally at 500, 1000, and 2000 Hz; HFPTA = high-frequency PTA with hearing thresholds averaged bilaterally at 1000, 2000, and 4000 Hz; ^N = 35 placebos with omni-directional microphones; #For HASS and Usage, per-protocol analyses (N = 154) and df = 2, 151.
The placebo group (P) was included because no prior studies had done so to establish the efficacy of the best-practices audiology-based intervention (AB) group. For the CST benefit measure, only the 35 placebo participants with omni-directional microphones were included because those placebos with directional microphones (N=20) had significantly (p<0.05) greater CST benefit, although this was largely due to differences in unaided performance. For a more detailed description of these two placebo implementations and the analyses of the effects of the microphone setting for the placebo groups, see the AJA report.10
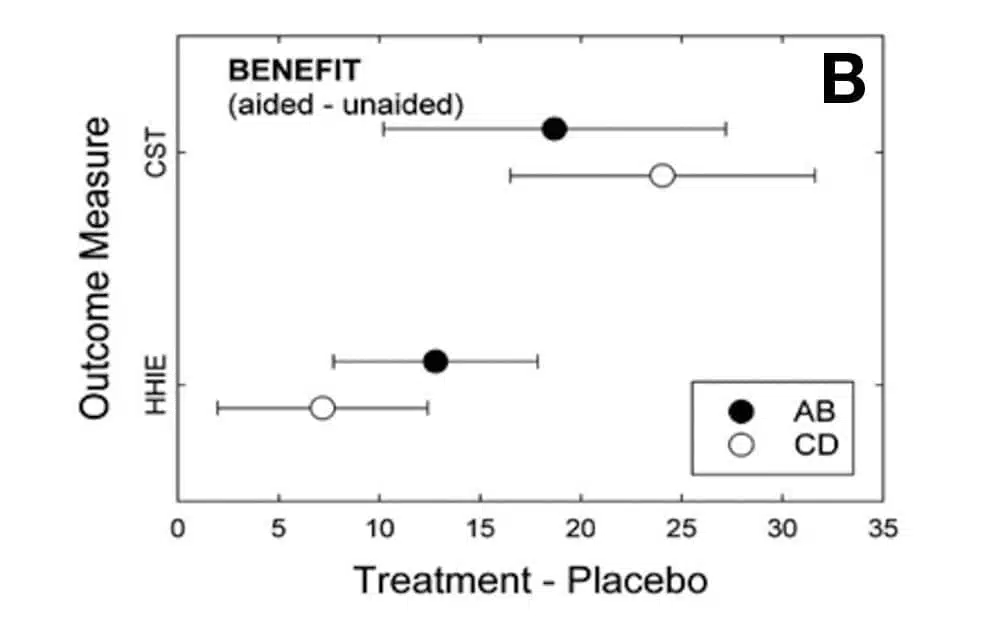
The filled and unfilled circles in Figure 1 show the mean effects of each treatment, AB or CD, relative to placebo (P). For all outcome measures shown in Figure 1, better performance is indicated by positive values. The horizontal error bars represent 95% confidence intervals about the means.

Figures 1a-c. [Click on image to enlarge.] Means (circles) and 95% confidence intervals (error bars) for difference between treatment (AB, filled; CD, unfilled) and placebo for each of the six outcome measures used in the clinical trial. Top (1a): PHAB outcome measures, intention-to-treat analysis; Middle (1b): CST (in RAU; N =35 for P) and HHIE benefit, intention-to-treat analysis; Bottom (1c): Satisfaction (HASS) and Usage (hrs/day), per-protocol analysis (N=154).
Figure 1b depicts benefit measures—the difference between aided and unaided values—for both the CST and the HHIE. For the CST, all percent-correct scores were transformed into rationalized arcsine units (RAU) to stabilize the error variance.27 Once again, both the AB and CD models yielded efficacious outcomes relative to the placebo controls and for both of these measures. In addition, the magnitude of the changes in performance for each outcome measure—about 20-25 RAU for the CST and 8-12% for the HHIE—would both be considered to be clinically significant improvements.
Figure 1c shows the results for two additional dimensions of outcome: self-reported satisfaction (HASS) and daily hours of usage (per-protocol analyses; ie, the limited missing data were excluded rather than replaced via regression, N=154). For these outcome measures, only aided post-fit measures are possible, rather than a relative difference from unaided to aided as in the other outcomes in Figure 1. For satisfaction, only the AB group demonstrated significantly (p<0.05) greater satisfaction than the placebos, although the magnitude of this change would not likely be considered to be of clinical or practical significance given that it does not represent a change of at least one unit on the 5-point rating scale. For daily hours of usage, neither group differs significantly (p>0.05) from the placebos.
Effect sizes (Cohen’s d28) were calculated for both AB and CD groups relative to the placebos from the data presented in Table 1. Most of the d values observed in this trial for both groups are considered moderate (three, 0.47-0.69) or large (four, 0.89-1.19) effect sizes.28 Exceptions are PHABavds and Usage for both AB (-0.02, 0.29) and CD (-0.07, 0.03) groups, and HASS for the CD group (0.11). Further, as noted above, the magnitude of the changes for each outcome measure are large enough to be considered clinically significant.
At the end of the trial, each participant who completed the trial (N=154) was asked to indicate, based on their experience over the 6-week trial, whether they were likely to keep the hearing aids or return them for a refund. For the AB group, 81% indicated that they would keep the hearing aids, whereas only 55% of the CD group and 36% of the placebo group planned to keep them. Chi-square testing revealed the AB percentage to be significantly (p<.05) greater than both CD and P percentages, but the difference between the CD and P groups was not significant.
Discussion
This article overviews the key aspects of the first placebo-controlled, double-blind randomized clinical trial of hearing aid efficacy in older adults.10 Generally, positive outcomes were observed for AB and CD groups. For the primary and secondary outcome measures, PHABglob and CST benefit, respectively, both the AB best-practices and the CD OTC service-delivery models were efficacious. This was also true for another measure of self-reported benefit based on the HHIE and, for the AB model only, for a measure of hearing-aid satisfaction (HASS).
On the other hand, neither AB nor CD participants demonstrated efficacy with regard to average hours of daily usage. This was due, in large part, to the placebo participants wearing their hearing aids an average of nearly 6 hours per day (Table 1). Placebo participants were essentially AB participants with hearing aids programmed to provide no actual acoustic gain to compensate for their hearing loss. As a result, the placebo participants received the same counseling, orientation, and hands-on practice in working with the devices as the AB participants, the latter group averaging closer to 7 hours usage per day. The CD participants, however, received none of this instruction from the audiologist and still used their hearing aids about the same amount of time.
Study limitations. There are limitations to the generalization of these findings due to the primarily white, middle-class, highly educated study sample. Generalization to other samples of older adults with differing demographics is not possible without additional data. Further, it’s important to note that only one device was investigated here: a high-quality, open-fit behind-the-ear hearing aid. It is not possible to generalize these positive findings to other devices, including simpler devices of possibly lesser quality envisioned by some as OTC devices of the future.
The CD service-delivery model examined here and found to be efficacious is only one of several conceivable OTC service-delivery models. As other OTC models develop, their efficacy will also need to be established.
Moreover, it is important to note that all participants in this study received a thorough audiological examination in Session 1 to determine candidacy for the trial hearing aids. It is conceivable that some OTC service-delivery models would forego this initial audiological examination. Of course, the results from the current trial cannot be used to validate other OTC models or clinical protocols which might exclude any of the protocol procedures completed here.
Finally, there were 4 older adults assigned randomly to the CD group who were unable to self-select the tubes, ear tips, and hearing aids—skills that were central to this service-delivery model. This approach is clearly not a universal alternative, as 7% of the CD group was unable to select their devices. This percentage, moreover, may have been higher without the MMSE selection criterion used in this trial or with a less highly educated sample.
Acknowledgements
This article is based on data from a comprehensive paper10 published in the March 2017 edition of the American Journal of Audiology (also see reference in box below). We thank Kimberly Skinner, AuD, for assistance with data collection and Stephanie Dickinson for help with statistical analyses. This trial was supported by a research grant to the first author from the National Institute of Deafness and other Communication Disorders (NIDCD), R01 DC011771. We also thank Laurel Christensen, Andree Girard, Jennifer Groth, Dena Sloan-Gordon, and Tammara Stender for their assistance with study hearing aid programming and technical support. No funding was received from GN ReSound in support of this trial and all hearing aids were purchased from the manufacturer in large quantities at a price of $100 per hearing aid.
All authors had financial support from the National Institutes of Health (NIH) via a research grant to the university for the submitted work; no financial relationships with any organizations that might have an interest in the submitted work in the previous three years; no other relationships or activities that could appear to have influenced the submitted work.
References
-
Schoenborn CA, Marano M. Current estimates from the National Health Interview Survey. Vital Health Stat. 1988;10(166):1-233.
-
Cruickshanks KJ, Zhan W, Zhong W. In Gordon-Salant S, Frisina RD, Popper AN, Fay RR. The Aging Auditory System: Perceptual Characterization and Neural Bases of Presbycusis. Springer Handbook of Auditory Research (SHAR). New York: Springer-Verlag; 2010:259-274.
-
Kochkin S. MarkeTrakVIII: 25-year trends in hearing health market. Hearing Review. 2009; 16(11):12-31. Available at: https://hearingreview.com/2009/10/marketrak-viii-25-year-trends-in-the-hearing-health-market
-
Dawes P, Fortnum H, Moore D, et al. Hearing in middle age: A population snapshot of 40- to 69-year olds in the United Kingdom. Ear Hear. 2014; 35, 44-51.
-
Perez E, Edmonds BA. A systematic review of studies measuring and reporting hearing aid usage in older adults since 1999: a descriptive summary of measurement tools. PLOS ONE 2012;7(3):e31831.
-
Donahue A, Dubno JR, Beck L. Guest Editorial: Accessible and affordable hearing health care for adults with mild to moderate hearing loss. Ear Hear. 2010; 31: 2-6.
-
President’s Council of Advisors on Science and Technology. Aging America and Hearing Loss: Imperative of Improved Hearing Technologies. Letter report to the US President, final draft, October 2015; Washington, DC. Available at: http://www.hearing.org/uploadedFiles/Content/HIA_Updates_and_Bulletins/pcast_hearing_tech_letterreport_final.pdf
-
National Academies of Sciences, Engineering, and Medicine. Hearing Health Care for Adults: Priorities for Improving Access and Affordability. Washington, DC: The National Academies Press; 2016. Available at: https://www.nap.edu/catalog/23446/hearing-health-care-for-adults-priorities-for-improving-access-and
-
Warren E, Grassley C. Over-the-counter hearing aids: The path forward. JAMA Internal Medicine. Published online 3/3/17. doi: 10.100/jamainternmed.2017.0464
-
Humes LE, Rogers SE, Quigley TM, Main AK, Kinney DL, Herring C. The effects of service-delivery model and purchase price on hearing aid outcomes in older adults: A factorial randomized double-blind placebo-controlled clinical trial. Am J Audiol. 2017 Mar 1;26(1):53-79. doi: 10.1044/2017_AJA-16-0111.
-
Folstein MF, Folstein SE, White T, Messer MA. Mini-Mental State Examination. 2nd ed. Lutz, Fla: Psychological Assessment Resources;2010.
-
Cox RM, Alexander GC, Gilmore C. Development of the Connected Speech Test (CST). Ear Hear. 1987; 8(5 Suppl): 119S-126S.
-
Kochkin S. MarkeTrak VIII: Mini-BTEs tap new market, users more satisfied. Hear Jour. 2011; 64(3):17-24.
-
Cox RM, Gilmore C. Development of the Profile of Hearing Aid Performance (PHAP). J Speech Hear Res. 1990; 33: 343-357.
-
Ventry IM, Weinstein BE. The Hearing Handicap Inventory for the Elderly: A new tool. Ear Hear. 1982; 3: 128-134.
-
Dillon H, Keidser G, Ching TYC, Flax MR, Brewer S. The NAL-NL2 prescription procedure. Phonak Focus. 2011;40: 1-10.
-
Valente M, Abrams H, Benson D, et al. Guideline for the Audiologic Management of Adult Hearing Impairment. Reston, Va: American Academy of Audiology; 2008. Available at: https://audiology-web.s3.amazonaws.com/migrated/haguidelines.pdf_53994876e92e42.70908344.pdf
-
American Speech-Language-Hearing Association. Hearing Aids for Adults. Hearing Loss (Adults) Online Evidence Map; 2015.
-
Ciletti L, Flamme GA. Prevalence of hearing impairment by gender and audiometric configuration: Results from the National Health and Nutrition Examination Survey (1999-2004) and the Keokuk County Rural Health Study (1994-1998). J Amer Acad Audiol. 2008; 19: 672-685.
-
Caposecco A, Hickson L, Meyer C. Assembly and insertion of a self-fitting hearing aid: Design of effective instruction materials. Trends Amplif. 2011; 15: 184-195.
-
Larson VD, Williams DW, Henderson WG, et al. Efficacy of 3 commonly used hearing aid circuits: A crossover trial. J Am Med Assoc. 2000; 284:1806-1813.
-
Humes LE. Issues in evaluating the effectiveness of hearing aids in the elderly: What to measure and when. Sem Hear. 2001; 22(3): 303-314.
-
Humes LE. Modeling and predicting hearing-aid outcome. Trends Amplif. 2003; 7:41-75.
-
Humes LE, Krull V. Evidence about the effectiveness of hearing aids in adults. In: Wong L, Hickson L, eds. Evidence Based Practice in Audiology. San Diego: Plural Publishing;2012.
-
Kochkin S. MarkeTrak V: Consumer satisfaction revisited. Hear Jour. 2000; 53(1): 38-55.
-
Humes LE, Garner CB, Wilson DL, Barlow, NN. Hearing-aid outcome measures following one month of hearing aid use by the elderly. J Speech Lang Hear Res. 2001;44:469-486.
-
Studebaker GA. A “rationalized” arcsine transform. J Speech Hear Res. 1985; 28: 455-462.
-
Cohen J. Statistical Power Analysis for the Behavioral Sciences. London: Routledge;1988.
DEDICATION: This report is dedicated to the memory of Dr Gordon Blackistone Hughes, MD, clinical trials coordinator for the National Institute on Deafness and Other Communication Disorders (NIDCD) from 2008-15. His guidance and assistance throughout this trial were critical to its success and are greatly appreciated by the authors.
CORRESPONDENCE can be addressed to HR or Dr Humes at: [email protected]
About the authors
Larry E. Humes, PhD, is a Distinguished Professor of Speech & Hearing Sciences; Christine Herring is the Clinical Trials Coordinator; and Dana L. Kinney, MA, Anna K. Main, AuD, Tera Quigley, AuD, and Sara E. Rogers, AuD, are Research Audiologists in the Department of Speech & Hearing Sciences at Indiana University in Bloomington, Ind.
ORIGINAL AJA ARTICLE REFERENCE: Humes LE, Rogers SE, Quigley TM, Main AK, Kinney DL, Herring C. The effects of service-delivery model and purchase price on hearing aid outcomes in older adults: A factorial randomized double-blind placebo-controlled clinical trial. Am J Audiol. 2017;26(1):53-79. doi: 10.1044/2017_AJA-16-0111
Citation for this article: Humes LE, Herring C, Kinney DL, Main AK, Quigley TM, Rogers SE. The effectiveness of hearing aids and two service-delivery models in older adults: A randomized double-blind, placebo-controlled clinical trial. Hearing Review. 2017;24(4):12-19. Available at: https://hearingreview.com/2017/05/effectiveness-hearing-aids-two-service-delivery-models-older-adults-randomized-double-blind-placebo-controlled-clinical-trial
For more discussion about this article, please see:
Tecca JE. A perspective on the Indiana University OTC outcome study. Hearing Review. 2017;24(7):18-24.
Humes L. Letters: Larry Humes Responds to “A Perspective on the Indiana University OTC outcome study.” Hearing Review. 2017;24(8):10.

The driving force for this study is the argument that affordability = access = increased patient update of hearing aids. Before diving into any of the comparisons between an OTC delivery model vs a best practices model, I believe a study should be performed to see if the desired effect would even be achieved of a greater hearing aid uptake as cost decreases while holding everything else constant. This is a rhetorical inquiry as I believe we all have a pretty good idea of what the outcome would be.
I would like to translate this wonderful paper into Chinese and put it in my professional website (for audiologists and hearing aid dispensers). Thanks for your copyright consideration.