The most common type of hearing loss is more severe in the higher than in the lower frequencies. To compensate for the loss of sensitivity in the high frequencies, manufacturers and dispensing professionals have worked hard to maximize high-frequency gain.
However, current research and clinical experience have led us to question the conventional, boost-the-highs-cut-the-lows approach. For some patients with high-frequency hearing loss, maximizing high-frequency gain may not be the best solution to the problem of optimizing speech intelligibility. Evidence suggests that, for some severe high-frequency losses, reducing high-frequency gain improves results.
This article reviews recent research on speech intelligibility in high-frequency hearing losses and relates these data to knowledge of cochlear “dead regions.” In addition, it describes “high-frequency management,” an alternative approach that represents a new way to address the needs of this common type of hearing disorder.
Historical Perspective
In 1986, the introduction of the Class D integrated receiver allowed amplification of speech across a wider bandwidth than was available with the older Class A circuit. This ability was heralded as a new solution to the problem of getting adequate gain for high-frequency hearing losses.
However, those who touted the benefits of the “new” approach found that, while many patients accepted it very well, others complained that the sound quality and clarity were not as good as their old Class A instruments. For these patients the new Class D instruments sounded “harsh” or “tinny” compared to the older technology.
The typical way of dealing with these objections was by employing our professional counseling skills. We explained that they were hearing high-pitched sounds that they had not heard for many years, and it takes time to get accustomed to the new sound quality. After a period of adjustment, they would be able to attain maximum benefit and satisfaction.
This approach worked for many patients, and we certainly need to include such counseling in every hearing instrument fitting. But other patients were never quite as satisfied with their new Class D hearing instruments as they were with their old Class A instruments—no matter how well we counseled or how patient our patients might have been.
Speech Intelligibility Research
A review of the literature on speech intelligibility reveals that the inconsistent subjective response to an extended bandwidth probably should not have surprised us. Researchers1-8 have examined the effect of varying the amount of energy in the high frequencies on speech intelligibility in patients with severe high-frequency hearing losses. The patients fall into three groups:
- Group 1: Speech intelligibility improves with increasing high-frequency energy.
- Group 2: Speech intelligibility does not change with increasing high-frequency energy.
- Group 3: Speech intelligibility worsens with increasing high-frequency energy.
Group 1 displays the result we would intuitively expect. Since the high frequencies contain information relevant to the signal of interest, as shown in the Articulation Index, we would expect the interpretation of that signal to improve as high-frequency energy is added.
The result in Group 2 would suggest that these subjects are not able to use the high-frequency energy as effectively as one might expect based on the Articulation Index.
Group 3, however, is of particular interest. At first glance it may seem illogical that removing energy that has important information content should improve performance. A possible explanation is that the presence of high-level, high-frequency energy in these ears may be producing aural distortion products that interfere with the clear perception of speech.
In addition to these observations on speech intelligibility, some patients report during routine audiometry that the quality of puretones changes at high frequencies and high levels. As signal frequency increases, they may say, “I hear something, but it doesn’t sound like a tone any more.” Instead it may sound like a buzz, click or hiss. This “tonal perversion” may also reflect a distortion product introduced by the ear itself when it is over-stimulated. (Author’s note: As a precaution, we should bear in mind that ears with normal low-frequency hearing and a sharply sloping, severe loss may be able to pick up changes in the noise floor of an audiometer or low-level distortion products in audiometric earphones. Research is under way to determine if byproducts of the audiometer may be responsible for some abnormal tonal percepts.)
What emerges from these observations on speech intelligibility and tonal perception is a picture of an impaired ear that produces distortion products when stimulated with high-level, high-frequency energy. And we might speculate that these same distortion products may be related to the occasional reports of poor sound quality from some patients who attempt to convert from Class A to Class D technology.
"Dead regions" in the Cochlea
An understanding of why some patients respond counter-intuitively to high-frequency sound energy may come from research on the pathophysiology underlying different degrees and types of hearing loss. Research over the past 15 years has shown that cochlear outer hair cells (OHCs) function as active amplifiers and frequency analyzers. OHC loss, therefore, results in elevated hearing thresholds and decreased frequency resolving power.9,10
Cochlear inner hair cells (IHC), on the other hand, have been shown to be the true sensory cells of the system, responsible for transducing acoustic energy into electrical energy and eliciting electrical responses in the fibers of the auditory nerve in response to sound.9,10 A loss of function in the IHCs means quite simply that the auditory nerve fibers in the region of the loss will not respond when stimulated.
Loss of OHC function yields an elevation of hearing thresholds up to about 50 dB HL in the lower frequencies and 65 dB HL in the higher frequencies. Thresholds beyond this range are indicative of at least partial IHC loss. A very severe or profound loss may be the result of total, or near-total, loss of IHC function.
Brian Moore and colleagues12,13 define a “dead region” as an area of the cochlea in which IHCs or auditory nerve fibers are not functioning. In either case, the region in question cannot elicit a neural response in the auditory system or a sensation of hearing in the listener.
How to Diagnose a Dead Region
Moore and his colleagues have developed a test to diagnose cochlear dead regions. The test, which is a straightforward extension of the routine pure-tone threshold test, requires measuring thresholds in the usual manner, then plotting them in dB SPL, instead of the usual dB HL.
Thresholds are then remeasured in the presence of a specially shaped, ipsilateral, broad-band noise, called threshold equalizing noise (TEN), which is calibrated in dB/equivalent rectangular bandwidth (dB/ERB). The “equivalent rectangular bandwidth” is similar in concept to a critical band. The theory is that a certain amount of energy in a critical band will produce the same masked threshold at all critical band center frequencies.
In both normal-hearing ears and ears with cochlear hearing loss due to OHC damage, the TEN produces equal thresholds in dB SPL across frequency, with the masked threshold in dB SPL equal to the masker level in dB/ERB. In an ear with a dead region, however, the masked threshold exceeds unmasked threshold and the expected masked threshold by at least 10 dB.
|
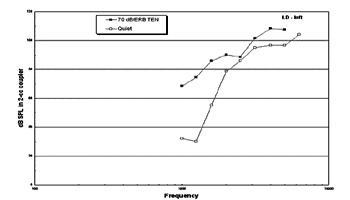
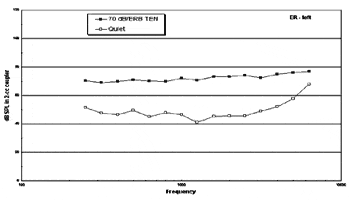
Figures 1a-b. Thresholds in dB SPL measured in quiet (open squares) and in the presence of TEN noise (closed squares). Part A shows results of a patient with no apparent dead regions; masked thresholds in the presence of a 70dB/ERB noise fall within 10 dB of the expected 70 dB SPL. Part B shows results suggesting dead regions from 1.5 to 2 kHz and from 4 to 5 kHz. At these frequencies the masked thresholds exceed unmasked thresholds and the masker level by at least 10 dB. |
Figure 1 illustrates results of the TEN test with two listeners. Subject ER in Figure 1a shows masked thresholds of 70 dB SPL across frequency from 250 Hz through 6000 Hz in the presence of a TEN masker at 70 dB/ERB. We conclude from these data that ER’s hearing loss appears to be due to OHC damage.
Conversely, Subject LD in Figure 1b shows masked thresholds that exceed unmasked thresholds and exceed the expected 70 dB SPL levels by at least 10 dB at frequencies of 1500, 2000, 4000 and 5000 Hz. These results indicate the likelihood of dead regions at these frequencies.
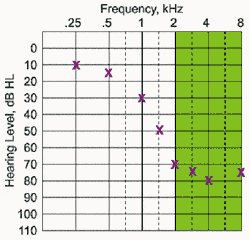
Viewing TEN test results on a standard audiogram illustrates the implications of this measurement in a more familiar format. The shaded area of the audiogram in Figure 2, for example, shows the frequency range over which the TEN test produced positive results—indicative of a dead region.
Not surprisingly, the dead region extends over the frequencies of greatest hearing loss. However, the correlation between hearing threshold level and a positive TEN test is not perfect; that is, the audiogram alone is not a perfect predictor of where we might encounter a dead region.
The result in Figure 2 suggests that this ear has no functioning IHCs in the cochlear region from 2-8 kHz. We might ask then why there are measurable thresholds at all in that frequency range. The explanation comes from Moore’s work with psychophysical tuning curves (PTCs)12,13. This laboratory technique uses a narrow-band masking paradigm to reveal what portion of the cochlea is responsible for a threshold response to any particular frequency.
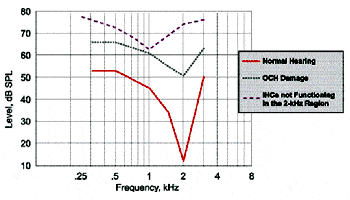
Figure 3, for example, shows PTCs for a 2 kHz tone from three ears. The first (solid line) has a normal PTC, with a deep, sharply tuned tip and low threshold. The fact that the tip of the PTC falls at 2 kHz indicates that the 2 kHz region of the cochlea is mediating the response to the 2 kHz tone.
The dotted line illustrates a PTC from an ear with OHC damage at 2 kHz. Once again the tip is at the same frequency as the tone, indicating that the 2 kHz region of the cochlea is responsible for the tonal threshold. However, the threshold is higher than that in the normal ear, and the tuning, or frequency resolving power, reflected in the narrowness of the tuning curve, is not as sharp.
Finally, the dashed line in Figure 3 shows a PTC from an ear with nonfunctioning IHCs in the 2 kHz region. Not only does the PTC display broad tuning and an elevated threshold, but also the tip falls at a frequency of 1.5 kHz, instead of the expected 2 kHz. The fact that a masker centered at 1.5 kHz is most effective in masking a 2 kHz tone indicates that the 1.5 kHz region of the cochlea is mediating the response to the that tone. Moore et al.12 conclude that the 2 kHz region is dead and the threshold at that frequency arises from stimulation of sensory cells in the 1.5 kHz region.
Moore and others call the phenomenon illustrated in the last PTC of Figure 3 “off-frequency listening.” I prefer the term “off-peak” or “off-place” listening because the ear is not responding to a different signal frequency, but rather to the same frequency via sensory cells and nerve fibers remote from the peak of excitation produced by that frequency. The term reflects the fact that even a signal with all of its energy at one frequency elicits a broad area of excitation along the basilar membrane, and if the excitation level is high enough and the area broad enough, cells remote from the peak are recruited into the response.
While its clinical viability still depends on validation by other researchers, Moore’s TEN test may represent a quantum leap in our ability to diagnose and understand the nature of hearing loss. It may add to our current knowledge of degree of hearing loss some additional information about the nature of the hearing loss. Furthermore, the TEN test also carries important implications for fitting hearing instruments.
Implications of Dead Regions for Amplification
Two possible results of severe high-frequency hearing loss have been described. The first is that some ears appear to produce an audible distortion of high-level, high-frequency signals. The second is that some portions of the cochlea cannot respond at all, even though the audiogram may show measurable thresholds.
While we do not have a complete understanding of the mechanisms underlying these two observations, it appears likely that they are related. High-level, high-frequency signals appear to elicit off-peak responses and simultaneously create distortion products by overdriving a broad segment of the cochlear partition.
With regard to hearing aid fitting, the message is clear: high gain and a broad bandwidth in some ears may do more harm than good relative to intelligibility. This rule-of-thumb is not new; indeed, some hearing professionals for years have trimmed back the high frequencies when faced with a severe high-frequency loss.
The research on hair cell function and dead regions provides us with potential scientific explanations for this principal and adds to our understanding of why this rule is important. Previously the highs have been reduced with the idea that they can’t provide any benefit. The new implication is that not only can they not provide benefit, but they may actually be detrimental to the goals of good sound quality and speech intelligibility.
Improved understanding of these issues prompted the development of an approach designed to allow precise adjustment of the high-frequency response for ears that can use high frequency energy well and for those that cannot.
High-Frequency Management
Starting with the observation that high gain at high frequencies may not yield the best results for all hearing losses, Micro-Tech has developed an approach called “High-Frequency Management.” The basic goal is to provide a fitting tool to maximize high-frequency gain for ears that can make use of it, and at the same time manage high-frequency gain for ears that show an adverse reaction.
A new response parameter, called the Resonance Booster (RB), allows a stepwise, systematic shifting of the Class D response peak, with a rapid fall-off in the frequencies above the peak. The RB control provides a way to depart from the customary Class D response shape, in which peak frequency (in the 2.7-2.9 kHz range) is more or less a “slave” to the receiver characteristics.
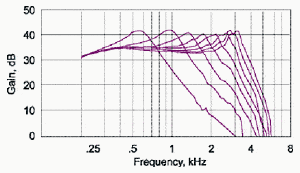
Figure 4 illustrates the effect of adjusting the Resonance Booster control in a 2cc coupler. These frequency responses are from a Micro-Tech Dx3 digital hearing instrument (RB is also employed in the Nx2 and NxN hearing instruments). The peak frequency can be adjusted from 3200 Hz down to 600 Hz. As the peak frequency is reduced, small slices are removed from the high-frequency response. The discrete step-wise changes achieved with the RB are more precise than those achieved by reducing gain in an entire high-frequency band of a multi-band instrument.
The basic goal of the RB is to place the primary gain peak in the frequency range where it provides the greatest patient benefit and avoid excess gain in frequency ranges where it does not provide benefit. As the peak is shifted up and down, narrow slices of the high-frequency response are systematically removed or added.
For ears that can make good use of high-frequency energy, the peak is preserved at a high frequency. However, for ears in which dead regions cause further degradation of sound quality when stimulated with high frequencies, the RB is designed to offer a way to shift the “offending” amplification peak out of that region quickly and easily. The systematic slicing of the high-frequency response provides a tool for maximizing the response over the range of frequencies that the ear can use, while at the same time avoiding amplification that spills over into a region that may cause problems.
Using the System in High-Frequency Management
A paired comparison procedure offers an easy and effective way to determine the optimal setting of the Resonance Booster. The patient is asked to judge the clarity of speech as the fitter adjusts the Resonance Booster to different frequencies. The procedure tends to place patients into one of three groups:
1) Some patients prefer the RB at the highest frequency, indicating that the patient is able to make use of the highest frequencies that the instrument can amplify. In this case, set the RB to its maximum to take full advantage of the patient’s impaired but functional auditory system.
2) A second group of patients prefers the RB at a lower frequency. These patients are not able to make good use of speech energy in the highest frequency ranges, perhaps because of a cochlear dead region. The paired comparison reveals better sound quality when the RB is shifted downward. For these patients, reduce the RB in a stepwise fashion until they report the best clarity.
3) A third group of patients will have difficulty making a clear judgment about which RB setting is best. It is recommended in these cases that you set the RB to the highest value, in hopes that the patient will be able to take advantage of high-frequency cues after some practice, even if the differences are not clearly discernible right away. It is also recommended that you retest these patients on a return visit, after they have had more time to become accustomed to their new hearing instruments.
Anecdotal experience suggests that, in the two-and-a-half years that the Resonance Booster has been available, several patients who have never been happy with hearing aids are now satisfied due to this approach. Presently research is under way to evaluate patients with the TEN test and relate the results to the RB settings that give best speech intelligibility and perceived sound quality.
Remaining Issues
The dead regions research is new, and the implications of this work are not yet fully understood. Many questions have arisen that do not yet have answers.
n What proportion of the patients we see day to day in the office have dead cochlear regions?
n Are these cochlear regions really dead, or are they impaired to a point of functioning very differently from other regions?
n How is the observed susceptibility to the effects of masking related to sensory deprivation in severely impaired cochlear regions?
n Would sensory stimulation with hearing instruments promote a regaining of functionality in these regions? If so, then perhaps an ear could be weaned from a preference for a narrower band toward greater acceptance of a broader band.
n What is the ideal setting of a hearing aid response peak and high-frequency cut-off relative to the boundary of a dead region? Is any benefit derived from amplifying into the region of dead sensory cells?
These and other related issues will be addressed in coming months as ongoing research continues to enlighten us about the use and implications of this new approach.
Summary
A common rule-of-thumb for fitting high-frequency sloping hearing losses has been to maximize gain in the high frequencies and cut the lows to avoid amplifying in a range of normal or near-normal hearing. Yet many hearing instrument professionals have known for years that, while some patients benefit from this approach, others report harsh sound quality when high frequencies are maximized.
Recent research has shed light on the workings of the impaired ear and the distinctly different reactions of different patient groups to high-frequency emphasis. Some experience improved speech intelligibility with maximum high-frequency energy, while others perform better with a narrower bandwidth.
Moore’s work on dead regions has given us a better understanding of the impaired ear and also a tool for diagnosing the nature of the disorder in the inner ear. Yet, his TEN test requires further validation, both theoretical and clinical, before it can be put into service on a regular basis.
We anticipate a good deal of research in the near future addressing issues related to the interpretation and use of the dead regions diagnostic approach. As more is learned, skills in diagnosing sensory hearing loss and at offering the best rehabilitation of those losses will continue to improve.
The Resonance Booster is designed to provide two functions. First, it carries some diagnostic implications: the evaluation of speech intelligibility and clarity at various RB settings provides clues to whether a portion of cochlear is unable to make use of sound energy. Second, it offers a rehabilitative tool: the ability to adjust the hearing instrument response peak precisely over a wide range allows the optimization of the response for a wide variety of patients, taking full advantage of cochlear regions that can benefit from amplification, while not allowing amplification to spill over into regions where it may cause more harm than good.
Acknowledgments
The author thanks Mary MacRae and Maggie Rendano for their insights and assistance in preparing this article. Thanks also to Martin Rickert from the Advanced Research Group at Starkey Labs for the sample TEN test results shown in Figure 1.
This article was submitted to HR by Jerry L. Yanz, PhD, vice president of education and training for Micro-Tech Hearing Instruments, Plymouth, Minn. Correspondence can be addressed to HR or Jerry Yanz, PhD, Micro-Tech Hearing Instruments, 3500 Holly Lane North, Ste 10, Plymouth, MN 55447; email: [email protected].
References
1. Rankovic CM. An application of the articulation index to hearing aid fitting. J Speech Hear Res. 1991;34:391-402.
2. Ching T, Dillon H, Byrne D. Speech recognition of hearing-impaired listeners: Predictions from audibility and the limited role of high-frequency amplification. J Acoust Soc Am. 1998;103:1128-1140.
3. Hogan CA, Turner CW. High-frequency audibility: Benefits for hearing-impaired listeners. J Acoust Soc Am. 1998;104:432-441.
4. Turner CW, Cummings KJ. Speech audibility for listeners with high-frequency hearing loss. Am J Audiol. 1998;8:47-56.
5. Turner CW. The limits of high-frequency amplification. Hearing Journal. 1999;52: 10-14.
6. Moore BCJ. A test for the diagnosis of dead regions in the cochlea. February 2000; Minneapolis.
7. Murray N, Byrne D. Performance of hearing-impaired and normal hearing listeners with various high-frequency cut-offs in hearing aids. Aust J Audiol. 1986;8:21-28.
8. Skinner MW. Speech intelligibility in noise-induced hearing loss: effects of high-frequency compensation. J Acoust Soc Am. 1980;67:306-317.
9. Ruggero MA. Responses to sound of the basilar membrane of the mammalian cochlea. Curr Opin Neurlbiol. 1992;2:449-456.
10. Yates GK. Cochlear structure and function. In: Moore BCJ, ed. Hearing. San Diego: Academic Press; 1995:41-73.
11. Moore BCJ. Cochlear Hearing Loss. London: Whurr; 1998.
12. Moore BCJ, Glasberg BR. A model of loudness perception applied to cochlear hearing loss. Auditory Neurosci. 1997;3: 289-311.
13. Moore BCJ. Dead regions in the cochlea: Diagnosis, perceptual consequences, and implications for the fitting of hearing aids. Trends in Amplification. 2001;5:1-34.


