Hearing instrument returns are an unpleasant aspect for hearing care professionals, patients and hearing instrument manufacturers. For a dispensing professional, time spent dealing with a return diverts attention from other patients and the potential income they bring. While some of the testing and counseling may apply to future visits by the patient, the process of device returns remains unpleasant and cumbersome.
Hearing instrument manufacturers are required to, and do, accept devices for return during and after the patient’s adjustment/trial period. Clearly, it takes time and resources for manufacturers to replace hearing instrument components, and these costs are eventually reflected in the higher initial cost of all hearing instruments. In most cases, the dispenser may return the device to the manufacturer at no charge, although there is often a charge to the patient for nonrefundable testing and fitting services. Many facilities mandate a restocking fee, lab fee, or service charge for returned devices to offset the costs involved in these activities.
Hearing instrument returns are also unpleasant for patients, who lose out by not benefiting from amplification during the return and reselection process. The time spent in setting up appointments, waiting for the new aids to arrive, and then being refitted can erode satisfaction and confidence with the product and the dispensing professional.
Patients may return hearing instruments for numerous reasons, including cosmetics, financial circumstances, poor fit, sound quality, and perceived benefit. By studying the specific reasons that patients return hearing instruments, strategies to help minimize the number of returns may be generated. Decreasing hearing instrument returns is financially beneficial to the dispenser and client alike, and developing strategies for return reduction will lead to more appropriate fittings—which will likely improve the patient’s quality of life.

Northern and Beyer1 reported that about 20% of all hearing instruments are returned by patients each year. Bloom2 reported that approximately 100,000 people (16%) returned hearing instruments annually, and Strom3 reported that the national return rate for all hearing instruments has been between 17.5 and 18.5% since 1994.
Alberti and Brown4 indicated that the following factors contributed to hearing aid returns: poor benefit, high level of device noise, poor patient ability to manipulate the device, and device cost. These authors opine that some hearing instrument users in their study had unrealistic expectations and may have been influenced by pre-existing personal prejudices against amplification. Brooks5 reported that patient attitude is a determining factor to a patient’s success with amplification. Smedley and Schow6 reported that patients were dissatisfied with the physical fit, mechanical problems, low benefit, cost, and effects of competing background noise.
Madell et al7 analyzed hearing instrument returns on a per-unit basis in a large-volume dispensary. These authors looked at returns across a broad spectrum of device and patient descriptors which included: device style and circuit, client age, word recognition scores, counseling services received, hearing aid history, client’s stated reason for rejection, specifics about the trial period, and employment status. They reported that poor benefit was the most common reason cited by clients who returned devices. In the study, experienced users rejected hearing instruments less than new users, perhaps because “experienced users were already convinced of the need for amplification.”7 Additionally, more than one quarter (27.1%) of the hearing instruments used by patients with mild hearing losses were rejected, possibly because these patients did not realize sufficient benefit to warrant the device cost.
Bloom2 suggested that dispensers might minimize returns by taking advantage of the often-underused technical support offered by manufacturers. Most manufacturers have audiologists and other technicians on staff who are available for telephone consultation regarding appropriate styles, circuit selection, etc. Dispensing professionals can also attend workshops and training sessions offered by the hearing aid manufacturers.
Alberti and Brown9 and Gerber and Fisher10 reported that increased patient satisfaction was correlated to number of hours of device use per day. That is, the more time patients devote to wearing the aids, the more likely they will receive and perceive benefit. These authors suggested that hearing care professionals should be cognizant of the psychological and social aspects of amplification when recommending and fitting hearing instruments. Alberti & Brown further contended that the general public and family physicians need to be better informed about hearing instruments and encourage the use of amplification.
Rose and Pool8 surveyed 54 audiologists and reported that most believe the key factor in successful hearing instrument dispensing was “counseling patients toward realistic expectations.” Factors such as frequency response, proper earmold, proper circuitry and cost were also found to influence the success of the fitting.
Madell et al.7 suggested that counseling is paramount and encouraged the use of hearing aid orientation groups that familiarize new users with their devices and guide them toward more realistic expectations. Northern & Beyer1 supported the benefits of aural rehabilitation and reported that only 1% of patients who attended aural rehabilitation courses returned their hearing instruments as compared to a 9% return rate for the patients who did not attend the courses.
Kochkin11 reported a positive correlation between time spent on patient education and reduced return rates. He estimated that, independent of the technology used in the fitting, dispensing professionals who spend 2 or more hours on counseling achieve customer satisfaction rates of about 70%, compared to 15% for those professionals who offer little or no counseling. In a study involving 31 dispensing sites and 289 subjects, Kochkin found that a guided consumer education reading program reduced return rates by 46%.
Madell et al7 reported that patients in the 52-70 year-old age group returned hearing instruments less frequently than older patients. The authors opine that younger people have an easier time adapting to amplification than older people and suggest that, when appropriate, hearing care professionals should recommend hearing instruments to clients at a younger age. This finding is in agreement with Alberti12, who reported that, if patients receive a hearing instrument when they are “mentally young,” they are more likely to carry the skills for use into old age.
The three most common reasons for rejection of hearing instruments in the Madell et al7 study were insufficient benefit, physical discomfort, and difficulty hearing in the presence of background noise. These authors suggest that dispensing professionals should be cognizant of these factors when counseling and that the benefits of amplification need to be demonstrated to the patient “in or outside the test room.”
Procedures
The present study expands on the 1991 research conducted by Madell et al.7 Hearing instruments were dispensed to 188 men (43.6%) and 243 women (56.4%) in a hospital hearing aid dispensing practice. The returns were reviewed on a per-patient basis over a period of 1 year. Returns were analyzed with regard to patient gender, age, employment status, insurance coverage, circuitry, instrument style, degree of hearing loss, user history, and specific reason for return.
In this study, patients and audiologists cited 16 reasons for the return of the hearing instruments (Figure 1, page 24). The top-four reasons for returns were poor or insufficient benefit (9 patients returning aids), cosmetics (4), financial/cost concerns (3), and administrative returns (3). While most of the categories used in the study are self-explanatory, the following provides details on categories that readers may question:
“Insufficient benefit” indicates that the patient felt that the performance of the device did not meet their expectations or adequately ameliorate their communication difficulties.
“Unrealistic expectations” was a category cited by audiologists in the study. The authors believe that, even after counseling patients toward realistic expectations (ie citing patients’ word recognition potential and explaining that a device would help communication but not restore normal hearing), some patients still wanted to get more from amplification than was realistically possible.
The “medical status change” category refers to patients who had fluctuating conductive hearing losses and/or a history of otologic surgery. In these cases, some event (eg, surgery, illness, aural drainage, improvement in hearing) took place during the time period between the device order and scheduled instrument fitting. These devices were never dispensed to the patient, but do count as returns because they were returned to the manufacturer.
The “administrative return” category refers to two instances when an administrative miscommunication caused a device to be “double ordered” and the devices were returned to the manufacturer.
The “inappropriate selection” category refers to inappropriate style selection by patients. For example, some patients insist on CIC devices, despite their limited ability manipulate the device and batteries.
The “patient lost to follow up” category refers to situations in which a device was ordered for a patient who, despite repeated phone calls and letters, could not be rescheduled for a fitting after missing their initial appointment. These devices, although they were never dispensed, count as returns since they were returned to the manufacturer.
A “defective device” was provided to one patient (his hearing instrument was repaired several times in 1 year due to circuit malfunction). The device was ultimately returned to the manufacturer and a refund was obtained.
Statistical Analysis
A univariate analysis was performed using contingency tables and two-by-two tables. Contingency tables were used when at least one of the variables had more than three possible values. The log-likelihood ratio was used as a measure of association, because it is applicable even when sample sizes are too small to employ the Chi-square test (eg, when expected values in some cells are < 5). Two-by-two tables were used when both variables were dichotomous. Fisher’s exact test and the odds ratio were used as measures of association; 95% confidence intervals for the odds ratio were determined using Cornfield’s method.
Multivariate analysis of factors influencing hearing instrument returns was performed using unconditional multiple logistic regression, including all variables with p<0.15 on the univariate analysis. Dummy variables were created for categorical variables with more than two levels. Predictor variables were checked for multicollinearity by ensuring that all coefficients in the correlation matrix were less than 0.90.
For all statistical tests, an association was considered significant if the two-tailed p-value was less than 0.05.
Results
During a period of 1 year, 431 patients were fit with hearing instrument(s). Thirty-seven patients (8.6%) brought back their instruments for return to the manufacturer; returns came from 34 males (58.6% of all returns) and from 24 women (41.4%)(Table 1c, page 25)
Patients and audiologists cited 16 specific reasons for device returns. The top four reasons for device returns were insufficient benefit (24.3%), cosmetics (10.8%), financial (8.1%) and administrative (8.1%) (Figure 1, page 24).
There were no significant associations between hearing instrument returns and patient age (p=0.329), employment status (p=0.533), gender (p=0.387), hearing loss severity (p=0.427), or user history (p=0.608) (Tables 1a-c, g, h, page 25).
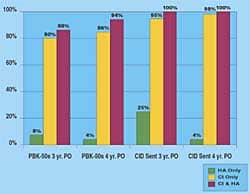
There was a significant association between insurance status and returns (p= <0.001). Patients are more likely to be critical of their hearing instruments if they self-pay (20.2% return rate) than if all or part of the cost is covered by insurance (3.4% return rate) (Figure 2, page 25).
There was a significant association between the hearing instrument circuit type and returns (p=0.007) (Figure 3). The data reflect that patients are more likely to return their hearing instrument if the circuit is digital than analog (57.1% vs between 9.1%-16.7%). The sample numbers for digital instruments, however, are small (Table 1e, page 25).
There was a significant association between style and return (p=<.001) (Table 1f, page 25). CIC’s were more likely to be returned (40%) when compared to all other styles combined (6.7%) (Figure 4).
Statistical analyses were performed using software.13 Analysis summary and comments:
• The model chi-square provides the probability = <.001 that chance alone accounted for the observed relationship between these predictor variables and the outcome variable (eg, the model is “significant”).
• Significant predictor variables for device returns were self-pay vs insured, CIC style vs. others, and digital circuit vs standard. Logically, it stands to reason that individuals who pay for their amplification will expect more than those who obtain hearing instruments via an insurance program, which covers part or all of the cost. CIC devices may have had a higher return rate than all other styles as they are more costly and more difficult to manipulate than other styles. In other words, the “hassle factor” may have come into play. Digital devices are significantly more costly than devices utilizing less sophisticated technology. The higher cost of these devices may have led to higher user expectations and as a result, a higher return rate if the expectations were not met.
• The model accounts for 16.6% of the variation among hearing aid returns; this indicates that there are probably many other factors that are not accounted for. Looking at user word recognition ability, individual audiologists’ level of proficiency with specific technologies, counseling received, and evaluation of patient self-assessment instruments (COSI, APHAB).
• The goodness of fit Chi-square is not significant; the large p-value indicates that the logistic model is appropriate for these data.
• The correlation matrix of the estimates (not shown here) confirms that none of the predictor variables are highly correlated with each other (maximum correlation was R=0.34); this provides reassurance that problems with multicollinearity have been avoided
The odds ratio give the increased likelihood of hearing instrument return for the risk factor vs baseline value. For example, a self-pay person is 4.79 times more likely to return an aid than an insured individual. We can be 95% confident that the true likelihood of return is somewhere between 2.07% and 11%.
Discussion
Hearing instrument returns can be a critical factor in clinical practice. In this study, 8.6% of patients returned their hearing instruments.
Several predictive factors for hearing instrument returns exist. For example, self-pay patients are 4.8 times more likely to return aids than those paying out-of-pocket expenses for the devices (Figure 2, page 25), and patients are 3.5 times more likely to return CIC aids as compared to all other styles combined (Figure 3). Based on the multivariate analysis these appear to be independent predictive factors.
Digital instruments also have a higher return rate (Figure 4, page 28), but the small numbers of patients using digital instruments in this study preclude a definitive statement. The authors speculate that higher return rates for these devices are related to price. It may be that the benefit obtained from the more expensive hearing instrument was not perceived to be worth the additional expense. It may also indicate that analog circuits meet the needs of many of our clients.
CIC hearing instruments were the most likely style to be returned. This may indicate that CICs are more problematic for some patients to use. We also observed that body aids were returned infrequently (only 11.1% of the time). This is probably not surprising since those aids are usually fit as the hearing aids of last resort.
In contrast, there were no relationships between return rates and age, gender, employment status, degree of hearing loss, or prior hearing aid experience. As would be expected, patients who paid for their own hearing instruments were more likely to return them than those who have full or partial insurance coverage for hearing aids. The generalizability of these results to other populations depends on how comparable our patients are (socioeconomic status, education) to other patients who typically receive hearing instruments.
The authors believe that a larger study—perhaps combining data from different centers on a more heterogeneous group—would reveal further information on reasons for hearing instrument returns and contribute to the field’s understanding of how to reduce returns. Future studies may also look at the relationships between returns and patients’ hearing aid benefit self-report tools (COSI, APHAB).
|
John Weigand, AuD, is senior audiologist and clinical instructor at SUNY Downstate University in Brooklyn, NY; Kenneth Bodkin, AuD, is clinical coordinator at Hackensack Medical Center in Hackensack, NJ; Jane R. Madell, PhD, is director of the Hearing and Learning Center at Beth Israel Medical Center in New York City; Richard M. Rosenfeld, MD, (not pictured) is a professor and director of the Division of Pediatric Otolaryngology at SUNY Downstate Medical Center and at Long Island College Hospital in Brooklyn, NY; and Ivy L. Press, MS, is the supervising audiologist at Staten Island Audiological Services in Staten Island, NY. |
Correspondence can be addressed to HR or John Weigand, AuD, SUNY Downstate Medical Center, 450 Clarkson Ave, Brooklyn, NY 11203.
References
1. Northern JL, Beyer CM. Reducing hearing aid returns through patient education. Audiology Today. 1999;11:2.
2. Bloom S. The high cost of “free” hearing aid returns, and strategies for reducing the return rate. Hear Jour. 1995;48(1): 13-19.
3. Strom KE. The 1998 hearing instrument market and what’s ahead in ’99. Hearing Review. 1999;6 (3):8-19.
4. Alberti PW, Brown T. The effectiveness of a hearing aid delivery system. J Otolaryng. 1980; 9(3):266-270.
5. Brooks DN. The effect of attitude on benefit obtained from hearing aids. Brit Jour Audiol. 1989;23:3-11.
6. Smedley TC, Schow RL. Frustrations with hearing aid use: candid observations from the elderly. Hear Jour. 1990;43(6):21-27.
7. Madell JR, Pfeffer EB, Ross M, Chellappa M. Hearing aid returns at a community hearing and speech agency. Hear Jour. 1991;44,18-23.
8. Rose DE, Pool AP. In search of an effective means to reduce hearing aid returns. Hear Jour. 1994;8:29-31.
9. Gerber SE, Fisher LB. Prediction of hearing aid users satisfaction. J Amer Aud Soc. 1979;5:35-40.
10. Kochkin S. Reducing hearing instrument returns with consumer education. Hearing Review. 1999;6:18-20.
11. Alberti PW. Hearing aids and aural rehabilitation in a geriatric population. J Otolaryng. 1977;6(Suppl 4).
12. Gustafson TL. Reference Manual. 5th edition. Richardson, Tex: Epistat Services; 1994.