Research | September 2019 Hearing Review
Is inserting the probe tube through an earmold vent effective? This study suggests it is.
Effects of inserting the probe tube through various sized vents, as well as under the earmold, during real-ear probe mic testing were examined in this study. Results seem to support the practice of inserting the probe tube through the vents of earmolds for a “truer” low-frequency measure. This seemed to be the case regardless of the diameter of the vent. All conditions with the probe tube under the earmold seemed to show a “slit leak” effect on the low-frequency output measures that was larger than any effect shown by the probe tube being placed through the vent.
Using probe tube microphone instrumentation to validate hearing aid fittings is now considered to be a critical part of “Best Practices” by the American Academy of Audiology.1 The most accepted method involves placing a small flexible tube in the ear canal with the hearing aid in place and functioning. The medial end of the tube is within 5 mm of the eardrum and the lateral end is attached to a microphone assembly on the patient’s ear. This arrangement provides a graphic display of the amplification characteristics of the hearing aid.
The placement of the tube in the canal precedes placement of the earmold and results in the tube lying between the ear canal and the earmold. Factors regarding the depth of insertion have been thoroughly studied and recommendations have been made.2
On occasion, however, the earmold is so tight that the tube is flattened and will not function. To remedy this situation, a variety of suggestions have been made regarding the use of the vent as a passageway for the probe tube. One publication3 and one manufacturer’s user’s guide (Audioscan Verifit User’s Guide 3.18, May 2017)4 suggest that it is permissible to use the vent in that fashion if the tester is concerned that the tight-fitting earmold may crimp the probe tube against the ear canal, but mentions no other physical characteristics of the vent. Mueller5 suggests that the vent may be used if it has a diameter of at least 2 mm. Dillon6 suggests that the vent may be used if it has a diameter that is more than 50% larger than the diameter of the probe tube.And yet two publications for practitioners have differing opinions in that one states that the vent may be used for this purpose, particularly if the vent is “large,”7 while the other publication unequivocally states: “do not insert probe through the vent.” 8 The latter publication goes on to explain that the “size of the ventilation is important to preserve during measurement, especially if the vent is on the smaller side.” 8
Our study examines the effects of using the vent as a passageway for the probe tube during real-ear probe microphone measurement.
Part 1 Study Methods
Two adult subjects, a male and a female, between the ages of 21-30 years were recruited for this study. Each received an otoscopic exam and a tympanometry test. The exam and the test were conducted to ensure that the subjects’ tympanic membranes and middle ears were disease free.
The participants then had silicone impressions made for each ear, which subsequently were used to create four lucite, full-shell earmolds for each of the four ears, resulting in a total of 16 earmolds. Each pair of earmolds were made to contain parallel vents of the same length, but of four different diameter sizes (small = 1.2 mm, medium = 1.6 mm, large = 2.1 mm, extra large = 2.5 mm). Each earmold had size 13 regular-wall tubing inserted through its sound channel in order to be connected to the test BTE (Starkey Muse iQ i1600). The BTE was programmed to generate a relatively flat wide-band tinnitus masker with an RMS value of 80–82 dB SPL (Figure 1). The same hearing aid generating the same masker was used throughout the study.
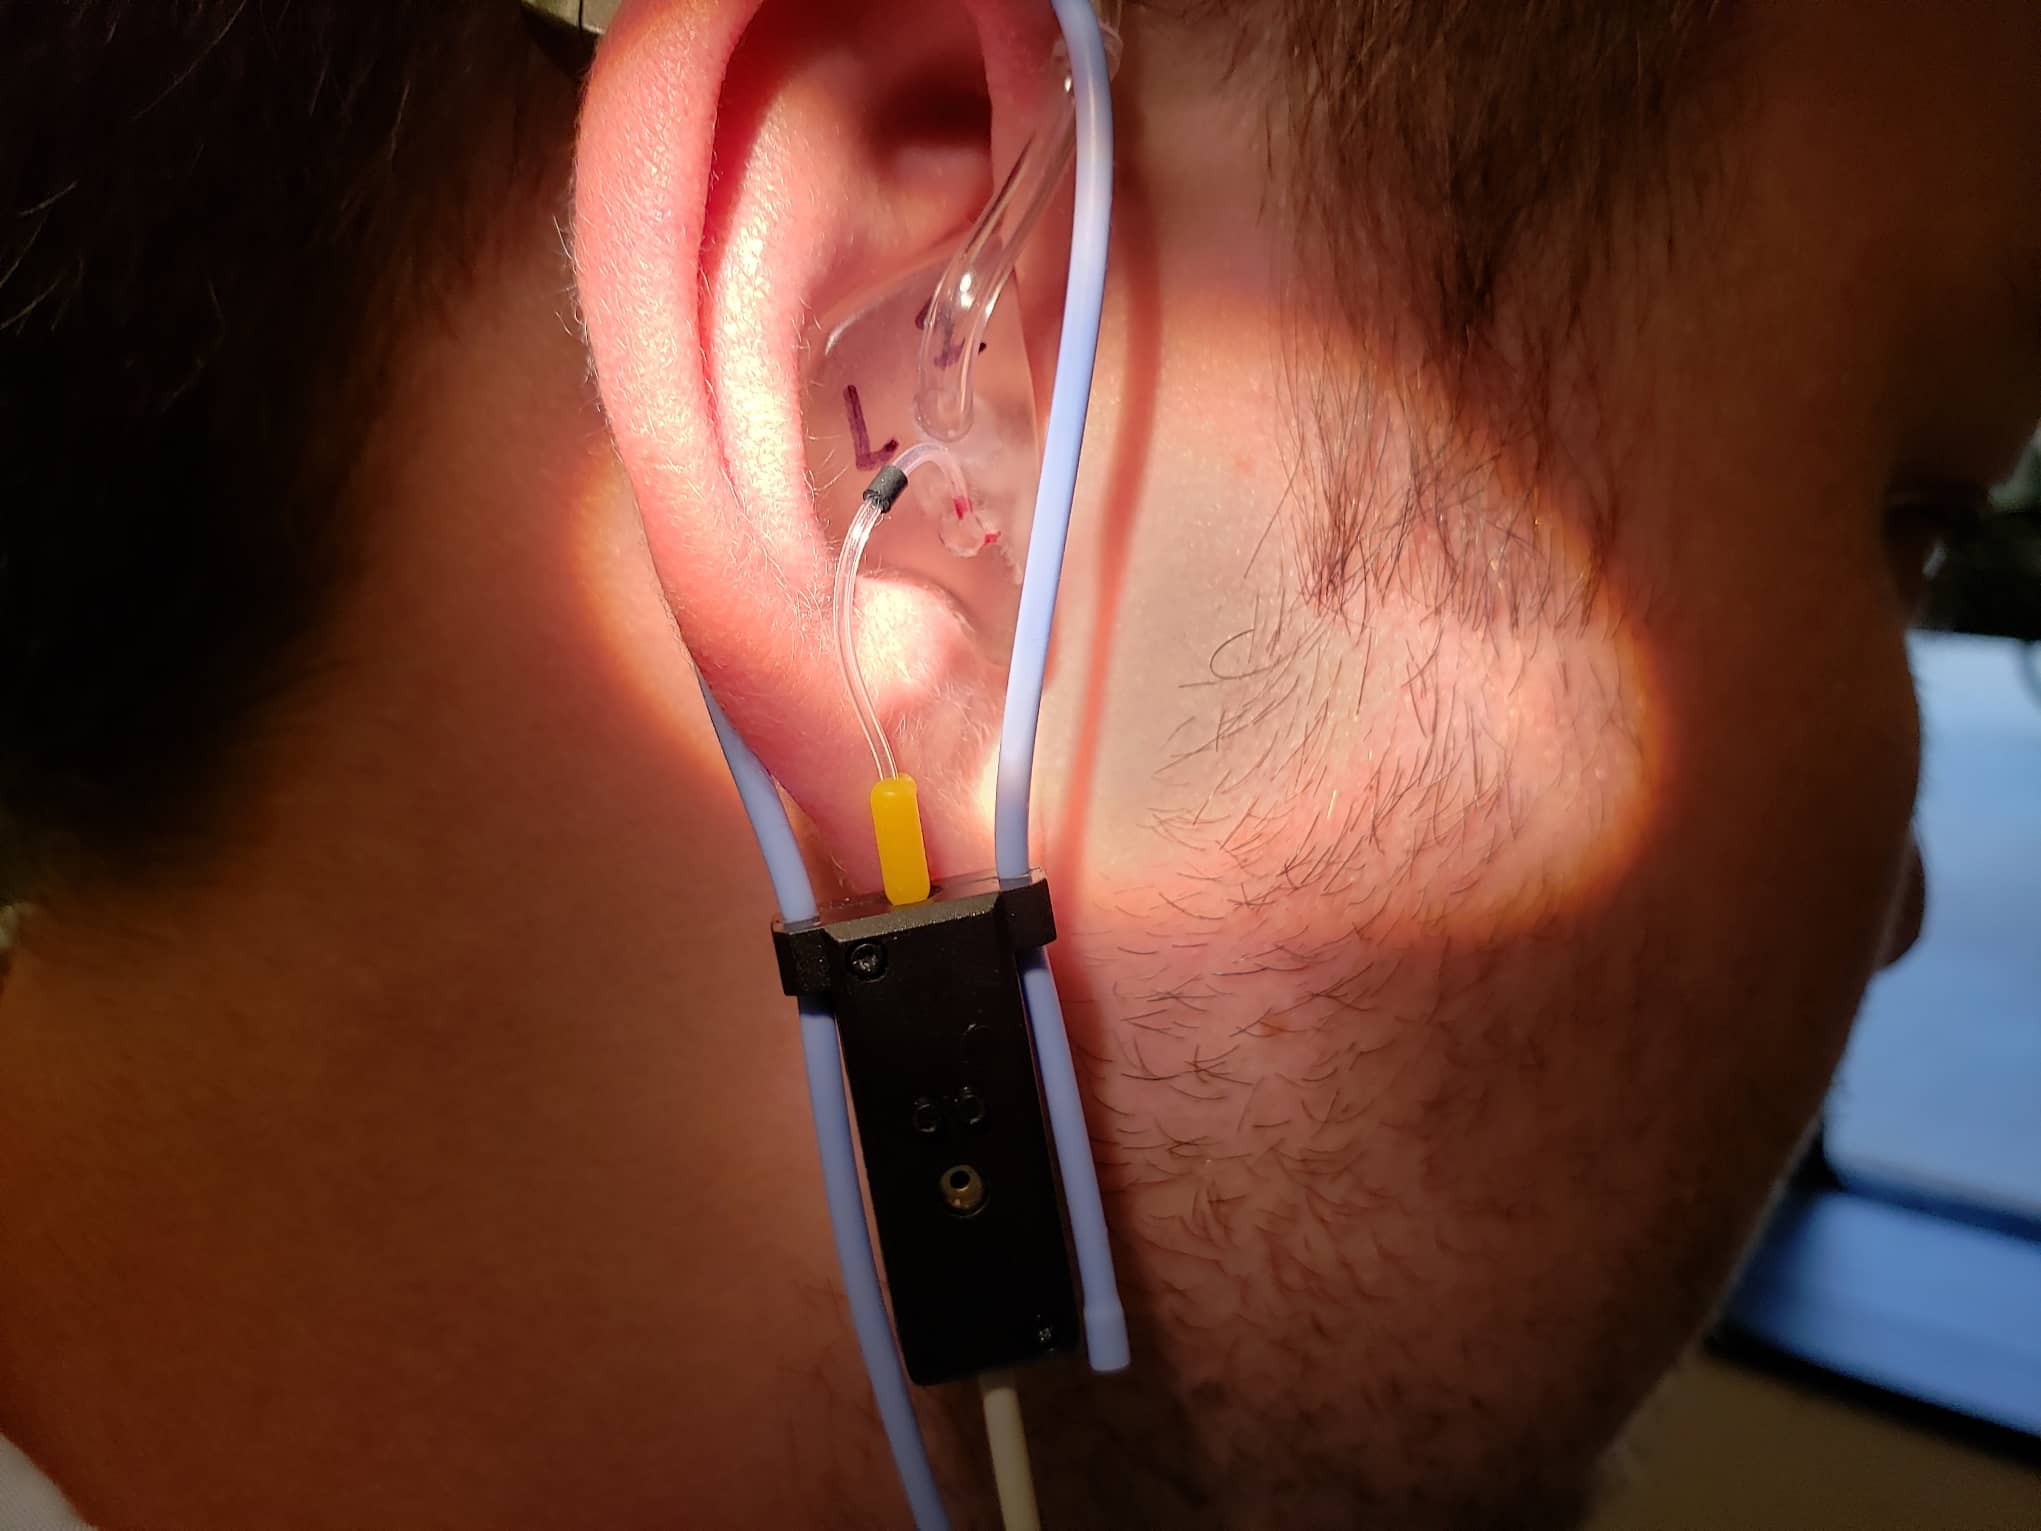
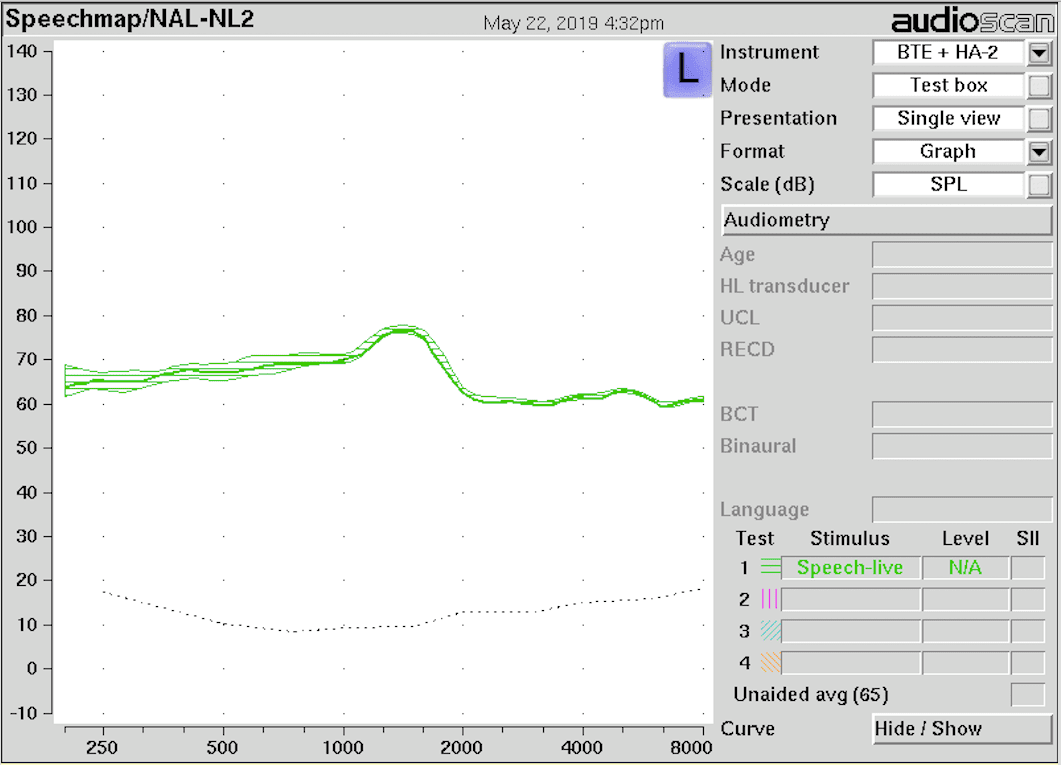
Figure 1. Top: Experiment setup with probe tube inserted through the vent of the BTE. Bottom: The BTE was programmed to generate a relatively flat wide-band tinnitus masker with an RMS value of 80-82 dB SPL.
The participants were tested for all conditions in a sound suite suitable for pure-tone threshold testing. The participants were asked to sit quietly and not move significantly while the testing was being conducted. They wore each of the four pairs of his/her custom-made earmolds, one pair at a time, while attached to the BTE, and while being tested with the Audioscan Verifit.
The protocol was identical for each of the two since this type of testing is not subject to an order effect and does not require randomization. Each of the three conditions (ie, vent closed with probe tube under the earmold, vent open with probe tube under the earmold, and vent open with probe tube inserted through the vent) were tested with the earmold staying in place in the subject’s ear. The probe tubes were measured for proper insertion length using the subjects’ earmolds and were marked with red ink. They were also marked so that, when inserted, the medial ends of the tubes were 3-4 mm beyond the sound bore opening of the earmolds to avoid the “near field” effects and within 4-5 mm of the eardrum. Commercial silicone vent plugs were used to close all of the vents during the “vent-closed” condition. The vent plugs were carefully removed for the “vent-open” condition; and for the “probe-tube-through- vent” condition, the probe tube was inserted directly into the vent until reaching the pre-marked position.
Testing was done using an Audioscan Verifit unit. This unit displays the output of an acoustic signal in dB SPL and the frequency in hertz in both graphical and tabular form. In this study, the signal in question was the wide-band tinnitus masker being delivered into the canal of the subjects. The signal was delivered to the ear-level microphone via the probe tube that was either in the canal under the earmold or inserted through the vent in the mold. Both the graphical display and the table of the output values were saved for examination. The frequencies of interest in this study are 250-500 Hz.
Part 1 Study Results & Discussion
The results of the study are shown in graphical form (Figures 2-5) with Condition #1 (closed-vent) in blue, Condition #2 (open-vent) in orange, and Condition #3 (probe-tube-through-vent) in gray. As expected, the largest differences in the curves are in the 250-500 Hz range. Also, as expected, the “vent-open” condition displays the least amount of output (largest amount of low-frequency leakage) in the 250-500 Hz range for all vent diameters.
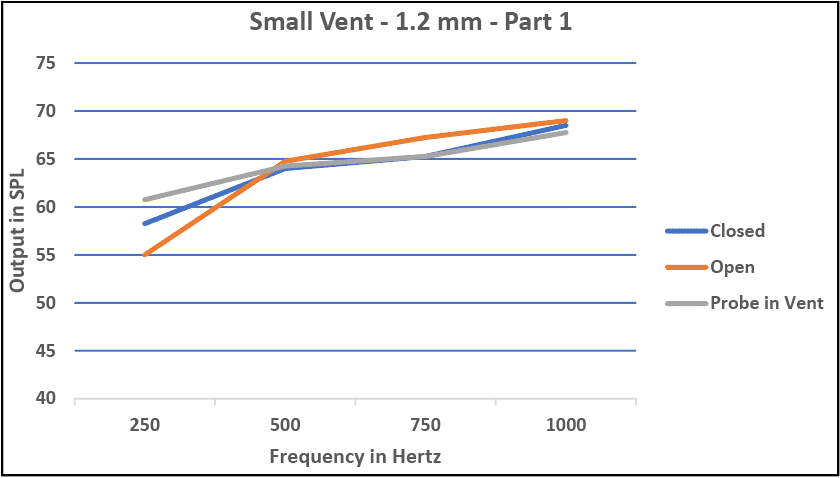
Figure 2. Real-ear measurements of the small (1.2 mm) diameter size vent for the three conditions.

Figure 3. Real-ear measurements of the medium (1.6 mm) diameter size vent for the three conditions.
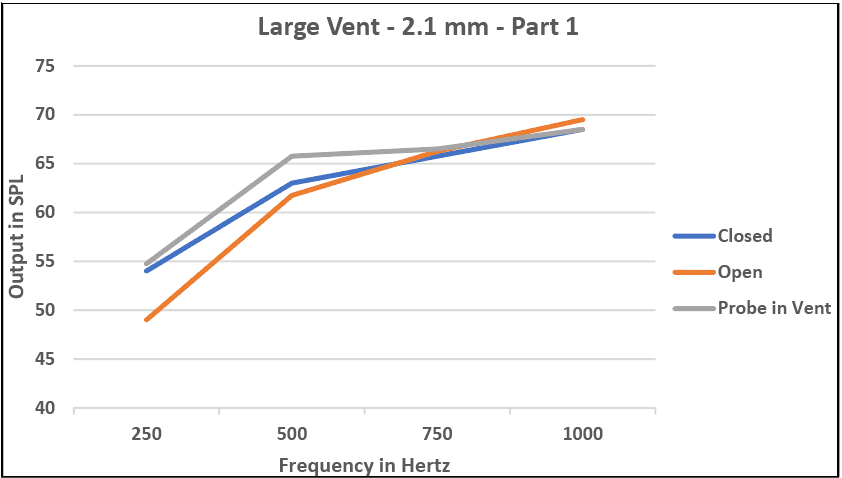
Figure 4. Real-ear measurements of the large (2.1 mm) diameter size vent for the three conditions.

Figure 5. Real-ear measurements of the extra large (2.5 mm) diameter size vent for the three conditions.
What was not expected, however, was the relationship between the two curves representing the “closed-vent” and the “probe-tube-through-vent” conditions for all but the largest 2.5 mm diameter vents. For all three of the smaller vents, the curves representing the “probe-tube-through-vent” condition show a greater amount of low-frequency output (least amount of low-frequency leakage) than do the “vent-closed” condition.
This finding is contrary to the generally accepted consequence of inserting the probe tube through the vent. As one author states, “If the probe fills most of the vent (ie, their diameters are similar), the low-frequency response may change in a manner consistent with a reduction of vent size.”6In other words, the same mechanisms will be at work regarding low-frequency leakage through a vent when a probe tube is in the vent, except that the actual diameter of the vent will be reduced by the diameter of the probe tube, which is 1 mm.
Our findings show that there is a least one other mechanism involved when measuring the output of a hearing aid with a probe tube through the vent of the earmold. More precisely, our data consistently show that the output of a hearing aid may be as much as 7 dB greater at the 250-500 Hz range in the probe-tube-through-vent condition than in the closed-vent condition when the vent is smaller than 2.5 mm.
One possibility, and therefore a concern, is that individuals fitted using real-ear probe microphone measures may be “underfit” in the low frequencies if the probe tube is inserted through such vents. This concern, however, assumes that the low-frequency output in the “probe-tube-through-vent” condition is greater than the “true” output for that fitting.
The other possibility is that the low-frequency output measured by the probe-through-vent condition (with no probe tube under the earmold) is actually the “truer” measure of the SPL in the ear canal when the earmold is worn. This possibility was suggested by Tecca9 when discussing the variations of REAR measurements obtained with different placements of the probe tube when fitting high-powered BTE hearing aids. His finding was that the in situ gain curve was greater when the probe tube was inserted through a “channel” in the earmold than when the probe tube was placed between the earmold and canal. In addition, he adds that placing the probe tube between the earmold and the canal creates a “slit leak” that decreases gain in the very low frequencies.
The results of Part 1 of this study also point to the possibilities that: 1) Placing the probe tube between the earmold and canal results in a slit leak that underestimates the “true” low-frequency output of a fitting; and 2) Placing the probe tube through a small-to-large (1.2-2.1 mm) vent gives a more accurate or “truer” measure of low-frequency output. Part 2 of this study further examines these possibilities.
Part 2 Study Methods
The same earmolds, hearing aid and settings, participants, and instrumentation used in Part 1 of this study were used in Part 2. Testing for the four vent sizes was done for the four different conditions:
#1: Probe-tube through vent, but “not active,” and probe-tube under earmold and “active”;
#2: Probe-tube through vent and “active,” and probe-tube under earmold but “not active”;
#3: No probe tube through vent, and probe-tube under earmold and “active,” and,
#4: Probe-tube through vent and “active,” and no probe tube under the earmold.
Probe tubes that were labeled “active” were connected to the Audioscan mic assembly and therefore measuring the output of the fitting under those conditions; those that were labeled “not active” were not connected to the mic assembly. The rationale for these four conditions was to further examine the effects of a probe tube through the vent, even when the probe tube was not “active.” Logic and current philosophies would suggest that the simple presence of the probe tube through the vent would have a salient effect on the low-frequency output of the aid, particularly when involving small-to-medium (1.2-1.6 mm) vent diameters.
Part 2 Study Results and Discussion
The results are shown in graphical form (Figures 6-9) with Condition #1 in blue, Condition #2 in orange, Condition #3 in gray, and Condition #4 in yellow. As can be seen, conditions #1-3 are fairly similar in all vent sizes and notedly are the conditions where there was a probe tube between the earmold and the canal. Furthermore, in conditions #1-3, and again for all vent sizes, whether the output was measured by the probe tube through the vent or by the probe tube under the earmold, low-frequency output curves were strikingly similar. What is noticeable, however, is that condition #4, where the probe tube had been removed from between the earmold and canal; and was the only condition of the four conditions where the probe tube was not between the earmold and canal, shows the most low-frequency output regardless of vent size.
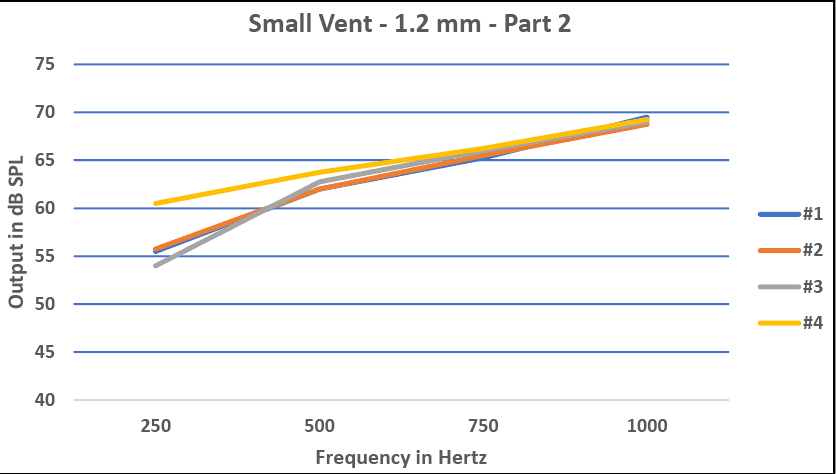
Figure 6. REM in Part 2 of the test using the four different conditions with a small (1.2 mm) vent size.
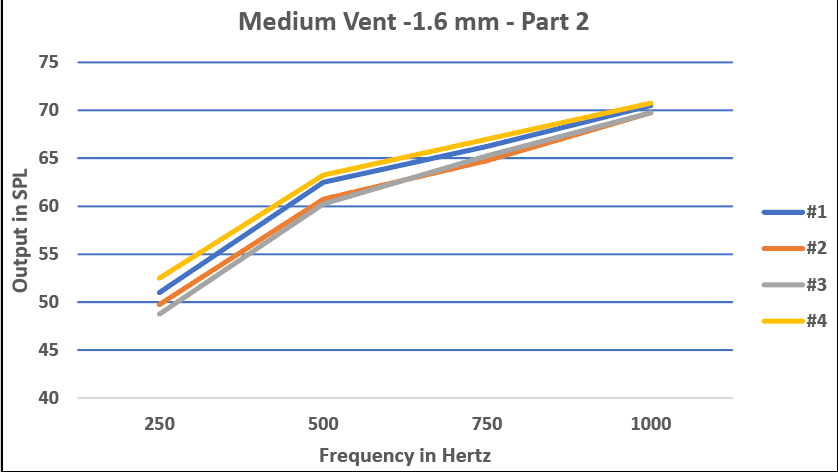
Figure 7. REM in Part 2 of the test using the four different conditions with a medium (1.6 mm) vent size.
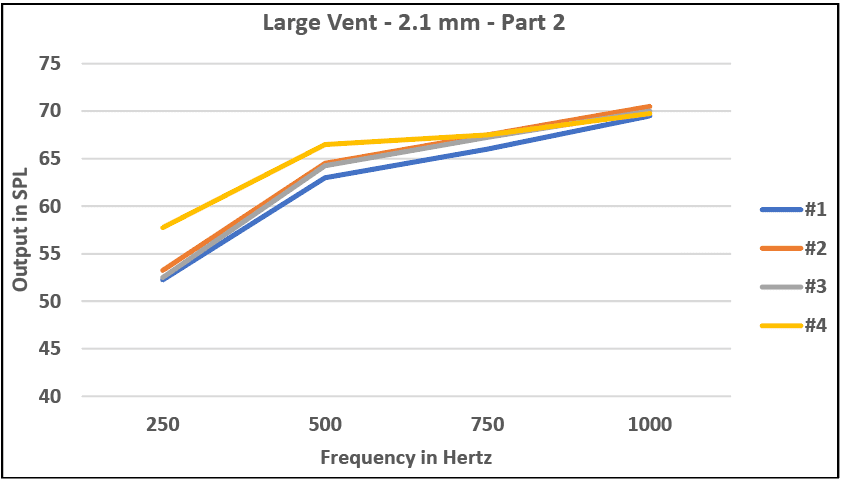
Figure 8. REM in Part 2 of the test using the four different conditions with a large (2.1 mm) vent size.
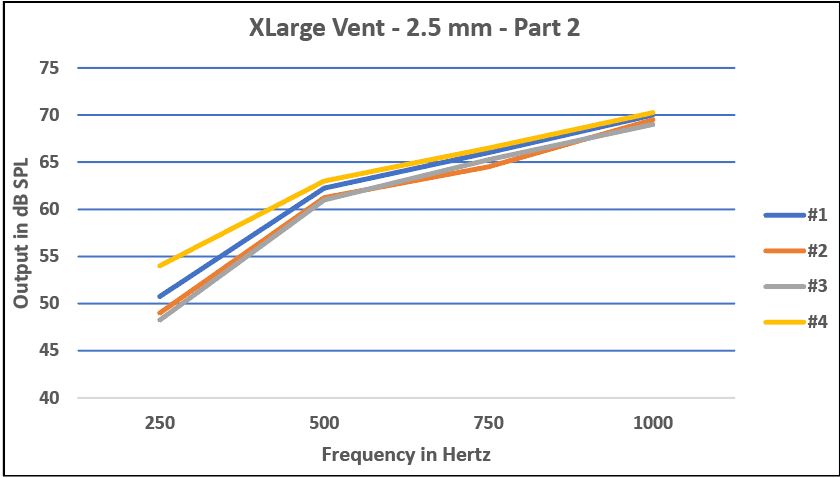
Figure 9. REM in Part 2 using the four different conditions with an extra large (2.5 mm) vent size.
Conclusions
Although the difference in output at 250-500 Hz may be only between 5-7 dB, we think that it is the “truer” measurement of output and that it could represent a clinically significant difference when fitting children with BTE hearing aids. Also, the results of our study seem to suggest that the size of the vent used as a pathway for the probe tube is notas significant as is the absence of the probe tube from between the earmold and the canal.
Therefore, our results strongly suggest that it is clinically acceptable to insert the probe tube through any-sized ventwhen performing real-ear probe microphone audiometry. In fact, the results obtained when inserting the probe tube through the vent may be a “truer” representation of the low-frequency output of the amplification system than the status quo.
Caveats to this study include that more research is needed in this area using a larger number of participants—in particular, a larger number of children with soft earmolds as opposed to acrylic. In addition, a method of accurately visualizing the medial tip of the probe tube during testing would be a valuable addition to the methods of another study.
Acknowledgements
The authors would like to thank Starkey Hearing Technologies for donating the BTE hearing aid used in this study. We would also like to thank All American Mold Laboratories Inc of Oklahoma City for donating all of the earmolds used in this study. Lastly, we would like to thank Andrew John, PhD, for his assistance in manuscript preparation.

Stephen W. Painton, PhD, is a Professor Emeritus in the Department of Communication Sciences & Disorders at the University of Oklahoma Health Sciences Center in Oklahoma City, Okla. Taylor Sweeney, BS, is an AuD student at the University of Oklahoma Health Sciences Center.
Correspondence can be addressed to Dr Painton at: [email protected]
Citation for this article: Painton SW, Sweeney T. Effects of probe tubes inserted through earmold vents on real-ear probe microphone measurements. Hearing Review. 2019;26(9):24-28.
References
-
Valente M, Abrams H, Benson D, et al. Guidelines for the audiologic management of adult hearing impairment. https://audiology-web.s3.amazonaws.com/migrated/haguidelines.pdf_53994876e92e42.70908344.pdf.
-
Caldwell M, Souza, PE, Tremblay KL. Effect of probe insertion depth on spectral measures of speech. Trends in Hearing. 2006:10(3):145-154.
-
Boys Town National Research Hospital. Online fact sheet: RECD Measurements. Published 2017. https://www.babyhearing.org/resources/recd-measurement-advantages.
-
Audioscan Inc. Audioscan Verifit User’s Guide 3.18. https://docs.audioscan.com/userguides/archive/VerifitUsersGuide_3.18.pdf.
-
Mueller HG. Back to Basics: Probe-mic and speech mapping measures. Lecture presented at: AudiologyOnline Course #27961 on Demand; July 1, 2016. https://www.audiologyonline.com/audiology-ceus/course/hearing-aid-essentials-verification-27961
-
Dillon H. Hearing Aids. 2nd ed. New York, NY: Thieme Medical Publishers;2012:[Kindle Edition]4048-4050.
-
Practitioner’s Notebook. Tips on proper probe-tube placement. Hear Jour.2001:54(5):65.
-
Oticon. The REM Cookbook: How to correctly perform real ear measurements. https://www.oticon.com/~/media/Oticon%20US/main/Download%20Center/Opn/Product%20Information/12241%20-%2015555-10026%20Real%20Ear%20Cookbook.pdf
-
Tecca J. Use of real-ear measurements to verify hearing aid fittings. In: Valente M, ed. Strategies for Selecting and Verifying Hearing Aid Fittings. 1st ed. New York, NY: Thieme Medical Publishers;1994:88-107.