Staff Standpoint | April 2018 Hearing Review

Last month, I presented the results of a dispenser survey that were primarily focused on the pricing of receiver-in-the-canal (RIC) hearing aids and the highest- and lowest-priced devices offered in US hearing care practices during July-August 2017. Overall, the results showed that consumers have a wide range of price options for professionally dispensed hearing aids, with median prices of $1,273, $2,000, and $2,900 for economy, mid, and premium-level RICs. Additionally, more than three-fifths (61%) of all dispensers in the survey indicated they offer a hearing aid for less than $1,000, and more than one-quarter (27%) offer an aid for $800 or less.
Although caution has to be taken relative to comparing this survey with previous HR surveys (see discussion in the article) the results also indicated that average selling prices (ASP) for hearing aids are decreasing at a faster-than-usual pace. That brings up the obvious question of how dispensing offices in the survey were faring in terms of sales and gross revenues.
Figure 1a-b shows the combined data for dispensing audiologists and hearing aid specialists’ responses to a question about increases/decreases in gross revenues, with the top graph separating the respondents by practice affiliations (ie, ranging from independents, independents belonging to co-ops, practices owned by or affiliated with a hearing aid manufacturer or corporate chain, big box, and not-for-profits) and the bottom graph separating practices by gross revenue size (ranging from over $1 million to less than $100,000). Overall, one can see that the majority of respondents were experiencing increases or at least holding steady in terms of their gross revenues—and it should be noted that the survey was taken at a time when HIA statistics indicated relatively modest gains in hearing aid unit sales for the private sector (2.1% increase in the first half of 2017).
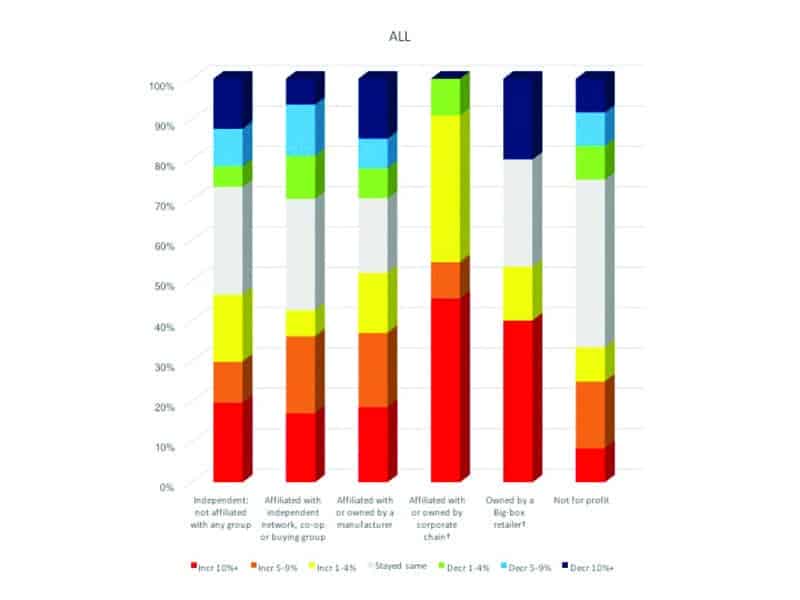
Figure 1 a

[Click on figures to enlarge.] Figure 1a-b. Reported gross revenue increases/decreases for dispensing offices in the mid-2017 survey, by practice affiliation (left) and practice size (right) relative to the same period in 2016. Warmer colors (red, orange, and yellow) signify increases in gross revenues, gray signifies static revenues, and cooler colors (green, blue, and dark blue) signify decreases in revenues. Notes: †Practices affiliated with or owned by a corporate chain had the fewest respondents (n = 11/209) in the survey. All big box respondents were hearing aid specialists except one. For a more detailed discussion, see “Hearing Review Survey of RIC Pricing in 2017” in the March 2018 HR.
Citation for this article: Strom KE. Keep building your business. Hearing Review. 2018;25(4):6.