Cover Story | September 2014 Hearing Review
Applying Deming and Heskett’s principles to hearing healthcare practices | Hearing Review September 2014
By Sergei Kochkin, PhD; Laura Dennison, AuD, BC-HIS; and Linda Jackson
In terms of customer loyalty, hearing care professionals must find ways to eliminate saboteurs from their practice and substantially increase the number of apostles so that the latter comprise the majority of customers in a given practice. Here’s how you can do it.
In the last 30 years, the compound annual growth rate (CAGR) of the private hearing aid market was only 2.6%.1 The majority of customers in the hearing aid industry are repeat purchasers (63.4%) while the minority (new users) are nearly into their 7th decade of life. Much of the growth in the private market can be attributed to binaural penetration, which has probably reached saturation at nearly 90% for bilateral loss consumers, compared to 66% in 1991.2
The thesis of this paper is current customers of hearing healthcare are a precious commodity. In fact, they are the key driver of industry growth and profitability. Given the difficulty in attracting new hearing aid users, ways must be found to enhance consumer loyalty of current hearing aid users.
According to W. Edwards Deming in his ground-breaking book Out of the Crisis,3 a happy customer who comes back for more is worth 10 new prospects. Happy customers spread their good news to 8 other potential customers, but unhappy customers spread their bad news to 16 potential customers.
This startling discovery was made in 1986 before the existence of the Internet, Facebook, Twitter, Angie’s List, Yelp, YouTube, and other social media sites where customers can reach tens of thousands of people (in some instances millions) with either a positive or negative endorsement of a product or a service. Readers may recall the viral YouTube video of a musician who had his guitar smashed by United Airlines while in transit; he was motivated to make this video because United Airlines was indifferent to his dissatisfaction (UA recently made amends and changed their policies). Deming’s message to US corporations (in 1986!) who were losing market share to foreign competitors was simple:
It will not suffice to have customers that are merely satisfied. An unhappy customer will switch. Unfortunately, a satisfied customer may also switch, on the theory that he could not lose much and might gain. Profit in business comes from repeat customers, customers that boast about your product and service and that bring friends with them. [page 141]3
Deming then went on to hypothesize that the profit from a repeat customer may be as high as 10 times that of a new customer that responds to advertising.
According to the American Marketing Association (AMA), 100 satisfied customers generate 25 new customers; for every complaint received, there are 20 consumers who do not bother to complain, thus remaining a huge hidden source of dissatisfaction. The cost of acquiring a new customer is 5 times higher than keeping a customer satisfied. In short, satisfied customers improve business and dissatisfied customers can actually destroy a business.4
Improvement Areas for Hearing Healthcare
The cost of not engaging in a systematic dialogue with our customers (ie, validation) to learn how we are doing in meeting their needs and expectations—as well as how you can do a better job—is generally recognized to be staggering, according to the experts. Without consumer feedback, it is difficult to formulate a strategy for “keeping your hard-earned customers.”5 Let’s consider some established data from the hearing aid industry with respect to customer focus:
Brand loyalty. Hearing aid brand loyalty has never exceeded 50% since this metric was introduced in the MarkeTrak surveys starting in 1994. This means that the likelihood of significant consumer defection to competing hearing aid brands is substantial. The larger question is: to what extent do consumers also defect from the hearing healthcare professional who fit their hearing aids?6
Validation and measuring customer satisfaction. Only about 15% of hearing healthcare professionals (HHPs) formally measure consumer satisfaction; only 20% of consumers are given the opportunity to report their subjective benefit with hearing aids, and only two-thirds of consumers receive objective benefit measures in their hearing aid fitting protocol.7 This is perplexing considering that most other industries such as banking, hotels, car rentals, restaurants, online purchasing, and even your local car dealership during a $30 oil change usually include a serious attempt to solicit consumer input.
Lost business/opportunity costs. Nearly 20% of people with hearing loss who choose to be non-adopters report their decision was based on the poor experience of a friend or relative. That amounts to nearly 4.2 million people. Considering their average age (66), the binaural rate (75%), and the expected 4-5 year repurchase cycle over their lifetime, if they cannot be convinced of the quality of hearing healthcare and that they will derive significant benefit from visiting a HHP, then the opportunity cost of this potentially lost consumer segment is staggering—perhaps a loss of 35 million hearing aids over the next 20 years.7-8
HHP protocols. Fifteen of 17 aspects of a hearing aid fitting protocol were shown to be significantly related to whether or not the consumer would recommend the HHP to others with hearing loss.7
Wary consumers. Nearly 1 million customers have their hearing aids in the drawer—12.4% of all hearing aid users.2 If these people complained to 16 other people, as Deming suggests, that would be 16 million consumers! Not surprisingly, given the speed of consumer communication, the #1 feature sought in hearing aids by non-adopters when presented with an exhaustive list of features is a “money-back guarantee” if the hearing aids do not work.8 A total of 40% of people with mild hearing loss and nearly 60% of people with moderate-severe hearing loss indicated they would be much more likely to purchase hearing aids if they could have a money-back guarantee assurance. In conversations with hearing industry experts, just about everyone says, “Wait a minute, we already do this!” Yet, how can we explain a million customers with their hearing aids in the drawer?
Apostles and Saboteurs
So, why do we bring these issues up? It’s all about quality in hearing healthcare delivery, consumer satisfaction, and therefore consumer loyalty. These are the real drivers of market growth and profitability. The most influential work in this area is by Heskett and colleagues9 at the Harvard Business School. It is their position that:
- Companies who put employees and customers first are the most successful.
- The lifetime value of a loyal customer is astronomical when you consider customer retention, repeat business, and referrals (known as the “3 Rs”).
- Profit and growth are driven by customer loyalty. It is estimated a 5% increase in customer loyalty translates into up to an 85% increase in profits.
- Loyalty is a direct result of customer satisfaction.
- Satisfaction is driven by high value (and in previous works we have defined this as how much the consumer spent for each percentage-point reduction in hearing-handicap).10
- When rewarding employees, enlightened leaders of companies stress the number of satisfied customers over the number of widgets sold. Profit will naturally emanate out of high levels of consumer satisfaction.
- As we have learned from psychometric theory,11-12 it is all about the intensity of the feeling the consumer has for the product and service. In analyzing consumer loyalty, Heskett et al discovered that “very satisfied” consumers were 6 times more likely to repurchase than “satisfied” consumers.
- Value drives customer satisfaction. Quite simply, this is what the consumer received in either products or services relative to how much they paid for it in price and other costs (most notably time). Again, in hearing care, it is most closely associated with how much the consumer spent for each percentage-point reduction in their hearing-handicap.
- Employee satisfaction is intimately related to consumer satisfaction and loyalty.
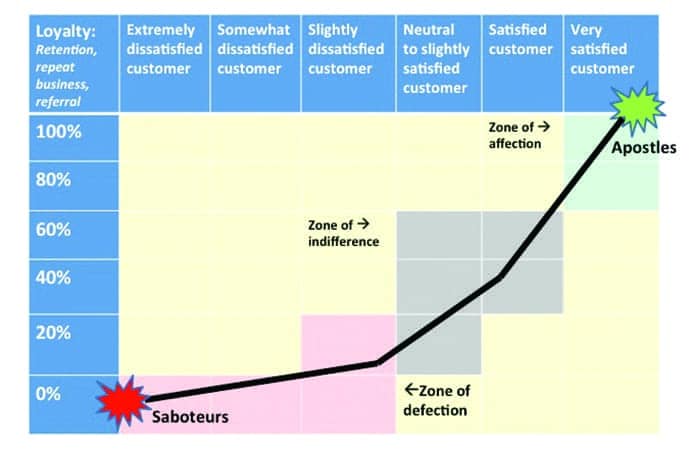
[Click on figures to enlarge] Figure 1. Relationship between customer satisfaction and customer loyalty. Adapted from Heskett and colleagues.
- Create as many APOSTLES of your business or practice as possible, that is customers who are so satisfied that they convert other people to your product or service. In general, even a satisfied customer is shown to result in significant defection.
- Be careful that you do not create SABOTEURS (Heskett et al back in 1994 called them “terrorists”), that is customers so dissatisfied that they not only defect, but they do everything in their power to destroy your business through negative word-of-mouth advertising. And, as stated earlier with the advent of the Internet and social media sites, the ability of disloyal customers to speak out against your product and service is astonishing.
Heskett et al classified customers who are “very satisfied” as being in the zone of affection, which is consistent with psychometric theory; they are irresistibly drawn toward the service or product precisely because it meets or exceeds their needs—in fact, so much that they want other people to share in their joy.
While satisfied customers are great, they are in the zone of indifference, meaning there is a high probability of defection as they seek out a product or service that will more perfectly meet their needs. This is especially true of products or services where the consumer experiences “slight” levels of satisfaction or neutrality where their negative and positive feelings toward the service or product are balanced.
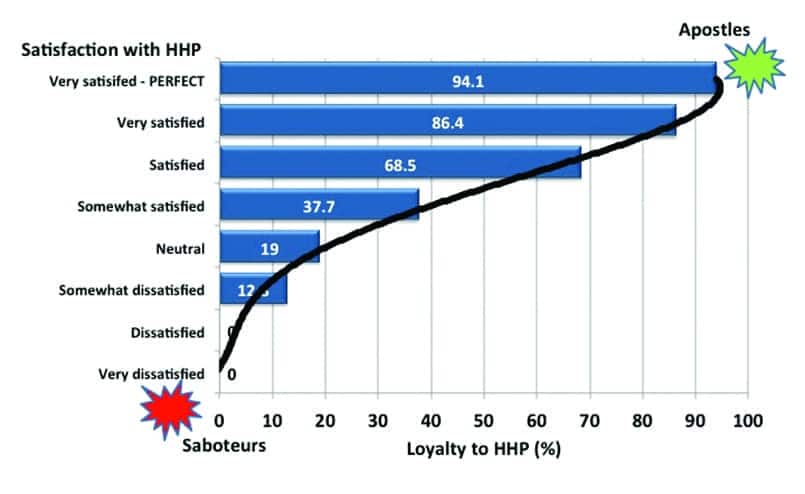
Figure 2. Customer loyalty by level of satisfaction with the hearing health professional (n=2,928).
As the customer drops below “healthy levels” of satisfaction, they enter into the zone of defection and the realm of consumer disloyalty. Not only do they defect, but they attempt to get everyone else to defect or avoid the product or service. Thus, they become saboteurs of your business.
When you read the vast literature on consumer satisfaction, it is evident that a dissatisfied customer is toxic to a business. A dissatisfied customer results in:
- No initial sale of the product (eg, return for credit);
- No repeat purchase of the product;
- Negative word-of-mouth advertising;
- Less referral business;
- More bad debt write-offs;
- Higher employee turnover and absenteeism;
- Lower staff morale;
- Lower compliance with instructions;
- More malpractice suits; and
- Lower profitability.
Study Objectives and Methods
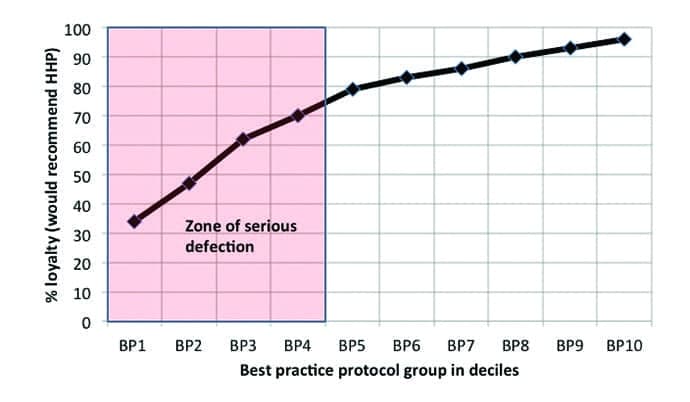
Figure 3. Customer loyalty by level of best practices. Where BP1= lowest 10% of best practices, BP5=50%, and BP10=100% or most comprehensive best practice protocol (n=2,002).
Numerous attempts have been made to quantify the consumer loyalty model shown in Figure 1; one would expect that this model would vary by industry. The purpose of this paper is to demonstrate the relationship between consumer satisfaction and consumer loyalty in the hearing healthcare industry with an emphasis on the hearing healthcare professional (HHPs). Specifically, we will look at the following:
1) Consumer satisfaction with HHPs;
2) Consumer loyalty ratings with HHPs;
3) The impact of consumer satisfaction on loyalty (and therefore customer retention, repeat business, and referrals); and
4) The relationship between customer loyalty and best practices.
Finally, we will offer some practical suggestions for improving consumer loyalty.
Method
Referring to the most recent MarkeTrak survey, in November and December 2008 a short screening survey was mailed to 80,000 members of the National Family Opinion (NFO) panel. The NFO panel consists of households that are balanced to the latest US Census information with respect to market size, age of household, size of household, and income within each of the 9 census regions, as well as by family versus non-family households, state (with the exception of Hawaii and Alaska), and the nation’s top 25 metropolitan statistical areas. The screening survey included the following items: 1) Physician/staff screened for hearing loss during their physical in the last year; 2) Whether the household had one or more people “with a hearing difficulty in one or both ears without the use of a hearing aid”; 3) Whether the household had one or more people who were the owner of a hearing aid; 4) Whether the household had one or more people with tinnitus (ringing in the ears); 5) Perceptions of job discrimination in promotions and salary equity; 6) Detailed quantification of employment status (beyond simpler NFO panel data); and 7) Traffic accidents over the past 5 years and driving habits.
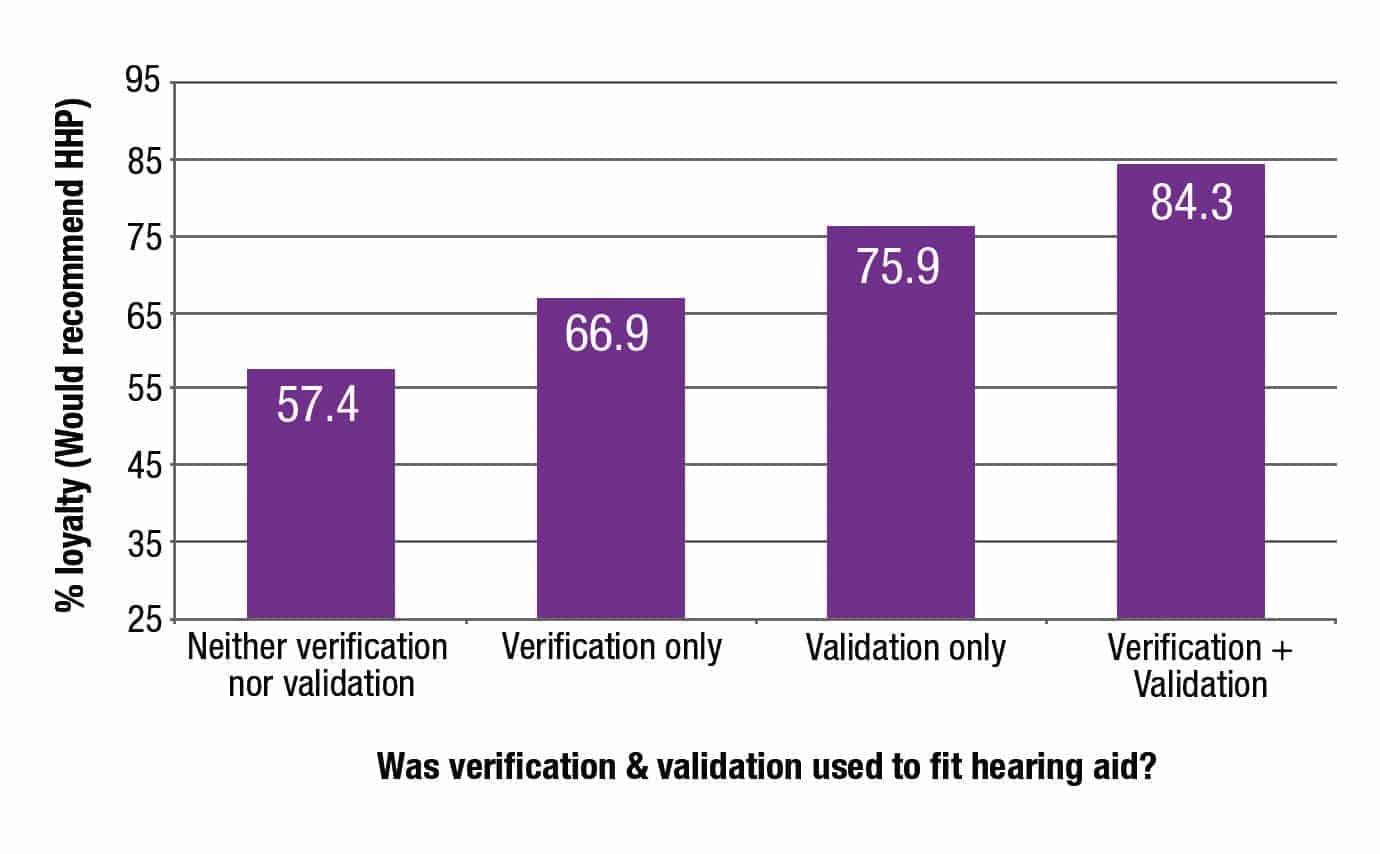
Figure 4. Customer loyalty as a function of best practices: Verification & validation used in fitting hearing aid (n=2,020)
This short screening survey was completed by 46,843 households and helped identify 14,623 people with hearing loss and also provided detailed demographics on those individuals and their households. The response rate to the screening survey was 59%. In January 2009, an extensive 7 page legal size survey was sent to the total universe of hearing aid owners in the panel database (3,789); 3,174 completed surveys, an 84% response rate. In February 2009, an extensive 7 page legal size survey was sent to a random sample of 5,500 people with hearing loss who had not yet adopted hearing aids. The response rate for the non-adopter survey was 79%.
Measure of consumer satisfaction with the hearing healthcare professional. The total national sample of hearing aid consumers (excluding direct mail customers) were asked to rate their HHP on seven factors using a 7-point Likert scale: “Very dissatisfied,” “Dissatisfied,” “Somewhat dissatisfied,” “Neutral” (equally satisfied and dissatisfied), “Somewhat satisfied,” “Satisfied,” and “Very satisfied.” Likert ratings on the following factors were captured: a) professionalism, b) knowledge level, c) explained care of the hearing aid, d) explained hearing aid expectations, e) quality of service during the hearing aid fitting, f) quality of service post-fitting, g) level of empathy.
We took the average of these seven ratings since they represent a single consumer dimension, as determined by a factor analysis of HHP ratings (Eigenvalue = 5.3, Proportion of variance explained 81.3%). The HHP’s ratings were rounded to one of the seven Likert scale points taking the values 1 (Very dissatisfied) to 7 (Very satisfied), with one exception. An eighth category was created and called “Very satisfied/Perfect,” if the HHP achieved a perfect rating on all seven factors measured. The distribution of ratings achieved by hearing healthcare professionals was as follows:
- Very satisfied/Perfect (29.58%)
- Very satisfied (14.31%)
- Satisfied (36.54%)
- Somewhat satisfied (9.97%)
- Neutral (7.21%)
- Somewhat dissatisfied (1.61%)
- Dissatisfied (0.44%)
- Very dissatisfied (0.34%)
In the results section, we will determine the level of loyalty associated with each level of satisfaction with the hearing healthcare professional, and also use this data to illustrate estimation of consumer loyalty.
Measure of customer loyalty. Consumers were asked to indicate if they would recommend the hearing healthcare professional using the following scale: “yes,” “no,” or “not sure.” Consumers who indicated “yes” for this exercise in all likelihood can be considered as loyal to their HHP, and would be expected to have a high probability of returning and/or referring to that professional.
Measure of best practices. In an earlier study7 on the impact of the hearing healthcare professional on hearing aid user success,17 aspects of the hearing aid fitting protocol were weighted based on their relationship to real-world success. An overall index of best practices was standardized to a z-score with a mean of 5 and standard deviation of 2 (stanine scores). In this study, the stanine scores were converted to percentile rankings and then grouped into 10 levels of best practices in deciles, where BP1=minimal hearing aid fitting protocol – 10%, BP5=average (50%) protocol, and BP10=comprehensive (100%) protocol. HHPs with minimal hearing aid fitting protocols were shown to be less likely to use a sound booth, use real-ear measurement to verify the hearing aid fitting, not use validation techniques, and not provide aural rehabilitation services. The reader is referred to previous studies documenting HHP fitting behaviors for each of the best practice deciles.7,13
It should be noted, for this paper, the best practice protocol rating was recalibrated to remove ratings of the HHP, since we will be evaluating customer loyalty as a function of level of best practices. In addition, the best practice sample includes only consumers whose hearing aids were 4 years of age or less.
Results
Consumer loyalty in hearing healthcare. Customer loyalty is plotted in Figure 2 for HHPs. Consumer loyalty to HHPs is 70.6% for the entire United States. Consistent with the Heskett model, consumer loyalty toward HHPs is highly related to perceptions of the attributes of the HHP. Professionals with perfect ratings achieved a 94.1% loyalty rating, while HHPs with less than perfect ratings achieved a 86.4% loyalty rating. These would be HHPs in the “zone of affection.”
Consumer loyalty is shown to decline to 68.5% if they are “satisfied” with the HHP—certainly not as rapid a decline into the “zone of indifference” as we see in the Heskett model in Figure 1. The rapid decline in loyalty occurs when the consumer is “somewhat satisfied” with the HHP (37.7% loyalty), and it precipitously plummets toward the “zone of defection” when the consumer is “neutral” (19% loyalty) or “somewhat dissatisfied” (12.8% loyalty). HHPs receiving ratings below “somewhat dissatisfied” achieved loyalty ratings of zero. It is highly unlikely that consumers will give HHPs their repeat business or refer their friends and relatives with hearing loss when the consumer is “somewhat satisfied” or less with their HHP. Both Deming and Heskett et al would probably argue that even a level of “satisfied” would leave the HHP vulnerable to the consumer seeking a better solution for their hearing loss from a more enlightened HHP or less expensive hearing solution.
Best practices and their impact on consumer loyalty. As shown in an earlier paper,7 there is a wide range of protocols used to fit hearing aids in the United States. It has been shown that what happens in the HHP’s office directly translates into consumer real-world success with hearing aids.7 We will next explore the relationship between customer loyalty and best practices used to fit hearing aids.
In Figure 3, we have plotted consumer loyalty by deciles (10 levels) of best practices where BP1=the lowest 10% of best practices or a minimalist protocol, BP5=average or 50th percentile, and BP10=the most comprehensive best practice protocol. Those with the highest level of best practices (BP10) have a 96% loyalty rating, while HHPs at the 70th percentile (BP8) have 90% loyalty ratings. Loyalty ratings steadily decline to 80% when the HHP utilizes average best practices, and then loyalty rapidly declines to 34% for those using minimalist fitting protocols.
Clearly, consumers experiencing mediocre best practices will defect in droves, and any business that consistently uses minimalist protocols to fit consumers with hearing aids cannot be expected to have a large loyal consumer population, which is so critical to long term success.
It should be kept in mind that BP5 is about equal to the hearing healthcare experience that a consumer achieves when purchasing hearing aids through the mail.10 By enhancing the best practices utilized to fit hearing aids, we are hypothesizing that the typical HHP can improve the loyalty of their customer base. For example, previously we have shown that the use of verification (real-ear measurement) and validation (subjective or objective) can result in a significant reduction in customer visits to the HHP.14
It is beyond the scope of this paper to explore all aspects of the hearing aid fitting protocol as they impact consumer loyalty. However, let’s examine the relationship between customer loyalty and whether or not the HHP utilized verification and/or validation to fit the hearing aid (otherwise known as V + V).
Figure 4 shows those HHPs who utilized both verification and validation achieved loyalty ratings of 84.3%, while those who used neither had loyalty ratings of 57.4%. Utilizing verification or validation only resulted in lower loyalty ratings (66.9% and 75.9%, respectively). The point here is one can increase customer loyalty 47% simply by incorporating both V + V in your practice (that is, if you currently do neither).
So, What Is Your Customer Loyalty Quotient (CLQ)?
Consistent with research from other industries on consumer loyalty and consumer satisfaction, loyalty and therefore consumer retention, repeat purchase, and referral (the 3Rs) are highly dependent on the level of perceived satisfaction with the HHP. A clinician can expect near perfect retention (96%) if their customer population is “very satisfied/perfect” and almost no retention if their customers are “dissatisfied” (0%) or “very dissatisfied (0%).” Even with ratings of “neutral” (19%) or “somewhat dissatisfied” (12.8%), they can be expected to retain a minority of their customers. And if they do, it is unlikely they will receive many referrals.
Calculating your customer loyalty quotient (CLQ). The CLQ is an important figure which should predict your level of long-term success; this is a figure you should know and measure. You will recall the CLQ norm is 70.6%. If you do not measure loyalty or satisfaction, a useful exercise would be to self-estimate the proportion of your consumer population as they fit into the 8-point Likert scale (with the additional perfect rating). For example, assume you feel your customer population’s satisfaction with your dispensing office can be classified as follows: Very satisfied/perfect (10%), very satisfied (15%), satisfied (25%), somewhat satisfied (25%), neutral (15%), somewhat dissatisfied (5%), dissatisfied or worse (5%).
At first glance, the ratings look pretty good, with 75% of consumers rating the HHP as “somewhat satisfied” or higher and only 10% “somewhat dissatisfied” or worse. Using the population weights documented above in the Method section, the forecasted customer loyalty is only 17.9%.
In our conversations with HHPs, there is an inherent assumption that, if the consumer does not complain or if hearing aid returns are low (less than 1-2% we hear from many HHPs when the industry norm is in excess of 20%15), then customer satisfaction and loyalty must be high. Clearly, this is not the case. And you will recall from the literature that only a small minority of consumers vocalize their dissatisfaction to the business.
Five Ways Most Practices Can Improve CLQ
So what can the typical hearing healthcare professional do to improve consumer loyalty? The single take-away point is the HHP must find ways to eliminate saboteurs from their practice and substantially increase the number of apostles so that they comprise the majority of customers in a given practice.
While it is beyond the scope of this paper to go into the dozens of interventions which can be done to build a practice with a large proportion of blissful customers, here are a few suggestions based on the literature:
Adhere to best practices. In fitting hearing aids, use the very best hearing aid fitting protocol you can find—and establish it as the standard work flow/process within your and your staff’s work. Best practices exist in writing from every credentialing organization and major hearing care association in the United States. Be process driven. Cutting corners by throwing out critical components is the road to mediocrity, if not obsolescence. Key components are: integrity of testing (ie, sound booth and calibrated equipment), quality assurance prior to fitting the hearing aid (eg, hearing aid analyzers), verification using real-ear and speech-in-noise testing, validation (ie, how much better is the consumer doing since they met you and paid for your services?), and counseling in all its myriad forms (group, individual, self-help books and videos, referral to HLAA) especially to new users. This is what differentiates you from consumer electronics and online sales. Bullet-proof your business with an unbeatable fitting protocol and customer service process.
Talk frankly with your customers about their hearing aid benefit. Make it easy for them to tell you how good or bad a job you and your staff are doing—and specifically how you can improve your care. This means conducting an ongoing customer audit through customer satisfaction measurement and skillfully using subjective and objective benefit measures to engage your customers in a frank discussion on how you have changed their life. There are many resources for doing this, and some are listed in references to this publication.4,5,16 Have a customer suggestion box in your office in which current customers, as well as customers you have lost (eg, returns and people with significant hearing loss who did not purchase from you), have an anonymous opportunity to tell you how to improve and, in the case of returns, what could you have done better that would have influenced them to adopt hearing aids.
Money-back benefit guarantee. The #1 hearing aid feature desired by people with hearing loss is to get their money back if they do not experience sufficient benefit with the hearing aids relative to its price. If we want to move beyond a 2.6% growth rate and mitigate the trend toward commoditization of hearing healthcare, then this benefit-value discussion has to take place with our customers.
Ensure your clients benefit from Multiple Environmental Listening Utility (MELU). The role of the HHP is to assure that their customers hear and comprehend in as many listening environments as possible. MELU is intimately related to customer loyalty. With the advent of wireless and other advanced technologies, including assistive listening devices (eg, companion microphones), hearing aids can finally deliver superior near-field utility. However, a wireless far-field solution is still in the distant future. To generate apostles, the HHP must find ways for the consumer to function in far-field and noisy environments; the only possible way is to reduce signal to noise by bringing the sound source closer to the consumer. For the near-future (perhaps the next 10-15 years), this may mean becoming advocates in your community for looping America.
Redefine “success.” The authors have been to dozens of award ceremonies sponsored by some of the hearing healthcare networks. Success for too many is defined by the number of hearing aids sold by a HHP or office, or growth over the previous year. This short-term measure we suggest is detrimental to the ultimate profitability of the typical practice. We would hope that success will be redefined as HHPs who are shown to generate the largest number of customers who are “very satisfied” with hearing healthcare received. In the future, let’s reward those HHPs who have the largest proportion of “apostles” in their customer population. All the evidence in this article suggests that their success in terms of sales will follow.
Acknowledgement
This publication was made possible by a grant from the National Board for Certification in Hearing Instrument Sciences (www.NBC-HIS.com). NBC-HIS is an independent, non-profit, credentialing organization established to promote continuing competency assurance of hearing health professionals and to provide a standard of excellence in hearing healthcare for the consumer.
References
1. Hearing Industries Association (HIA). HIA Quarterly Statistics Report, 4th Quarter Statistics. Washington, DC; HIA.
2. Kochkin S. MarkeTrak VIII: 25 year trends in the hearing health market. Hearing Review. 2009;16(11)[Oct]:12-31. Available at: https://hearingreview.com/2009/10/marketrak-viii-25-year-trends-in-the-hearing-health-market
3. Deming WE. Out of the Crisis. Cambridge, Mass: MIT Center for Advanced Engineering Study; 1986.
4. Dutka A. AMA Handbook for Customer Satisfaction. Chicago: NTC Publishing; 1995.
5. Wing MJ. The Arthur Anderson Guide to Talking with Your Customers. Chicago: Upstart Publishing Co; 1997.
6. Kochkin S. MarkeTrak VIII: Customer satisfaction with hearing aids is slowly increasing. Hear Jour. 2010;63(1):11-19.
7. Kochkin S, Beck D, Christensen L, Compton-Conley C, Fligor B, Kricos P, McSpaden J, Mueller G, Nilsson M, Northern J, Powers T, Sweetow R, Taylor B, Turner R. MarkeTrak VIII: The impact of the hearing healthcare professional on hearing aid user success. Hearing Review. 2010;17(4):12-34. Available at: https://hearingreview.com/2010/04/marketrak-viii-the-impact-of-the-hearing-healthcare-professional-on-hearing-aid-user-success
8. Kochkin S. MarkeTrak VIII: The key influencing factors in hearing aid purchase intent. Hearing Review. 2012;19(3):12-25. Available at: https://hearingreview.com/2009/10/marketrak-viii-25-year-trends-in-the-hearing-health-market
9. Heskett JL, Jones TO, Loveman GW, Sasser WE, Schlesinger LA. Putting the service profit chain to work. Harvard Business Review. 1994;72(2)[Mar/Apr]:164-170.
10. Kochkin S. A comparison of consumer satisfaction, subjective benefit, and quality of life changes associated with traditional and direct-mail hearing aid use. Hearing Review. 2014;21(1):16-26. Available at: https://hearingreview.com/2014/01/a-comparison-of-consumer-satisfaction-subjective-benefit-and-quality-of-life-changes-associated-with-traditional-and-direct-mail-hearing-aid-use
11. Nunnally JC. Psychometric Theory. New York: McGraw Hill; 1967.
12. Edwards AL. Techniques of Attitude Scale Construction. New York: Appleton-Century-Crofts Inc; 1957.
13. Kochkin S. MarkeTrak VIII: Consumers report improved quality of life with hearing aid usage. Hear Jour. 2011;64(6):25-32
14. Kochkin S. MarkeTrak VIII: Reducing customer visits through verification and validation. Hearing Review. 2011;18(6)[June]:10-12. Available at: https://hearingreview.com/2012/03/marketrak-viii-the-key-influencing-factors-in-hearing-aid-purchase-intent
15. Strom KE. US hearing aid sales flat in first quarter of 2014. Hearing Review. 2014;21(5)[May]:8. Available at: https://hearingreview.com/2014/05/staff-standoff-us-hearing-aid-sales-flat-first-quarter-2014
Original citation for this article: Kochkin S, Dennison L, Jackson L. What is your customer loyalty quotient (CLQ)?: Applying Deming and Heskett’s principles to hearing healthcare practices. Hearing Review. 2014;21(9):16-21.