Research | August 2019 Hearing Review
The journey continues for the industry’s longest-running survey of consumers with hearing loss
On the eve of major changes in the regulations governing the distribution of hearing aids in the United States, including the new upcoming class of over-the-counter (OTC) hearing devices, MT10 looks at consumers’ perceptions about hearing aids and personal sound amplification products (PSAPs)—as well as their attitudes about OTC devices and do-it-yourself hearing care.
The hearing aid market is poised for waves of disruption over the next few years. This will come in several forms:
- New technology from the existing manufacturers;
- New manufacturers entering into the hearing aid market;
- New entries into the upcoming OTC (Over-the-Counter) market; and
- New delivery channels including the expansion of the evolving DTC (direct-to-consumer) market.
These will impact the professional community in many ways, from the types of products they provide in their practice, to the pricing structure of those products. The manufacturing community will also be impacted by the disruption.
However, the group that may see the largest impact is the consumer. They will be presented with many alternative methods to obtain testing and fitting services, as well as new delivery models. For many hearing-impaired individuals who find the existing journey complicated, the new realities of the hearing aid marketplace may be more confusing, if not overwhelming.
The purpose of the MarkeTrak research over the past 30 years has been to examine the trends in hearing healthcare, provide professionals with a better understanding of the consumer journey, and assist the consumer in their quest for treatment of their hearing impairment. MarkeTrak 10 (MT10) is the latest survey conducted by the Hearing Industries Association (HIA) that continues this important research. MT10 builds on the data collected in MT9,1 which in late 2014 looked into the incidence of hearing loss, usage of hearing aids, and into the key areas of the patient journey for those with hearing loss. Authors’ note: As Abrams and Kihm noted in their publication, MT9 was the first in the MT series to employ an online (instead of a pencil-and-paper) survey. For more details on MT methodology, see “An Introduction to MarkeTrak IX: A New Baseline for the Hearing Aid Market.” 1
The research method for MT10 was similar to MT9, using online surveys to collect the data. In Part 1, a survey was sent to a large sample of 20,072 households representing over 55,000 individuals. This sample group was balanced and weighted to reflect key US census data characteristics. In Part 2, MT10 recruited those individuals identified as having a hearing loss/difficulty. This resulted in a total sample of 3,132 individuals who received the second survey which provided us with deeper insights. The final group included 969 owners of hearing aids and 2,163 non-owners of hearing aids.
MT10 asked the traditional set of questions on a wide range of topics: estimating the extent of hearing loss; the decision path and journey of both owners and non-owners of hearing aids; and satisfaction of owners and non-owners with their devices and with hearing care providers. It also went a step further, including a set of questions directed to owners and non-owners of PSAPs (Personal Sound Amplification Products).
MT10 is one of the first surveys to gather data on the topic of PSAPs from those who currently use these devices, shedding light on the possible differences in the patient journey for those who may use the upcoming OTC devices. MT10 was initiated in the fall of 2018, when speculation was peaking about how OTC hearing aids will be defined, what their performance characteristics will be (eg, gain and output characteristics), what the labeling will say, and many more factors. Therefore, it posed specific questions designed to explore the beliefs, perceptions, attitudes, and possible actions of consumers with hearing loss regarding do-it-yourself (DIY) hearing care. Their responses may help provide direction to those who currently deliver services and technology to people with hearing loss.
Examining Hearing Loss
Hearing loss has been a “hidden” medical issue for quite some time, with many individuals not recognizing or willing to accept they have a loss. With no outward symptoms —and most individuals reluctant to admit they have a problem—the treatment options are elusive to many.
Studies indicate that about 1 in 10 individuals have a hearing loss that interferes with their communication. This represents approximately 38 million people in the US, and many millions more around the world. MarkeTrak data has shown the incidence of hearing loss has remain stable over time (Figure 1), and the average person is aware they have a hearing impairment for about 12 years (Figure 2). On average, once people become aware of their hearing difficulty it takes on average 4 to 5 years for them to schedule a visit with a hearing care professional, and in some cases an additional 6 years to obtain a hearing aid (Figure 3).

Figure 1. Hearing difficulty rates from 1989 to present, as reported by MarkeTrak surveys.
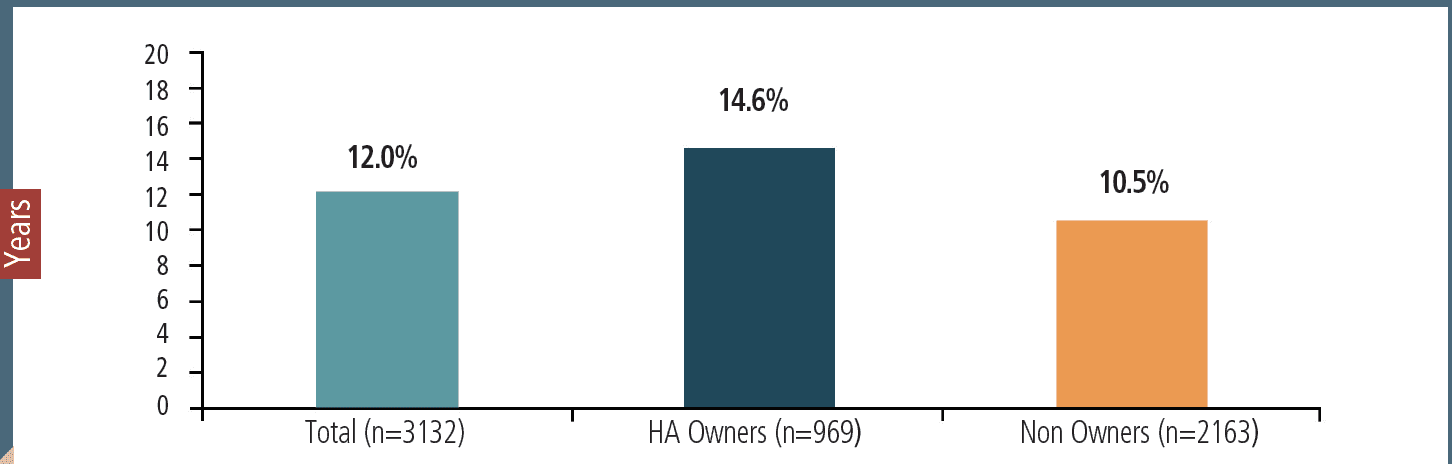
Figure 2. Number of years respondents were aware of hearing difficulty (total respondents and hearing aid owners and non-owners).
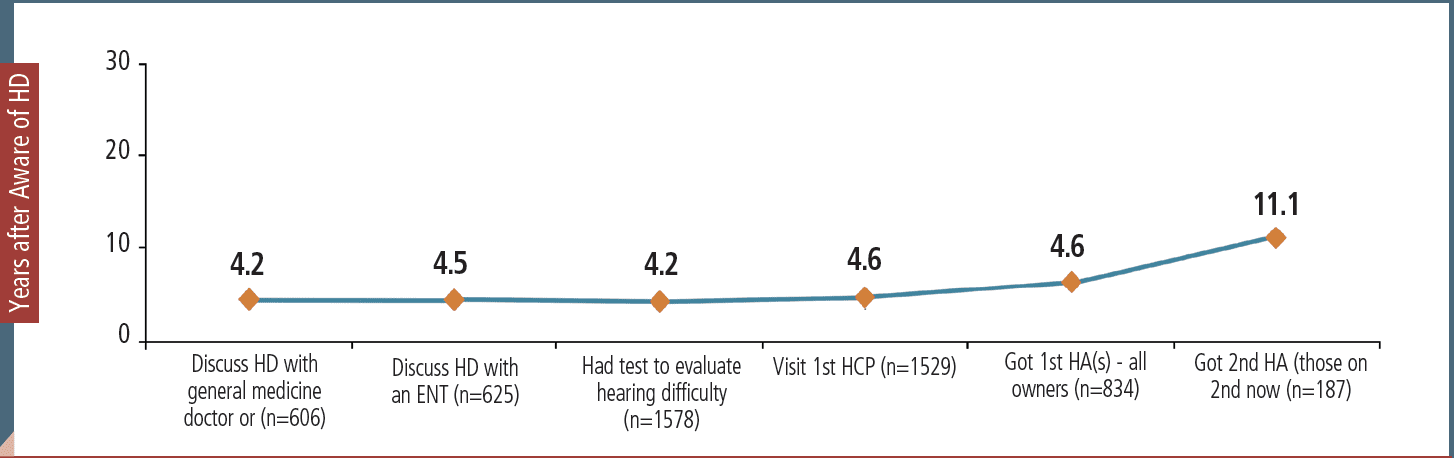
Figure 3. Average number of years for each step required in the customer journey to obtain hearing aids after awareness of hearing disability (HD).
For those who do not obtain hearing aids (non-owners), their journey is different than those of owners. Non-owners don’t move to the next stage of hearing assistance for a variety of reasons: they believe that they can hear well enough in most situations; they feel that hearing aids are too expensive; they have other priorities; or they have no coverage/insurance that will assist with acquiring hearing aids. For others, the old stigma about hearing aids still prevails; hearing aids can be perceived as being large and bulky, and/or not provide enough benefit in challenging listening environments to warrant the time and money to obtain them.
Hearing Aid Owners
One of the closely followed outcomes of MarkeTrak is the hearing aid adoption rate. The MT10 results shows that 3.7% of all individuals reporting hearing difficulty own hearing aids. This equates to an adoption rate of 34.1%—an increase from 30.2% reported in MT9 (Figure 4). Although MT10 did ask specific questions about PSAP ownership, the MT10 definition of a hearing aids emphasizes the channel of acquisition (eg, obtained through a hearing care professional) and therefore the reported adoption rate is based on hearing aid ownership.
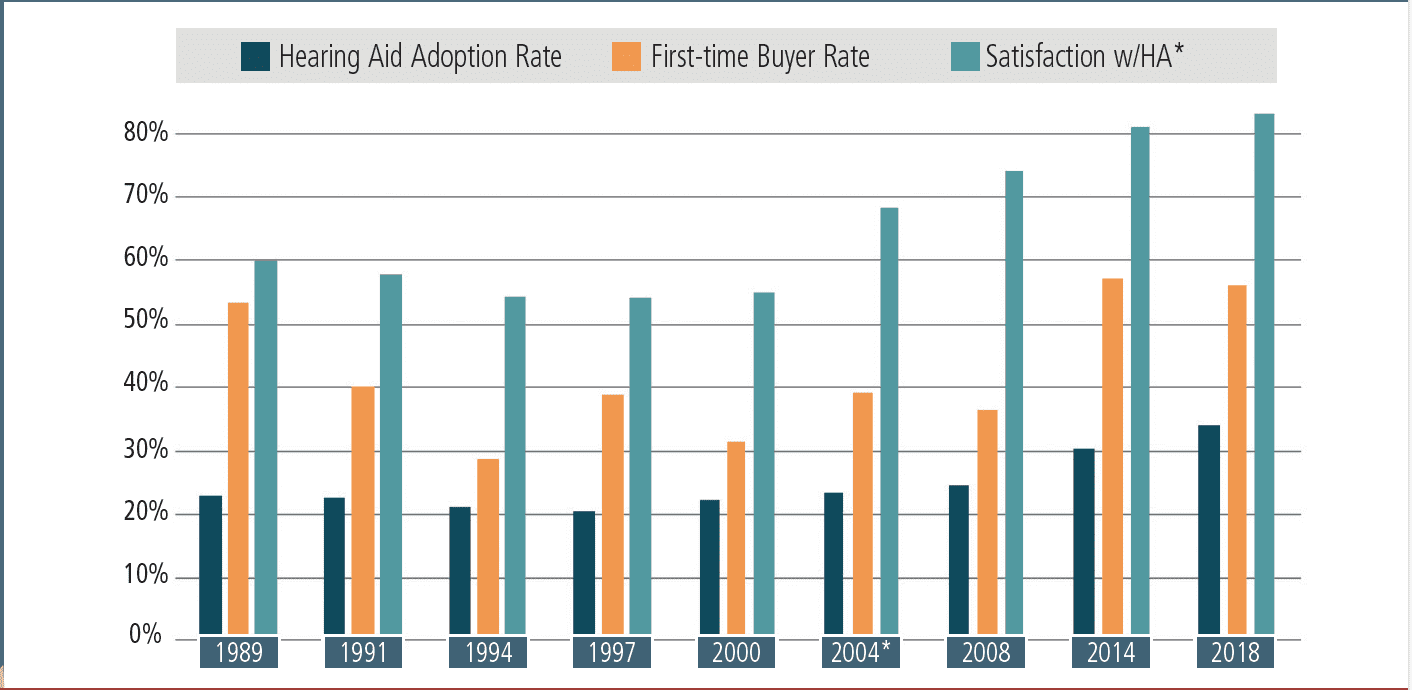
Figure 4. Hearing aid (HA) adoption rate, first-time buyer rate, and hearing aid satisfaction rate in MarkeTrak surveys. *The hearing aid satisfaction question was changed in 2004 from a 5-point to a 7-point Likert scale to include “somewhat satisfied” and “somewhat dissatisfied.”²
Another interesting finding revolves around the first-time buyer rate. This has fluctuating over past surveys from 37% in 2008 to 57% for MT9. The responses in MT10 indicate the first-time buyer rate has remained high at 56% in 2018, certainly a positive trend (Figure 4).
For those who seek help for their hearing loss, the path forward usually involves a hearing care professional. Almost all owners (96%) report they have had a “formal” hearing test, while about 70% of non-owners report having a hearing test (Figure 5). The use of an online or app-based hearing test is still very minimal (4-7%), and has not increased from the data reported in MT9. However, many expect an increase in the use of online and app-based hearing tests once the final OTC regulations are released by the US Food and Drug Administration (FDA) by YE2020, if not sooner.
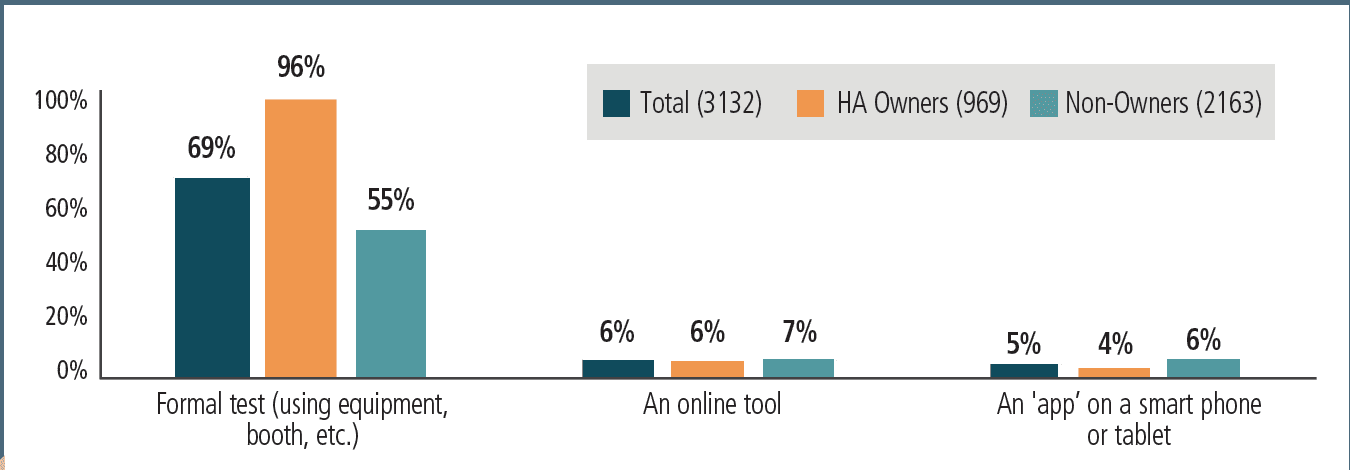
Figure 5. Types of hearing tests reported by hearing aid owners and non-owners.
Recommendations from the hearing care professional are a critical component in the decision pathway for the patient to seek help for their hearing loss. However, many hearing care professionals do not make a recommendation to explore hearing aids, even with the presence of a hearing loss (Figure 6). This is a critical aspect of moving the hearing-impaired consumer through their journey, as we know that this recommendation is an integral step in trying and accepting amplification.
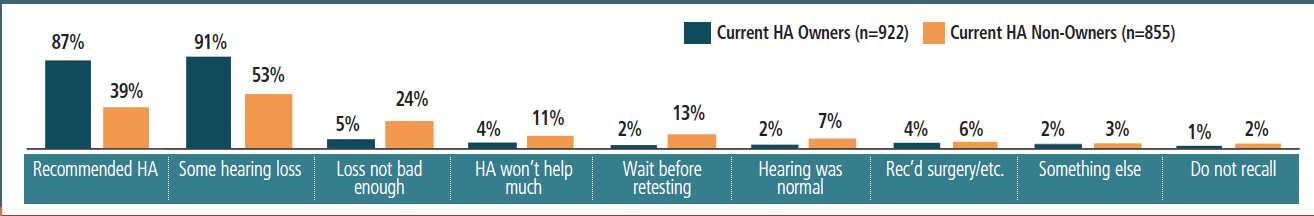
Figure 6. Recommendations from hearing care professional after visit for evaluation.
For owners of hearing aids, satisfaction with their devices and their hearing care professionals remains high. The satisfaction rate for hearing aids has increased from 74% in 2008 to 81% in MT9 (2014), and is now 83% for MT10 (see Figure 4). Since 2004, the satisfaction rating has been based on a 7-point scale with the top-3 ratings (scores of 5-7) combined to form the overall satisfaction rate.2 Current hearing aid owners are also very satisfied with their interactions with hearing care professionals, with the top-3 satisfaction rate at 94%. Among the factors contributing to this rating are the hearing professional provided realistic expectations of what hearing aids can do; they considered the needs and abilities of the patient; and they addressed their concerns during the evaluation phase.
Non-owners
As shown in Figure 7, non-owners cite a variety of reasons for not moving forward to seek treatment/assistance for their hearing difficulty. When we look at the both groups of non-owners, the top-4 reasons cited are: hear well enough; can’t afford; too expensive; no coverage. This would indicate that three important drivers of action on obtaining hearing help would be expanded insurance coverage, additional information on the benefit of amplification, and the range of costs for hearing aids.
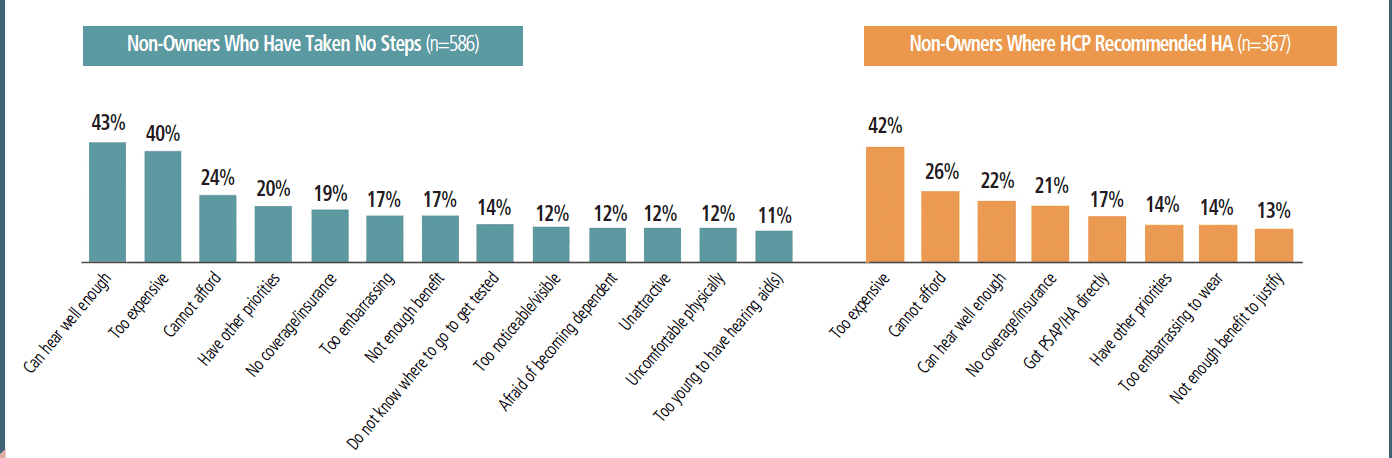
Figure 7. Top reasons for not progressing on hearing aid journey.
PSAPs
Although PSAPs (in various forms) have been around for decades, consumers are generally less familiar with them than hearing aids, and the devices may often be purchased for situational listening (more about this below). Thus, it is not surprising MT10 found the average age of these devices was 3.4 years, compared to 4.2 for hearing aids. Figure 8 shows that consumers who have purchased PSAP devices within the past year have satisfaction ratings (top-3 ratings, scores of 5-7) comparable to those of owners of devices that are over 2 years old. However, consumers with older devices (>2 years) have significantly lower satisfaction ratings (Figure 8).
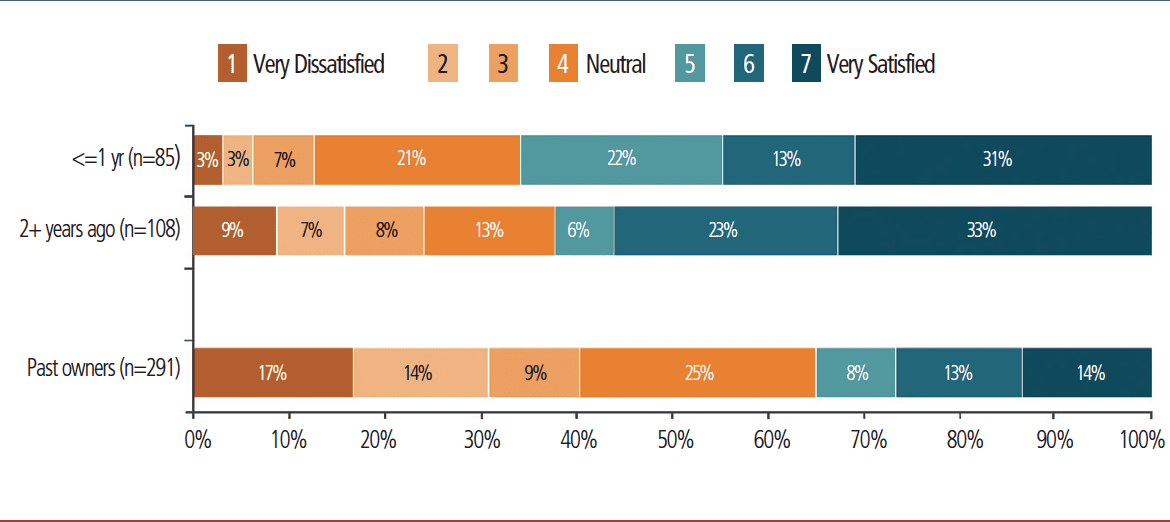
Figure 8. Overall satisfaction of PSAP owners by age of device.
PSAP owners are mixed on what they think their device should be called (Figure 9). About 40% identify their product as a hearing aid and 40% refer to it as an amplifier. Approximately 20% of them are not sure how to classify the device. Given the expanding sales channels in the amplification market, it may be that some of these devices are actually hearing aids that are being sold either as PSAPs or through DTC distribution. It is unclear whether the OTC channel will create greater confusion about these devices or provide better guidance on what these devices should be called.
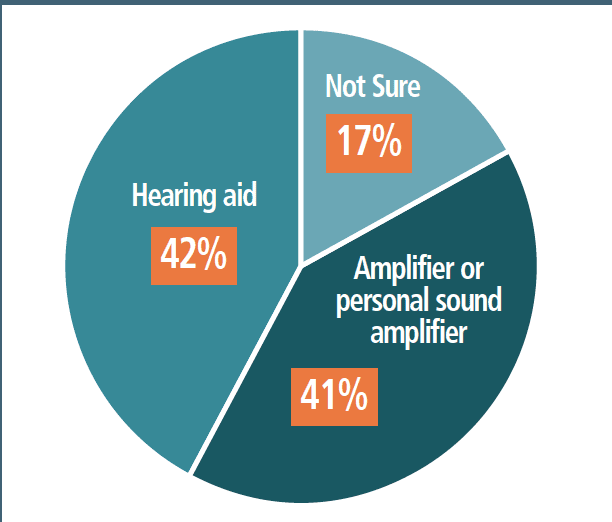
Figure 9. Device identification by PSAP owners (n=193).

Figure 10. Place of purchase by PSAP owners.
The point of purchase for these devices cuts across a variety of internet websites, including Amazon, specific manufacturer sites, and big- box stores (Figure 10). For those devices purchased from a store, the most-cited locations included drugstores and electronics retailers.
When asked about the listening situations where they use their PSAP devices, the top three environments were: at home watching TV (64%), at home when communicating (63%), and at restaurants (42%).
The motivation to purchase a PSAP device centered around lifestyle issues, with the most common responses: tired of asking people to repeat, they felt “ready” to do something about their hearing problem, had a life experience that reinforced the need, or a life change event (family, job, etc).
It appeared that, in some ways, PSAP owners were similar to hearing aid owners in that they reached a point in the hearing journey when they were ready to take action. However, instead of seeking a professional for that help, they obtained their device on their own. Previous MarkeTrak data has shown high satisfaction rates for hearing care professionals reported by owners of hearing aids (ie, 94% in MT10). It is not clear if PSAP owners were aware of the significant role hearing care professionals play or simply elected to obtain devices without their assistance.
As previously mentioned, MT10 asked a series of questions directed at previous purchasers of PSAP devices to gain insights into what may be a changing environment for hearing healthcare. One of the more intriguing set of questions assessed perceptions of the changes and opportunities associated with the pending OTC legislation. The participants in the survey were informed about the impending change to allow OTC purchase of hearing aids, and that these purchases would be made without the assistance of a hearing care professional. The six areas examined were: assessing your hearing loss; selecting an appropriate hearing aid; getting started using the device; using the features to adjust the device; cleaning/maintenance; and trouble shooting.
As shown in Figure 11, a small minority (14% to 24%) were very comfortable taking on the tasks that would be required for an OTC purchase. The least comfortable task was troubleshooting, followed by assessing their own hearing, and selecting an appropriate hearing aid. The area that respondents showed the most comfortable rating was the cleaning and maintenance tasks. It is assumed that the cleaning/maintenance task was the most familiar as many in this group owned a PSAP device. However, hearing care professionals might be quick to point out the potential longer-term problems caused by earwax and debris that often require a visit to a practice.
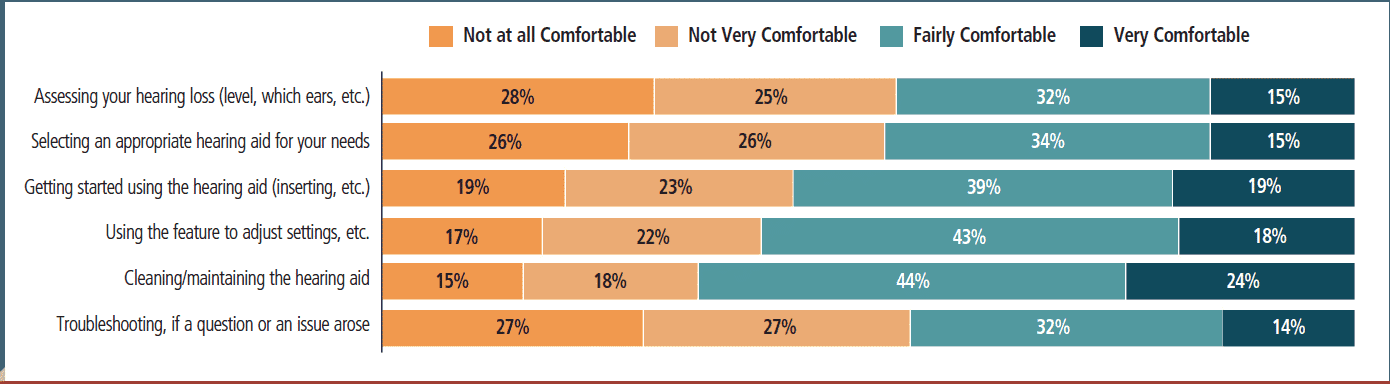
Figure 11. Comfort level for tasks associated with OTC from all respondents with hearing difficulty (n=3113).
Hearing Aid Owners vs PSAP Owners
When comparing the satisfaction of all owners and past owners, the differences between hearing aid and PSAPs become clearer. Most of the comparisons have at least a 20% difference, with the exception of the price paid (Figure 12).
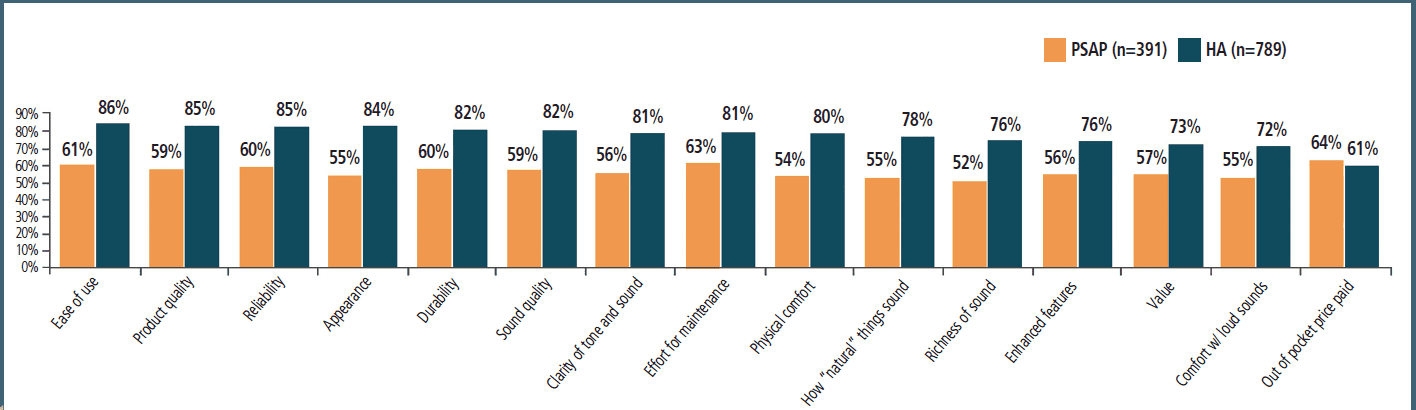
Figure 12. Comparison of satisfaction by amplification product for all current and past owners of hearing aids and PSAP’s.
Some of the most interesting findings were the answers to the questions relating to the use of the OTC option by both hearing aid owners and non-owners (Figure 13). Their responses certainly support the idea that OTC will have at least some impact on the current hearing aid market.
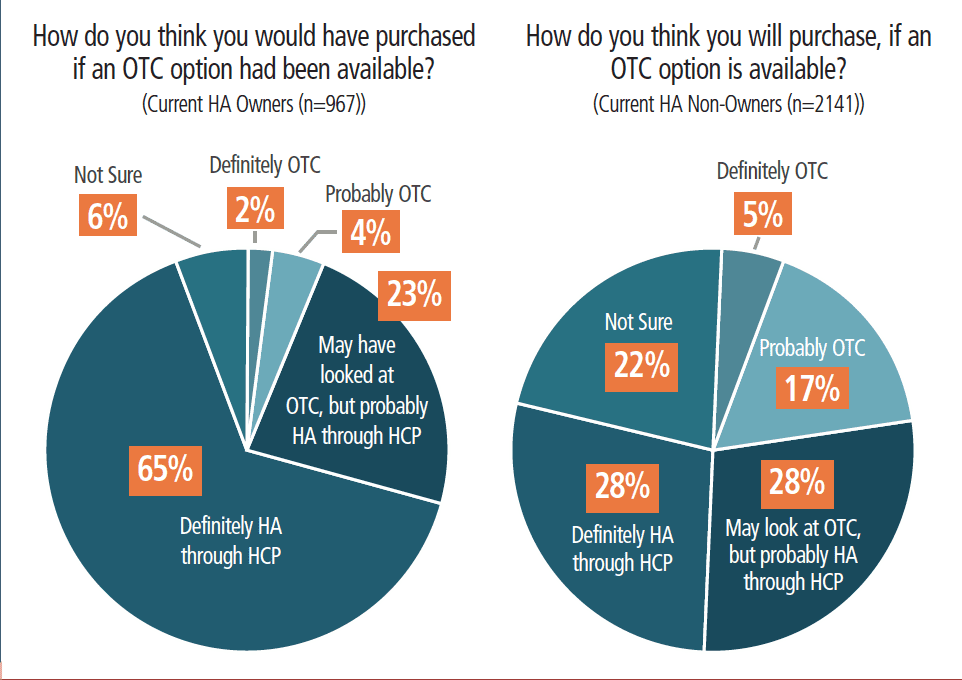
Figure 13. Use of the OTC purchase option for hearing aid owners (left) and non-owners (right).
Conclusions
This is not a time when any party involved in hearing healthcare can remain complacent. Change is happening every day, with much more coming in the months and years ahead. When taking the overall picture from MT10 into account, it is clear that one of the most important findings is the need to educate consumers about hearing loss and the impact on their lives and their health. An education and awareness campaign from HIA is sending the message that maintaining hearing health keeps us vital so we can enjoy the things we love most (www.hearwellstayvital.org).
The results from the owners of hearing aids indicate that a discussion with a hearing care professional and the explanation of their test results resulted in them taking action to seek help. Further, many hearing-impaired individuals mentioned that discussion with their hearing care professional on the co-morbidities associated with hearing loss, memory issues, balance, tinnitus, and cognition provided additional motivation to seek help.
These results indicate that the role of the hearing care professional is very important to those owners who took advantage of the services provided. It is unclear how the new OTC products/channel will use this resource—or will consumers navigate this new customer journey by themselves?
As the market moves towards the availability of OTC hearing aids, there is a need for extensive consumer information campaigns on the availability and use of OTC and DTC devices. In addition, hearing healthcare professionals need to become better informed about the new realities of the market: in particular, the risk/benefit of these new DTC or OTC products, and how to guide their patients on making choices for their hearing health.
The extensive data in MT10 explores the differences between owners and non-owners of hearing aids. It also explores a variety of areas of the current hearing care delivery system, including: satisfaction with hearing care professionals; satisfaction with hearing devices; satisfaction while listening in a variety of environments; and which features are most important and useful. MT10 also includes detailed data about the cost of the devices and source of insurance/third party coverage. These will be discussed in depth in a publication in the fall edition of Seminars in Hearing.
Acknowledgement
Funding for the MarkeTrak survey was provided by the Hearing Industries Association (HIA) and its members. The authors thank Jan Kihm, president of AzMarketing Research, St Paul, Minn, and her colleagues for their work on data collection and analysis of the survey.


Thomas A. Powers, PhD, is Managing Member of Powers Consulting based near Piscataway, NJ, and is a consultant to the Hearing Industries Assn (HIA), Washington, DC. Carole M. Rogin is Strategic Advisor and the retired President of the HIA.
Correspondence can be addressed to HR or Dr Powers at: [email protected]
Citation for this article: Powers TA, Rogin CM, MarkeTrak 10: Hearing aids in an era of disruption and DTC/OTC devices. Hearing Review. 2019;26(8):12-20.
References
1. Abrams HB, Kihm J. An introduction to MarkeTrak IX: A new baseline for the hearing aid market. Hearing Review.2015;22(6):16-21.
2. Kochkin S. MarkeTrak VII: Hearing loss population tops 31 million. Hearing Review. 2005;12(7):16-29.