|
| Patricia Gaffney, AuD, is currently an assistant professor at Nova Southeastern University. Previously, she was a clinical audiologist at the Miami VA Medical Center. |
Datalogging is a feature that has recently become popular in hearing instruments and is being utilized by most major manufacturers in the United States. The most simple datalog systems report the average hearing aid use, as well as the use of different programs. More sophisticated systems can also track and apply volume control changes, activation of noise cancellers, and battery use. Some systems can even give recommendations for how to improve the hearing instrument settings.
The information provided by the datalogging can be effectively used for improved programming and trouble-shooting; however, an equally important aspect of datalogging is the chance to finely tune hearing aid counseling for the user based on their individual use data. The primary purpose of this study was to examine how new and previous Veterans Affairs (VA) hearing aid users report hours of use compared to the hearing aid datalogged results. Hours of use and listening time in quiet and noisy environments (as reported by the participants and the datalog) were also investigated. A final area of interest was to compare the findings of the datalogging to a self-assessment outcome measure following real-world hearing aid use.
Methods
The hearing aids used in this research were the Phonak Savia, Savia Art, and Eleva. These hearing aids classify sounds from the environment by using acoustic scene analysis to make a decision regarding how to adapt the hearing aid response by activating different features, such as directional microphones, noise cancellers, multi-band compression, and active feedback cancellation.1 Autopilot, in the Savia and Savia Art, and Tripilot, in the Eleva, are multi-based programs that analyze the incoming signal and use the acoustic scene information to switch automatically between different listening bases (modes). The Autopilot program has four primary modes: 1) calm (speech in quiet); 2) speech in noise; 3) comfort in noise (noise alone), and 4) music. In the instrument, Autopilot is considered one program; however, each of the modes is able to be programmed independently of one another. Tripilot is similar to Autopilot, except that it has only the three modes: calm, speech in noise, and comfort in noise (no music mode).
|
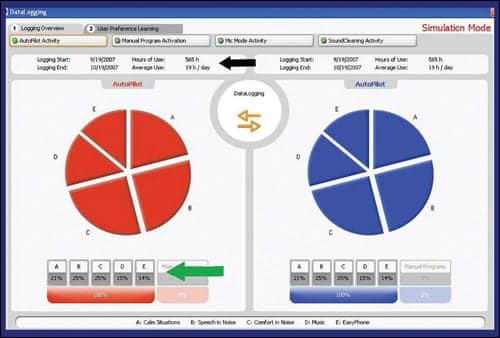
| FIGURE 1. Display of Phonak datalogging. The screen print shows total hours of use and average use per day (black arrow) and the percentage of time in each Autopilot program is displayed in the pie chart and at the bottom (green arrow). |
The Phonak datalog reports the total hours of use and an average daily use estimate for each ear (Figure 1). Autopilot and Tripilot data are shown in a pie graph with the percentage of time each hearing instrument is in each base (calm, speech in noise, etc).
A total of 40 participants (39 male, 1 female; ages 49 to 86, mean age = 70) from the Miami VA Healthcare System were the study subjects, with half being new hearing aid users and half being previous hearing aid users (ie, 20 people per group). Inclusion into the study was open to all VA patients who were fitted with the Phonak hearing aids. Degree of hearing loss was not a factor since the focus of the study was reported use versus the datalog. Informed consent was completed at the end of the hearing aid fitting appointment.
All participants were using the Phonak Savia (n = 33), Savia Art (n = 5), or Eleva (n = 1) hearing instruments, and all the devices contained directional microphones. Phonak instruments were used because of the information contained in their datalog report and clinic fitting preference of the time. A total of 21 participants wore custom hearing aids (In-The-Canal, Half Shell, or In-The-Ear), 12 wore behind-the-ear (BTE) hearing aids, and 6 wore microBTE hearing aids. Hearing aids were programmed to the manufacturer’s Autopilot/Tripilot preference default settings. One previous user’s data was removed from the analysis because he could not properly complete the expected task of opening the battery door when the hearing instrument was not in use.
The participants wore the instruments for 2 weeks immediately following the hearing aid fitting. They did not have knowledge of the datalogging feature. Upon their return to the clinic, the datalogging results were read.
Participants were asked a series of questions regarding their hearing aid use in an interview format (“reported data”). The questions related to hearing aid use included:
- How many days a week are you wearing your hearing aids?
- How many hours a day are you wearing your hearing aids?
- If you have two hearing aids, are you wearing them equally?
- What percentage of time do you think you were wearing them in a fairly quiet environment?
- What percentage of time do you think you were wearing them in a noisy environment?
- The hearing aid changes based on your listening environment. Can you tell that the hearing aid changes and do you feel that it switches appropriately?
The participants were also given a self-assessment inventory. The International Outcome Inventory for Hearing Aids (IOI-HA)2 was used to evaluate perceived hearing aid success compared to hearing aid use. The IOI-HA contains seven questions assessing seven different domains of hearing aid success including: hearing aid use, benefit, residual activity limitation, satisfaction, residual participation restrictions, impact on others, and quality of life. The IOI-HA was administered using a pen and paper format.
Results
Most participants were fitted bilaterally; however, datalogging information was used from only one ear. Data from the right ear was used unless the patient was fit with the left ear only, or in the event they did not wear the right hearing aid (eg, poor physical fit).
|
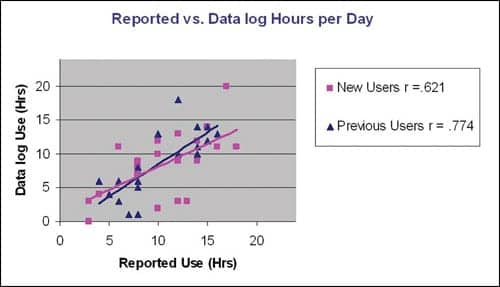
| FIGURE 2. Reported versus datalogging hours of use, with the new users represented by purple squares and the previous users by dark-blue triangles. The total group (r = .687) and the individual groups are significantly correlated (p < .01). |
|
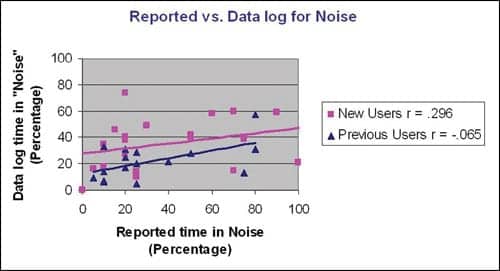
| FIGURE 3. Reported versus datalogging percent of time in noise (group r = .218). |
Hours of use. The total group of participants (n = 39) reported an average use time of 10.5 hours while the datalogging showed an average use time of 8.6 hours, an overestimation of 1.9 hours. Datalogging revealed that the new user group had the average of 8.6 hours, and the previous user group had a slightly higher average of 8.7 hours of use. Pearson correlation shows a significant correlation (r = .687, P < .01) for the group reported and datalogged hours of use (Figure 2). Both groups individually show strong correlations between the reported and datalogging hourly use (new users r = .621, P < .01; previous users r = .774, P < .01).
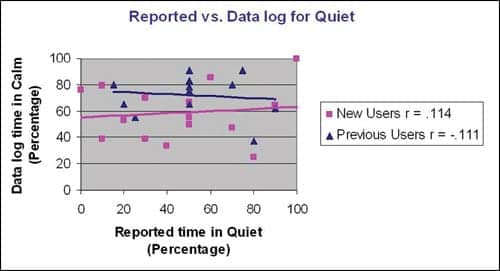
Quiet versus noise. During the interview, participants provided an estimated percentage of the time spent in what they considered quiet and noisy listening environments. Datalogged estimates of time in quiet and noise were obtained from the fitting software. The “calm” mode was used as the equivalent of quiet, and “speech in noise” and “comfort in noise” were combined to be considered a noisy listening environment. The reported time in noise compared to the datalog information for “speech in noise” and “comfort in noise” was not significant for the group (r = .218) or for either of the individual user groups (Figure 3). Reported time in quiet compared to the datalog for “calm” was not significant for either the total group (r = .073) or any individual group (Figure 4).
The average reported time in quiet and noise is 55.17% and 34.32%, respectively, while the average datalogged time in quiet and noise is 66.15% and 28.30%. Of the datalogged information, the average time in the speech in noise base with directional microphones activated is 15.51%. When asked if they felt that the aid switched programs appropriately, 20 of the 39 participants (51.3%) felt that it did, 17 participants (43.6%) did not know if it switched appropriately, while 2 (5.1%) thought that the aid did not switch appropriately. There is a significant correlation (r = 0.33, P < .05) between the amount of datalogged hours of use and if they felt it switched appropriately.
|
| FIGURE 4. Reported versus datalogging percent of time in quiet, group r = .073. |
|
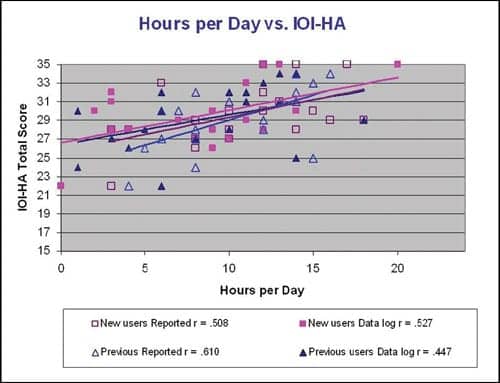
| FIGURE 5. Hours of hearing aid use (reported and datalogged) with the total score of the IOI-HA. The results suggest that the participants who are wearing their hearing instruments more perceive a higher degree of success. |
Fitting success and hours of use. Hours of use, both reported and those obtained via datalogging, were compared to a subjective measure of hearing aid success through the results of the IOI-HA (Figure 5). The total score on the questionnaire was significantly correlated with the group reported hours (r = .554, P <.01) and with the group datalogged hours of use (r = .485, P <.01). These results suggest that the participants who are wearing their hearing instruments longer perceive a higher degree of success.
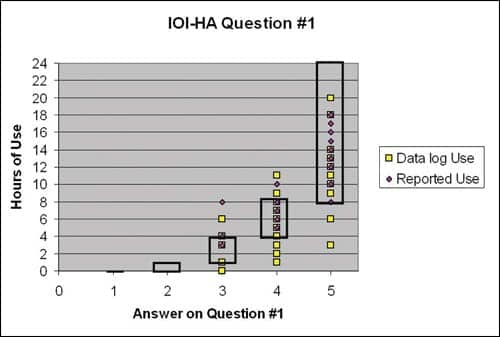
The first question on the IOI-HA specifically asks about hours of use. A total of 36 of the 39 participants (92.3%) showed consistency between their answer on the IOI-HA and their reported hours of hearing aid use. As shown in Figure 6, when comparing the answers on this question to the datalogged findings, 29 out of 39 (74.4%) showed consistency between the answer on the IOI-HA and the average daily use (3 where the datalogging showed more hours than that reported on the IOI-HA, and 7 where the datalogging showed less hours than that reported on the IOI-HA).
|
| FIGURE 6. Hours of use (reported and datalogged) with answer on Question #1 of the IOI-HA, which asks about hours of use. The boxes show the range associated with Question #1. Twenty-nine of the 39 participants (74.4%) showed consistency between the answer on the IOI-HA and the average daily use. |
Discussion
The participants of this study were fairly accurate at estimating their hours of use when compared to the datalogging findings, with a slight tendency to overestimate their hearing instrument usage. This is consistent with previous research on reported hearing aid use compared to an internal datalog, which also showed that participants had a tendency to overestimate use.3,4 Reported behaviors of patients are often inaccurate when compared to an objective measure, and this phenomenon reaches well beyond audiology and hearing aids. For example, Wang et al5 reported that VA patients significantly overstated the number of times they filled their prescriptions versus the number of refills completed by the pharmacy.
This study also examined reported listening environment compared to the hearing aid’s automatic switching between programs for quiet and noise. The participants’ reports of time in quiet and noise did not agree as closely with datalogging as the estimation of hourly use. However, this finding is not surprising; it is easier for a patient to estimate the amount of time they are using their hearing instrument, but classifying listening environments is more difficult—particularly since the concepts of quiet and noise are highly individualized.
Classifying an acoustic environment into a single category can be difficult to humans and devices alike. The hearing aid makes decisions based on specific programmed rules using environmental cues. In contrast, the patient may classify the signal or environment based on their personal preferences or attention level.
Research over the years has consistently shown a positive correlation between hearing aid success and reported hours of use. Walden and Walden6 used the IOI-HA as a measure of success. In their research, they also found a significant correlation between reported hours of use and higher scores on the IOI-HA for satisfaction and benefit.
Previous research relied on reported use and not objective measures of use, such as a datalogging. As datalog research has shown, patients tend to overestimate hearing aid use, so it is important to examine both reported hearing aid use and datalog estimates of use in future research.
Humes et al3 compared the reported and datalogged hearing aid use to participant satisfaction and found significant correlations. Fabry7 reported results from an internal investigation at Phonak of 80 hearing aids in which they found a difference in hourly use for hearing aids that were returned for credit (average 5.8 hours) and those sent in for repair (average 12.1 hours) consistent with previous research.8
One caveat of datalogging is that it is measuring only the time the hearing aid is on and not necessarily the time that it is in the patient’s ear. One of the previous users in this study is a prime example of this. The participant reported 2 hours of daily use while his datalogging showed 23 hours, suggesting he failed to open the battery door (ie, causing an artificially inflated average). As previously stated, his data was removed from the analysis.
Conclusions
The popularity and sophistication of hearing instrument datalogging are expected to increase with time and are quickly becoming an integral part of hearing aid follow-up information. The objective analysis afforded by the datalogging can provide the clinician with information to more effectively program hearing aids and counsel the patient; however, the clinician is ultimately responsible for knowing how to use that information appropriately—particularly when there is a discrepancy between the user report and the datalogging.
Datalogging can have a significant role in the VA system. The VA is now considered the third most common place to obtain hearing aids in the United States, growing quickly over the past several years from 4.5% of the market in 1997 to 14.9% of the hearing aid market in 2004.6 Many VA resources are being pushed to the limits, and this is expected to increase with time due to the aging Baby Boomer population and the returning war veterans.
Datalogging can provide important information regarding hearing aid use, particularly when not all patients can be scheduled for follow-up appointments or cannot accurately describe their hearing aid use. In the future, datalogging has the potential to become a helpful factor in determining individual needs for new or different amplification.
Disclosure and Acknowledgments
This project was unfunded and was not financially supported or endorsed by Phonak Hearing Systems. The author thanks the Miami VA Audiology and Speech Pathology Service for their help and support, and David Fabry, PhD, for his technical support.
References
- Fabry DA, Tchorz J. Results from a new hearing aid using “acoustic scene analysis.” Hear Jour. 2005;58(4):30-36.
- Cox RM, Alexander GC, Beyer CM. Norms for the International Outcome Inventory for Hearing Aids. J Am Aud Audiol. 2003;14:403-413.
- Humes LE, Halling D, Coughlin M. Reliability and stability of various hearing-aid outcome measures in a group of elderly hearing-aid wearers. J Speech Hear Res. 1996;39:923-935.
- Taubman LB, Palmer CV, Durrant JD, Pratt S. Accuracy of hearing aid use time as reported by experienced hearing aid wearers. Ear Hear. 1999;20:299-305.
- Wang PS, Bohn RL, Knight E, Glynn RJ, Moqun H, Avorn J. Noncompliance with hypertensive medications: the impact of depressive symptoms and psychosocial factors. J Gen Intern Med. 2004;17:504-511.
- Walden TC, Walden BE. Predicting success with hearing aids in everyday living. J Am Acad Audiol. 2004;15:342-352.
- Fabry DA. I, Robot: Self-learning hearing aids. Paper presented at: American Academy of Audiology AudiologyNow annual convention, Denver; April 2007
- Kochkin S. MarkeTrak VII: Hearing loss population tops 31 million people. Hear Review. 2005;12(7):16-29.
Correspondence can be addressed to [email protected] or Patricia Gaffney, AuD, at .


