Implementation of newborn infant hearing screening programs across the country has had the fortunate effect of identifying more hearing-impaired children. This enables pediatric dispensing clinicians to fit hearing aids to children at an even younger age. Additionally, the advent of more sophisticated hearing aid technology has created challenges when making decisions about which hearing aid features to select. The fundamental choice, however, should include features that enhance (or at least preserve) consistent audibility while ensuring an optimal signal-to-noise ratio (SNR).
Some advanced features have demonstrated general acceptance. Examples include wide dynamic range compression (WDRC) processing, low compression threshold (CT), multiple channels, and effective feedback cancellation systems. These hearing aid features ensure audibility. In a recent survey directed at ASHA members with special interest in hearing and hearing disorders in childhood, 87% of respondents indicated that they primarily choose WDRC for children under 5 years of age, and 44% use an adaptive feedback suppression system.1 (For more details on the specific features relevant to successful pediatric fittings, the reader is directed to Kuk and Marcoux.2)
However, the use of some advanced features does not have universal endorsement. Specifically, noise reduction and directional microphone systems designed to enhance comfort and/or intelligibility in noise are more controversial for pediatric applications. Because a noise reduction algorithm reduces gain in “noise,” and a directional microphone reduces its sensitivity to sounds at directions other than 0° azimuth, these algorithms may deprive a child of incidental learning (ie, “overhearing” opportunities). In the worst-case scenario, these features could impact communication and language development.
In identifying research needs, both the American Academy of Audiology3 and Centers for Disease Control and Prevention–Early Hearing Detection and Intervention Program4 suggest the need for developmental outcome data for children using different types of technology—and specifically noise reduction and directional microphone systems. In response, this article reports on longitudinal speech/language outcomes for a group of 49 children fitted with advanced hearing aids with noise reduction and fully adaptive directional microphone systems.
A Multisite Clinical Research Project on Pediatric Amplification
Study Participants
- Arkansas Children’s Hospital, Little Rock, AR
- Cincinnati Children’s Hospital, Cincinnati, OH
- Hearing Health Center, Chicago, IL
- House Ear Institute, Los Angeles, CA
- Integris Baptist Medical Center, Oklahoma City, OK
- Kansas University Medical Center, Kansas City, KS
- Long Island Jewish Medical Center, New Hyde Park, NY
- New England Center for Hearing Rehabilitation, Hampton, CT
- Oakland Children’s Hospital, Oakland, CA
- University of Miami Medical Center, Miami, FL
TABLE 1. Facilities providing speech, language, and hearing services to children in this study.
In 2001, Widex initiated the Pediatric Hearing Assistance Program (PHAP) to enable children from families with limited financial means to have access to advanced hearing aid technology. The initial stage of the program recruited pediatric dispensing clinicians from around the country to fit hearing aids donated by Widex. The clinicians provide in-kind fitting and follow-up services to these children. In addition, they follow the children longitudinally and submit post-fitting speech, language, and hearing outcomes to Widex.
Participants. Participants were 49 children enrolled in the PHAP between ages 2 weeks and 13 years and for whom longitudinal speech/language data are available. Participants received services and follow-up at 10 facilities throughout the country. The facilities (Table 1) selected children from families with limited financial means, but the criteria on financial suitability varied among facilities.
There were 25 males and 24 females in the group. A total of 25 children were younger than 5 years and 24 were older than 5 years when they enrolled in the PHAP. Information on the age of hearing loss identification was available for 64% of the children. Of those, one quarter were identified via newborn hearing screening programs, 13% were identified before 6 months of age, and 19% were identified by 1 year. The older group (>5 years) included more late-identified children, including five identified at age 2, one at age 2.5 years, three at age 3, one at age 4, and four at age 6.

|
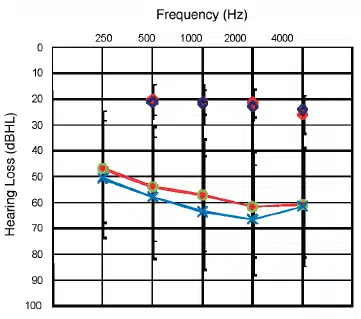
| FIGURE 1. Averaged audiograms and aided soundfield thresholds (right and left ears) for the 25 children enrolled in the study younger than age 5, with aided soundfield thresholds represented by open diamonds. |
Medical histories and etiologies are varied and include meningitis, CHARGE syndrome, Waardenburg Syndrome, Crouzon’s Syndrome, EVA, Connexin 26, CMV, cerebral palsy, traumatic brain injury, kidney disease, and chemotherapy. Information relative to the level of functioning was available for 82% of kids, and the majority functioned at age-appropriate levels and were mainstreamed in education settings. However, 12% were either in special classrooms or received special education services. The majority utilized only oral communication methods, but a total communication approach was employed for a few (9%) children. Speech therapy for most of these children was administered using an auditory-oral approach one to two times per week. Eighteen percent (18%) of children were enrolled in auditory/verbal therapy programs. The averaged audiogram for each group is displayed in Figures 1 and 2.
|
| FIGURE 2. Averaged audiograms and aided soundfield thresholds (right and left ears) for the 24 children enrolled in the study older than age 5, with aided soundfield thresholds represented by open diamonds. |
Procedures and Assessment of Language Progress
Hearing instruments. Hearing aids fitted were the Widex Senso Diva SD9M and SD19M BTEs, with the SD19M being a more powerful instrument. These are 15-channel digital hearing aids with an in-situ threshold measurement capability, low CT (ie, potentially as low as 0 dB HL), five-stage input-output characteristics operating with adaptive (but primarily slow-acting) compression. The feedback cancellation system in the hearing aid operates independently in 15 channels and has been documented to provide as much as 10 to 12 dB additional gain.5 Average aided thresholds ranged between 20 and 30 dB HL from 250 Hz to 4000 Hz (Figures 1-2).
The Senso Diva instruments are dual-microphone fully or automatically adaptive directional systems. In addition, they utilize a noise reduction (NR) mechanism. When enabled, both of these features operate with built-in “safety features” designed to preserve audibility. The NR algorithm is triggered only above a conversational level,6 and it operates with long time-constants. When NR is triggered, it functions independently in each of the 15 channels, and the effect is graded depending upon the level of the noise and SNR of the environment. In addition, a speech intensification system (SIS) reduces less gain in the mid and high frequencies where speech intelligibility cues dominate for the same signal-to-noise ratio.5
Additionally, even when the directional microphone is active (resulting in reduced microphone sensitivity), the low CT of the Diva hearing aid ensures that the audibility of the soft sounds from azimuths other than 0° is minimally compromised. Further, the activation threshold of the adaptive directional microphone is above 55 dB SPL. This suggests that the adaptive microphone will remain in an omnidirectional mode even for soft speech presented from the sides or back. (Results of a study on the Diva Locator directional system are found in Kuk et al.7,8)
Hearing aid input/output characteristics were determined using the Sensogram in situ threshold measurement wherever possible. This ensures an accurate threshold measurement and a precise gain specification. Automatic adaptive directional microphone and noise reduction systems were the default settings for all children to ensure optimal SNR while preserving audibility.
Timeline of data collection. The facilities were encouraged to update assessment data every 6 months for younger children and annually for the older children. Because 10 facilities were involved in fitting and follow-up for these children, the frequency of intervention varied slightly. The schedule of services rendered was determined by the facility providing services and by the needs of the individual child.
| Assessment Tool | Age Range | Description |
|---|---|---|
| Receptive Expressive Emergent Language Test (REEL3) | 0 to 3 yrs | Receptive and expressive language vocabulary, grammar, syntax. Parent/caregiver interview format. |
| Pre-School Language Scale 3, 4 (PLS 3, PLS 4) | 2 wks to 6 yrs | Receptive and expressive language, behavioral precursors to language. |
| Test of Auditory Comprehension of Language, Revised (TACL-R) | 3 to 9 yrs | Receptive vocabulary, grammar, syntax. |
| Comprehensive Assessment of Spoken Language (CASL) | 3 to 21 yrs | Receptive and expressive language |
| Oral & Written Language Scales (OWLS) | 5 to 21 yrs | Receptive and expresive language, vocabulary, syntax, supralinguistic aspects, written expression. |
| Goldman Firstoe Test of Articulation 2 (GFTA2) | 2 to 21 yrs | Spontaneous and imitative articulation of consonants. |
| Carolina Picture Vocabulary Test (CPVT) | 4 to 11 yrs | Receptive vocabulary; designed for deaf and hearing-impaired children. |
| Peabody Picture Vocabulary Test (PPVT III, PPVT III-A and B) | >2 yrs to adult | Receptive vocabulary. |
| Expressive Vocabulary Test (EVT) | >2 yrs to adult | Expressive vocabulary. |
| Expressive One Word Picture Vocabulary Test (EOWPVT) | 2 to 18 yrs | Expressive vocabulary. |
Assessment tools. The goal of the assessments was to evaluate the child’s receptive and expressive lexical, semantic, and pragmatic language structures, as well as higher-order language processes. For this reason, combinations of subtests were administered at the discretion of the examining clinician at each test site and session. Table 2 includes the tools that were used to assess the children’s speech and language performance.
Longitudinal results were available for at least one subtest for each of the 49 children. These materials all utilize a similar standard scoring method with an average Standard Score (SS) of 100 and a standard deviation of 15 points, allowing comparison of a child’s results to his/her age-matched peers.
Longitudinal Outcomes
Results are displayed as a function of time post-fitting. The data for children under age 5 and children enrolled at or over age 5 are reported separately. The majority of test data available is from the Listening Comprehension and Oral Expression subtests of the OWLS and from the Auditory Comprehension and Expressive Communication subtests of the PLS.
|
| FIGURE 3. Longitudinal progress of individual children enrolled who are younger than age 5. Bold red and green lines represent average standard score for receptive and expressive language tests, respectively. |
Figures 3 and 4 display the progress over time of children below age 5 and over age 5, respectively. Each line represents an individual child’s performance via one of the measurement tools in Table 2 at various points in time. The performance is expressed in standard scores for ease of comparison. In the example of a child developing language along a normal course, the standard score will be 100 points (average for the normative population) at time “A.” The score on the same test would remain the same (100) at time “B.” In other words, age-appropriate progress would be represented by a similar score over time. If the scores at various time intervals were connected, a horizontal line would emerge to indicate age-appropriate performance. A negative slope (falling line) would indicate a decrement in performance over time, and a positive slope (rising line) would indicate greater progress than the normally developing peer. In Figures 3 and 4, linear trend lines are drawn where data for multiple visits are available. The bold lines are average trend lines for receptive (red) and expressive (green) subtests for each group.
 |
| FIGURE 4. Longitudinal progress of individual children enrolled who are age 5 or older. Bold red and green lines represent average standard score for receptive and expressive language tests, respectively. |
Progress of children younger than age 5. Baseline performance (ie, test scores at enrollment in the PHAP) indicate that 51% of the scores for the younger-enrolled group are within 2 SD of average performance of the age-matched, normal-hearing population (ie, 85-115). In other words, about half of the scores of the younger group are at or near normal levels to begin with. This percentage increases to 63% postfitting. Additionally, the postfitting scores of 40% of the younger children fall at or above the average standard score (100); the score is the same or better than those of the age-matched, normal-hearing peer. Additionally, the majority of the lines had a rising configuration. This suggests that the language skills of the younger children progress at a faster rate than their normal-hearing peers.
Progress of children older than age 5. Figure 4 shows that the language age of the older children was below their normal-hearing peers at the baseline. However, their rate of progress for receptive and expressive language, after amplification, was accelerated compared to the normal-hearing age-matched peers. This is true even for children who were identified later in life. However, the shallower slopes of the average trend lines indicate that older children experience slower progress than younger children.
Although both groups make progress with advanced hearing aids, the more steeply sloping lines for children younger than age 5 indicate that they progress more rapidly than children older than age 5. The scores of the younger children were higher at the baseline/prefitting, and for the most part improved or were maintained at subsequent postfitting sessions. The scores of the older children, while poorer to begin with, also improved over time albeit at a slower rate.
Statistical analysis. In order to identify when postfitting progress with advanced hearing aids reached the point where it is no different than that of the normative population, one-sample t-tests (Table 3) were performed for each group relative to the average score of normal-hearing children (ie, scores = 100). The statistics indicate that the post-fitting performance on receptive language subtests for the group as a whole reached that of normal-hearing children by 1 year postfitting. Performance on subtests examining expressive language reaches that of normal-hearing children by 1.5 years post-fitting. The total language scores were no different from that of normal-hearing children by 1 year postfitting.
Results for the group of younger children were analyzed separately. The results showed that the scores of this group for both the receptive and expressive language subtests reach that of normal-hearing children by 1 year postfitting. The total language scores were no different from those of normal-hearing children by 6 months postfitting. Because data collection for the older children was performed annually, fewer data points were available to make a similar conclusion for this group.
What’s It Mean? Language Progress of Children with Advanced Hearing Aids
| t | d | Significance (2-tailed) |
Mean Difference |
||
|---|---|---|---|---|---|
| RECEPTIVE | |||||
| All Children | baseline | -6.994 | 33 | 0.000 | -17.487 |
| Month 5 | -3.234 | 14 | 0.005 | -13.333 | |
| Year 1 | -1.622 | 22 | 0.119 | -5.348 | |
| <5 Years | baseline | -4.255 | 19 | 0.000 | -15.500 |
| Month 5 | -2.657 | 12 | 0.021 | -12.077 | |
| Year 1 | -0.303 | 14 | 0.766 | -1.267 | |
| EXPRESSIVE | |||||
| All Children | |||||
| baseline | -6.227 | 35 | 0.000 | -20.181 | |
| Month 3 | -3.226 | 13 | 0.007 | -13.071 | |
| Year 1 | -2.247 | 20 | 0.036 | -9.333 | |
| Year 1.5 | -1.393 | 10 | 0.088 | -9.727 | |
| <5 Years | baseline | -3.750 | 19 | 0.001 | -11.875 |
| Month 3 | -2.573 | 11 | 0.026 | -11.533 | |
| Year 1 | -0.347 | 14 | 0.411 | -4.133 | |
| TOTAL LANGUAGE | |||||
| All Children | baseline | -6.304 | 26 | 0.000 | -18.741 |
| Month 5 | -2.531 | 13 | 0.023 | -12.286 | |
| Year 1 | -1.055 | 16 | 0.307 | -5.000 | |
| <5 Years | baseline | -3.796 | 16 | 0.002 | -15.765 |
| Month 5 | -2.136 | 11 | 0.056 | -11.917 | |
These results indicate that advanced hearing aids improve the speech and language performance of children of various ages. As expected, age of fitting with advanced technology is an important factor affecting language performance. The Standard Scores of younger children are higher, and they experience more rapid improvements compared to older children. It is known that children identified early have better language outcomes than those identified later. In a study of the outcomes of early- and later-identified children, Yoshinago-Itano et al9 found that children whose hearing losses were identified before 6 months of age demonstrated better language development than children whose hearing losses were identified after age 6 months. These results have served as an impetus to increase and develop newborn hearing screening programs, and led to earlier identification of hearing loss.
Another noteworthy observation in this report is that application of noise reduction and automatic adaptive directional systems with well-designed “safety” features does not impede speech and language progress. Rather, the language skills of the children progress at a normal or faster than normal pace.
While this report does not directly address the issue of NR and adaptive directional microphone use, it is reassuring to note that no negative effects have been reported on the use of such features. In the recent survey by Rigsby et al,1 35% of respondents indicated that they chose directional microphones over half the time, and 39% select digital NR features for their pediatric patients. Given the fact that similar advanced features were enabled for all of the children in this study, these outcomes should be reassuring to clinicians. However, clinicians should investigate the nature and type of directional and NR systems in the products they select, as well as their efficacy as they relate to pediatric fittings.
New Processing Solutions
Recently, Widex introduced products utilizing integrated signal processing (ISP) that offer greater processor complexity and more developed pediatric “safety” features. Specifically, in the Widex Inteo hearing aid, the High Definition Locator and the Speech Enhancer features preserve more speech cues than even the directional and NR systems used in the Senso Diva.10-11
The Inteo High Definition Locator is a multichannel, fully adaptive directional system. Potentially, if the listening environment warrants it, a different polar pattern could emerge in each of the 15 discrete channels. This would have the effect of preserving speech cues at frequencies where the SNR is more favorable. For example, in a broadband directional system, such as the Diva Locator, a decrease in microphone sensitivity for a broad range of frequencies occurs even if the offending noise is only in a narrow frequency range. In the Inteo High Definition Locator, the decrease is only in frequency regions where the SNR meets the required criteria.
Additionally, a Speech Preservation feature determines whether speech is dominant in an individual channel, and if it is, the polar pattern remains omnidirectional, regardless of azimuth of the sound source. This has the effect of preserving more speech cues than is possible with a fixed directional system.10 With such a feature, concerns about a loss of sensitivity for speech sounds from azimuth other than 0° would be minimized.
To preserve speech audibility in noise, the Inteo Speech Enhancer feature is designed to optimize the Speech Intelligibility Index12 in noisy environments. The speech enhancer considers the acoustic environment (noise and speech spectra), band importance information, level distortion effects. and the child’s hearing loss in calculating gain settings in each of the 15 channels in order to preserve speech cues. Depending upon the child’s hearing loss and acoustic environments, the gain in some channels could potentially be increased in some noise situations.11 In adults, the Speech Enhancer feature has been shown to improve SNR by 2 to 3 dB when measured using an objective speech-in-noise test.13
Conclusions
Hearing-impaired children enrolled in the Widex PHAP ages 2 weeks to 13 years and fitted with advanced hearing aid technology experienced greater progress on receptive and expressive language measures than the normal-hearing population. Children enrolled at younger ages (<5 years of age) experienced more rapid improvements than children enrolled at older ages (>5 years of age). Total language scores of younger children approximated those of normal-hearing peers by 6 months post-fitting. Results are offered as reassurance to pediatric dispensing clinicians who are concerned that features designed to optimize hearing in noise will negatively impact language development.
Acknowledgement
The authors thank the clinicians from the facilities listed in Table 1 who provide fitting and follow-up services to the children in this program.
References
- Rigsby K, Bradham T, Dickinson W, Mueller G. Current Practices in Pediatric Amplification and Early Intervention. Perspectives on Hearing and Hearing Disorders in Children, ASHA Division 9 Newsletter. 2007; March:3-7.
- Kuk F, Marcoux A. Factors ensuring consistent audibility in pediatric hearing aid fitting. J Am Acad Audiol. 2002;13:503-520.
- American Academy of Audiology. Pediatric Amplification Protocol, October 2003. Available at: www.audiology.org/NR/rdonlyres/53D26792-E321-41AF-850F-CC253310F9DB/0/pedamp.pdf. Accessed June 26, 2007.
- Centers for Disease Control and Prevention. Proceedings of National Workshop on Mild and Unilateral Hearing Loss, Breckenridge, Colo, July 26-27, 2005. Available at: www.cdc.gov/ncbddd/ehdi/unilateralhi.htm.
- Kuk F, Ludvigsen C, Paludan-Muller C. Improving hearing aid performance in noise: Challenges and strategies. Hear Jour. 2002;55(4):34-46.
- Studebaker GA, Marincovich PJ. Importance-weighted audibility and the recognition of HA processed speech. Ear Hear. 1989; 10: 101-108
- Kuk F, Keenan D, Lau C, Ludvigsen C. Performance of a fully adaptive directional microphone to signals presented from aarious azimuths. J Am Acad Audiol. 2005;16(6):333-347.
- Kuk F, Ludvigsen C. The real-world benefits and limitations of active digital feedback cancellation. Hearing Review. 2002p;9(4):64-68.
- Yoshinaga-Itano C, Sedey AL, Coulter DK, Mehl A. Language of early- and later-identified children with hearing loss. Pediatrics. 1998;102(5):1161-1171.
- Baekgaard L, Jensen L, Kidmose, P, Norgaard, M, Klinkby, K. High Definition Locator–Having your cake and eating it too. In: F Kuk, ed. Integrated Signal Processing. Hearing Review. 2006; 13(2)[Suppl]:16-18. www.widexusa.com/inteo_info4.php.
- Kuk F, Paludan-Muller C. Noise management algorithm may improve speech intelligibility in noise. Hear Jour. 2006; 59(4):62-65.
- American National Standards Institute. American National Standard: Methods for the Calculation of the Speech Intelligibility Index. ANSI S3.5. Washington, DC: ANSI; 1997.
- Dehn KE. Directional power ITE hearing aids for moderately severe hearing losses. Poster presented at: the American Academy of Audiology Convention; April 18-31, 2007; Denver.
This article was submitted to HR by Jane Auriemmo, AuD, manager of the Widex Pediatric Assistance Program, Long Island City, NY; and Chi Lau, PhD, and Francis Kuk, PhD, who are associated with the Widex Office of Research in Clinical Amplification (ORCA) located in Lisle, Ill. Correspondence can be addressed to HR or Jane Auriemmo at .