Part 1 of this two-part article details the NAL approach for prescribing and evaluating a hearing aid for people who use a cochlear implant in the opposite ear. This approach is based on two items of research that show: 1) Systematic adjustment of the hearing aid to suit individual needs leads to improved performance; and 2) Empirical results show that the NAL-RP procedure prescribes appropriate frequency-response slope on average. Because NAL-RP was designed for linear aids, the proper prescription and fine-tuning (via paired comparisons) for appropriate frequency and gain responses for non-linear aids are also explained, and two case studies are included. Part 2 of this article will review recent research on binaural benefits arising from bimodal hearing.
Research | July 2004 Hearing Review
Part 1: Hearing Aid Prescription, Adjustment, and Evaluation
People with normal hearing use both ears to help them locate the source of sounds and to understand speech in adverse listening conditions. For people who have a severe bilateral hearing loss and receive a unilateral cochlear implant, fitting a hearing aid to the non-implanted ear makes binaural hearing possible. The use of a hearing aid helps to maintain residual functional hearing in the non-implanted ear, and the use of bimodal hearing devices (cochlear implant and hearing aid) in opposite ears provides binaural benefits. We review recent research on binaural benefits arising from bimodal hearing in Part 2 of this article.
The following article focuses on how to prescribe a hearing aid for people who use a cochlear implant in the opposite ear, and how to judge whether the hearing aid amplification is optimal for that individual. The article looks at three aspects of this subject. First, research on the hearing aid amplification requirements of people who use a cochlear implant in the opposite ear is described together with validation results showing that systematic adjustments to suit individual needs led to improved performance. Second, empirical results from evaluation of 34 ears are summarized to reveal that the NAL-RP procedure1,2 prescribes appropriate frequency-response slope on average. This research forms the bases of the National Acoustic Laboratories (NAL) procedure for hearing aid prescription and evaluation. Finally, the clinical procedure for evaluating and fine-tuning a hearing aid is described and illustrated with two case studies. Methods for adjusting gain for low and high input levels are also included for fitting a non-linear hearing aid to a recipient of a unilateral cochlear implant.
Research on Amplification Requirements and Validation
In conjunction with the Children’s Cochlear Implant Centre in Sydney, NAL investigated the amplification requirements of 16 children who received unilateral cochlear implants and continued to use a hearing aid in the non-implanted ear.3 This research determined the best frequency response for understanding speech by using a paired-comparisons procedure. The gain required to equate loudness of speech between ears was determined by using a loudness balancing test. Four alternative frequency responses were used: 1) the NAL response, 2) a response that provided relatively more low-frequency emphasis, 3) a response that provided relatively more high-frequency emphasis, and 4) a response derived on the basis of equating loudness of warble tones in octave bands. These responses were compared in a round-robin fashion. The subjects were required to identify the response that amplified speech for the best intelligibility. The results show that, for all but 4 children, the preferred frequency response agreed with the NAL-RP prescription1,2 within ±3 dB/octave. The 4 children preferred relatively more low frequencies.
The fine-tuning procedure also included a test to equate loudness of speech between ears. Connected speech was presented at 65 dB SPL in the soundfield, and the subjects were asked to compare the loudness of speech in the ear with a hearing aid to that with a cochlear implant. On average, the required gain for balancing the loudness between ears was 6 dB above the NAL-RP prescribed gain, with some individuals requiring more gain and others less. The children’s hearing aids were subsequently adjusted according to individual needs.
Validation3 of the individual hearing aid adjustment was carried out by assessing the speech perception, functional performance, and localization of 11 children before fine-tuning (CIHAworn) and after fine-tuning (CIHAadj), relative to their performance with a cochlear implant alone (CI). The CIHAworn setting was the setting the children wore before participating in the study, whereas the CIHAadj was the setting that resulted from individual fine-tuning. Speech perception was measured by presenting BKB sentences in babble noise from the same loudspeaker positioned at 0° azimuth at a distance of 1 meter. Performance was scored as the number of keywords correctly repeated, expressed as percentage correct.
Functional performance was evaluated by soliciting the parent’s observations of their child’s performance in a range of communicative situations in everyday life over a period of 1 week for each amplification condition. A structured interview based on a parent’s questionnaire was carried out at the end of each trial period.
Horizontal localization was assessed by using an array of 11 loudspeakers spanning an arc of 180° located in an anechoic chamber. Broad-band pink noise pulses were presented from each of the loudspeakers in a random order. Performance was scored as number of error speakers between the source loudspeaker and the loudspeaker identified by the subject, expressed as root mean square (rms) errors in terms of degrees. Figure 1 shows, for each measure, the scores obtained with the implant and the hearing aid as worn (CIHAworn), the scores obtained after the hearing aid was fine-tuned for each individual (CIHAadj), and the scores obtained when a cochlear implant alone (CI) was used.
Figure 1. Sentence perception, functional performance, and horizontal localization for cochlear implant and hearing aid as worn (CIHAworn), cochlear implant alone (CI), and cochlear implant and adjusted hearing aid (CIHAadj). Percent correct scores for speech perception in quiet are indicated by open circles, and speech perception in noise by filled squares. Functional performance results are expressed as parents’ questionnaire scores in percentage terms. For speech measures and functional performance, improved performance is denoted by higher scores. Localization results are expressed as rms errors in terms of degrees between the source and the response loudspeakers. Better performance is shown by reduced error. Vertical bars denote 0.95 confidence intervals.
On average, the CIHAadj speech scores were significantly better than those for CI and CIHAworn (p<0.008). The same is true for functional performance (p<0.008) and horizontal localization (p<0.005). This research shows that the use of a systematic evaluation and fine-tuning procedure leads to improved performance than if average requirements were assumed for these users of bimodal hearing devices.
Empirical Results on Evaluation
The preferred frequency response and required gain of adult and child users of bimodal hearing devices were reported in three recent studies.3,4,5 Evaluation results from 34 subjects (21 children and 13 adults) are summarized here. All subjects used a Nucleus CI22 or CI24 in one ear, and a hearing aid in the opposite ear. The hearing aid (Bernafon AF120) was a single-channel BTE with selectable input compression and a fixed compression ratio of 2:1. The hearing aids were fitted using a NAL-RP prescription. Table 1 shows the mean hearing threshold levels of the subjects.
Frequency response. A paired-comparisons procedure was used to determine the best frequency response for understanding speech. The NAL-RP prescription was compared to two alternatives that provided either more low-frequency emphasis or less low-frequency emphasis relative to the prescription. Figure 2 shows the mean alternative response slopes relative to the NAL-RP.
Figure 2. Alternative frequency responses that provided either more low-frequency emphasis (Boost, in blue) or less low-frequency emphasis (Cut, in red) relative to the NAL-RP prescription, averaged across 34 subjects. The prescription is represented schematically by the zero line.
Recorded speech was presented audio-visually in the soundfield at 65 dB SPL. The subjects listened to speech amplified with the NAL-RP response and an alternative response in pairs using their hearing aids, then chose the response that was better for intelligibility. A “significant preference” was indicated when a subject chose a response 7 times out of 8 comparisons.
The preferred responses were compared to the NAL-RP and the NAL-NL1 prescriptions. Because NAL-NL1 does not prescribe gain targets in the frequency region where the hearing loss is extreme (ie, where audibility in the region is not likely to make a significant contribution to intelligibility),6 targets were missing at several frequencies for many of the subjects. For calculation purposes, the missing targets were interpolated from those prescribed at neighboring frequencies, or rolled off at 6 dB/octave from the nearest frequency where a target gain was prescribed. Table 2 shows the mean preferred slope and the slopes prescribed by NAL-RP and NAL-NL1.
Analyses of variance using frequency response slope from 500 Hz to 2000 Hz (preferred vs NAL-RP vs NAL-NL1) as repeated measures factors and age (child vs adult) as categorical factors indicated that the main effects of response slope and age were significant (p<0.0001 and p<0.02, respectively) after correcting for the degrees of freedom using the Huynh-Feldt method. The interaction was not significant (p>0.05). Planned comparisons showed that the preferred slope was not significantly different from the NAL-RP prescribed slope (p>0.05), but was significantly different from the NAL-NL1 slope (p<0.0001). Figure 3 shows the preferred frequency response relative to the NAL-RP and the NAL-NL1 prescriptions.
Figure 3. Preferred frequency response slope (dB/octave) relative to the NAL-RP prescribed slope is shown in the left panel, and to the NAL-NL1 prescribed slope in the right panel.
When compared to the NAL-RP prescription, individual evaluation resulted in minor variation in frequency response slope. A total of 26 subjects (76%) preferred a frequency response that is within ±3 dB/octave of the NAL-RP slope, 4 subjects preferred relatively more high frequencies and 4 subjects preferred relatively more low frequencies. Compared to the NAL-NL1 prescription, 12 subjects (35%) preferred a frequency response within ±3 dB/octave of the NAL-NL1 slope; 1 subject preferred relatively more high-frequency emphasis, whereas the remaining 21 subjects preferred frequency response slopes that provide relatively more low-frequency emphasis.
Gain. A loudness-balancing procedure was used to determine the gain required for speech to be perceived with equal loudness in the ear with the hearing aid compared to the ear with the cochlear implant. Because the hearing aid has a fixed compression ratio of 2:1 but an adjustable compression threshold, the gain was first determined by presenting speech at 55 dB SPL with compression de-selected, then the compression threshold was determined by presenting speech at 80 dB SPL. For each input level, the subject was required to listen with his/her cochlear implant alone then with his/her hearing aid, and then rate the loudness of sound in the hearing aid as louder, the same, or softer than that in the cochlear implant. The hearing aid gain was adjustable in 1 dB steps using an adaptive up-down method, whereas the compression threshold was adjustable in 8 dB steps.
For a 65 dB SPL input level, the mean required gain was 51 dB when averaged over 500 Hz-2000 Hz. This is 2 dB below the NAL-RP prescribed gain and 4 dB below the NAL-NL1 prescribed gain (Table 3).
Similar to the analyses of variance using frequency response slope, the analyses of variance using average gain (500 Hz-2000 Hz) as repeated measures factor (required vs NAL-RP vs NAL-NL1) and age as a categorical factor (child vs adult) showed that the main effects of average gain and age were significant (p<0.03 and p<0.04, respectively) after adjustment with the Huynh-Feldt correction. The interaction was not significant (p>0.05). Planned comparisons indicated that the required gain was not significantly different from the NAL-RP prescribed gain (p>0.05), but was significantly different from the NAL-NL1 prescribed gain (p<0.03). Figure 4 shows the required gain relative to the two prescriptions.
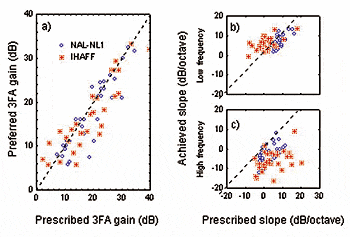
Figure 4. Required average gain (500-2000 Hz) relative to the NAL-RP prescribed gain is shown in the left panel, and to the NAL-NL1 prescribed gain in the right panel.
On average, the NAL-RP procedure prescribed appropriate gain: 19 subjects required gain within ±5 dB of the prescribed gain, while 11 subjects required less gain and 4 required more gain than prescribed. Compared to the NAL-NL1 prescription, 19 required gain within ±5 dB of the prescribed gain, while 11 required less gain and 4 required more gain than prescribed. The distribution of the required gain, as based on comparing loudness between ears, suggests that people with similar hearing loss in the non-implanted ear require different gains to achieve equal loudness of speech perceived via the hearing aid to that via the cochlear implant.
Compression. A total of 25 of the 34 subjects (74%) required a compression threshold of 62 dB SPL, and 7 required a compression threshold of 54 dB SPL to achieve equal loudness between ears for soft and high input levels. Two adults required linear gain with no input compression in order to achieve equal loudness between ears.
In summary, the evaluation data support the use of the NAL-RP for prescribing the frequency response slope because it is shown to be appropriate on average for subjects with mostly profound hearing loss. Using the NAL-NL1 will miss the mark for some people, and using any other prescription that provides relatively more high-frequency emphasis than NAL-NL1 will miss more frequently. The results of this evaluation method reveal that variations in gain are required more often than variations in frequency response slope. These empirical findings form the basis of the NAL approach for prescription and evaluation of a hearing aid for people who use a cochlear implant.
Prescribing and Evaluating a Hearing Aid for Recipients of a Unilateral Cochlear Implant
Because clinical management following implantation is often directed towards establishing the fitting parameters of the cochlear implant, the hearing aid is often neglected for an extended period of time. Therefore, it is necessary to assess the hearing thresholds in the non-implanted ear and verify the hearing aid fitting to ensure that an accurate fitting is achieved prior to evaluation.
Basic procedure for fitting:
- Assess hearing threshold levels.
- Prescribe a hearing aid using an NAL prescription.
- Verify the fitting by insertion gain measurement.
- Check the saturated sound pressure level to ensure listening comfort.
To fit a young child with a hearing aid, replace Step 1 by:
1a. Assess hearing thresholds in dB SPL in the ear canal.
1b. Measure real-ear-to-coupler difference (RECD)7 using custom earmold.
…and Step 3 by:
3. Verify the fitting in an HA2-2cc coupler
For a more detailed explanation on fitting a non-linear hearing aid to a young child using the NAL-NL1 prescription, see the articles by Ching et al.8,9 in Hearing Review and Trends in Amplification.
Evaluation and fine-tuning can be carried out for each individual 2-4 weeks after fitting. This includes checking that the frequency response is best for understanding speech, and that the hearing aid amplifies sounds to a similar loudness level as the cochlear implant. Details of the procedure are available on the NAL Web site (www.nal.gov.au) and are outlined in the following section.
• Basic procedure for evaluation of frequency response. A paired-comparisons procedure is used to identify the best frequency response for understanding speech. In this procedure, the client switches off his/her cochlear implant, and listens to speech amplified with the hearing aid. The prescribed frequency response is compared to alternative responses that provide either a nominally 6 dB/octave boost, or a nominally 6 dB/octave cut from 250 Hz to 2000 Hz in pairs. Practical constraints will often limit the response variation to less than this. During the test, recorded connected speech is presented in the soundfield. The client listens to each response in pairs, then chooses the better frequency response in each comparison. The NAL response is used as the reference in each comparison because the prescription has undergone detailed validation to be appropriate on average.10,11,12 The NAL response is deemed to be suitable if no alternative response is significantly preferred to the NAL response.
Briefly, the procedure includes the following steps:
- Set up alternative frequency responses in the hearing aid fitting software.
- Instruct the client to compare speech amplified with one response to that amplified with an alternative response, and to choose the response that makes speech easier to understand. The cochlear implant is switched off during the comparisons.
- Present a recorded story in the soundfield at an average input level. (For children, audio-visual presentation of speech stimuli results in more reliable judgments than auditory alone presentation.13)
- Switch between alternative frequency responses in the hearing aid fitting software in pairs.
- Record the client’s judgment for each comparison.
- Repeat the comparisons until a frequency response was preferred 7 out of 8 comparisons (or 10 out of 12 comparisons), or until it is clear that there is no clear-cut preference for either alternative response.
• Basic procedure for evaluation of gain. After the preferred frequency response is identified, a loudness-balancing test is used to ensure that speech amplified with the hearing aid is perceived to be as loud as speech amplified with the cochlear implant. In this procedure, the client listens to speech presented in the soundfield first with the implanted ear, then with the ear wearing a hearing aid. The client is asked to judge whether the sounds in both ears are equally loud. Depending on the judgments, the hearing aid gain is increased or decreased adaptively using an up-down procedure. This process is repeated until the required gain to amplify speech to the same loudness as the cochlear implant is determined.
For a linear hearing aid, speech is presented at 65 dB SPL in the sound field, and the master gain of the hearing aid is adjusted. For a non-linear hearing aid with adjustable compression ratio, speech is presented at 55 dB SPL, and the hearing aid gain (or gain for low-level sounds) is adjusted. Then, speech is presented at 80 dB SPL, and the compression ratio (or gain for high-level sounds) is adjusted to achieve equal loudness between ears. For a non-linear hearing aid with adjustable compression threshold but fixed compression ratio, speech is presented at 55 dB SPL for determining overall gain with no compression, then at 80 dB SPL for determining the compression threshold.
The steps include:
- Instruct the client to listen first with the cochlear implant, then with the hearing aid, and to judge whether the hearing aid sounds softer, the same, or louder than the cochlear implant.
- Present recorded speech in the sound field (use audio-visual presentation for children).
- Adjust the hearing aid gain using an adaptive up-down procedure until the same loudness is perceived for 2 out of 3 trials.
An information package containing a video demonstration of the test procedures is available from Cochlear Ltd (www.cochlear.com) and from the National Acoustic Laboratories (www.nal.gov.au ).
Case Study of an Adult with a Single-Channel Aid: CW
CW is an adult who has acquired hearing loss of unknown etiology for 20 years. He has used a Nucleus CI24 with a SPrint processor programmed with the ACE strategy in one ear for 4 years, and has continued to wear a hearing aid in the non-implanted ear. His hearing thresholds were assessed using standard audiometry under TDH-39 headphones. A Bernafon AF120 was fitted to his non-implanted ear. This hearing aid is a single-channel device, and has selectable wide-dynamic-range compression (WDRC) with a fixed compression ratio of 2:1 and an adjustable compression threshold. The targets for an average input level were verified using insertion gain measurements. Four weeks after verification, his hearing aid was evaluated.
Obtaining the best frequency response. Before he arrived, the clinician calculated the alternative frequency responses. (A calculation worksheet is available on the NAL Web site). These were set up in the fitting software as the “Boost” and “Cut” responses using the following steps:
- Connect a hearing aid to a programming device and a computer using the Bernafon Oasis software.
- In the Gain screen under Tuning, copy the NAL response and rename it as “Boost.”
- Adjust the gain and the filter settings to match the calculated gain-frequency response for “Boost.”
- Verify in a HA2 2-cc coupler.
- Repeat Steps 2, 3, and 4 for the “Cut” response.
When CW arrived, the clinician explained that CW would hear speech amplified differently by his hearing aid, and he would need to compare them and choose the best response for speech intelligibility.
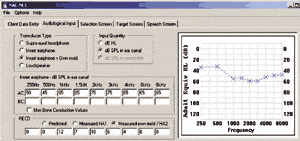
CW switched off his cochlear implant while listening through his hearing aid. Recorded speech was presented audio-visually in the soundfield at 65 dB SPL. For each comparison trial, the clinician activated one frequency response for CW to listen with this response for a little while, then an alternative response for him to listen and compare with the first one. The clinician could do this in the Program screen under Completion (Figure 5).
The order of presentation of responses followed a pre-determined randomized order in which the NAL response was presented in the first and second position for an equal number of times. After each comparison, CW indicated whether the first response or the second response made speech easier to understand. CW chose the NAL response 7 times out of 8 comparisons.
Obtaining loudness balance. CW was then instructed to compare the loudness of speech perceived via his cochlear implant with the loudness of speech perceived via his hearing aid using the preferred frequency response setting. He switched off his cochlear implant while listening through the hearing aid, and switched off his hearing aid while listening through his cochlear implant.
First, speech was presented at 55 dB SPL. CW listened with his cochlear implant, then with his hearing aid (input compression was deselected in the Tuning> AGCi screen). He was asked to judge whether the hearing aid sounded louder, the same, or softer than the cochlear implant. The overall gain was adjusted in the Tuning>Gain screen according to his judgments, and the process was repeated until the hearing aid and the cochlear implant sounded equally loud.
Second, post-filter compression (L) was selected in the AGCi screen under Tuning. Speech was presented at 80 dB SPL, and the compression threshold was adjusted until the hearing aid and the cochlear implant sounded equally loud. With input compression of 2:1, the required compression threshold was 62 dB SPL. His hearing aid was adjusted accordingly.
Case Study of Child with a Multi-Channel Aid: DG
DG is a child who has used a Nucleus CI22 with an Esprit 22 processor programmed with the SPEAK strategy for 5 years. After implantation, she did not wear a hearing aid in the non-implanted ear.
Her hearing thresholds were assessed, and a Siemens Prisma 2SP+ was fitted to her non-implanted ear using the NAL-NL1 prescription. This hearing aid is a 4-channel BTE with adjustable compression threshold and compression ratio. The coupler gain targets were derived using the child’s RECD measurements in the NAL-NL1 standalone software, and the hearing aid was adjusted and verified in an HA2-2cc coupler using speech-shaped noise as stimulus. Prior to measurement, all adaptive features of the hearing aid (voice activity detection, microphone noise reduction, and cross-channel coupling) were switched off by selecting Fitting>Test Settings>Adaptive Parameters.
To achieve a close match to the prescribed gains, the gains for individual frequency bands were adjusted in the Frequency Shaping screen, and compression thresholds and ratios were modified in the Compression screen. Multi-channel AGC-O was selected in the Output screen. The saturated sound pressure level (OSPL 90) was verified using a swept tone. DG was encouraged to wear the hearing aid with her cochlear implant for a few hours every day. Four weeks after fitting, her hearing aid was evaluated.
Obtaining the best frequency response. The alternative frequency responses were first set up using the Siemens Connexx software in the Frequency Shaping screen, a HIPRO programming device, and a hearing aid test box (Figure 6).
Alternative responses were saved under File>Save Session. When the child returned for paired-comparisons testing, the hearing aid parameters for the alternative responses saved in a previous session were retrieved under Edit>Session List (Figure 7).
A recorded story was presented audio-visually. The child was given a switch box with two positions labeled “A” and “B” respectively, and was asked to listen to the story first with “A” then with “B”, and then to judge which one was easier to understand. For each comparison, the clinician activated a different pair of responses in the hearing aid, according to a predetermined randomized order. The cochlear implant was switched off during this test.
Obtaining loudness balance. In the loudness balancing task, DG’s hearing aid was muted when she listened with the cochlear implant, and her cochlear implant was switched off when she listened with her hearing aid. She found that speech presented at 55 dB SPL sounded equally loud in both ears. However, when speech was presented at 80 dB SPL, the hearing aid sounded softer than the cochlear implant. Adjustments of compression ratio were made according to the child’s ratings until equal loudness was achieved. This was carried out by increasing the Gain for Loud Sounds in the Compression screen (Figure 8).
Summary
We have described the empirical basis for the NAL approach for prescribing and evaluating a hearing aid for people who use a cochlear implant in the opposite ear, and presented evidence showing that systematic evaluation and fine-tuning brought about improved binaural benefits. In addition, we have summarized evaluation results from 34 subjects with mostly profound hearing loss in the non-implanted ear showing that NAL-RP is more appropriate than NAL-NL1 for prescribing frequency response slope.
Because the NAL-RP is a procedure for prescribing linear hearing aids, it does not prescribe compression threshold or compression ratio. For multi-channel non-linear hearing aids, compression ratio can be assumed to be similar across frequencies, and gain for low-level and high-level inputs (compression ratio) can be set using the steps described under Basic Procedure for Evaluation of Gain. Finally, the NAL hearing-aid fitting and evaluation procedures are illustrated with an example case using a single-channel hearing aid and a second example case using a multi-channel hearing aid. The hearing aid evaluation and adjustment procedure should be carried out after stable fitting parameters of the cochlear implant are established. This will ensure that the hearing aid works best with the cochlear implant for each individual.
| Teresa YC Ching, PhD, (pictured) is senior research scientist; Mandy Hill, DipAuD, is a Research Audiologist; Harvey Dillion, PhD, is Director; and Emma van Wanrooy, MAud, is a Research Audiologist at the National Acoustics Laboratory (NAL) in Sydney, Australia. |
Correspondence can be addressed to HR or Teresa YC Ching, PhD, National Acoustics Laboratories, 126 Greville St, Chatswood, NSW 2067, Australia; email: [email protected].
References
1. Byrne D, Dillon H. The National Acoustic Laboratories’ (NAL) new procedure for selecting the gain and frequency response of a hearing aid. Ear Hear. 1986; 7:257-265.
2. Byrne D, Parkinson A, Newall P. Modified hearing aid selection procedures for severe/profound hearing losses. In: Studebaker G, Bess F, Beck L, eds. The Vanderbilt Hearing Aid Report II. Maryland: York Press: 1991.
3. Ching TYC, Psarros C, Hill M, Dillon H, Incerti P. Should children who use cochlear implants wear hearing aids in the opposite ear? Ear Hear. 2001;22: 365-380.
4. Ching TYC, Psarros C, Hill M, Smither J: Should children who wear a cochlear implant in one ear use a hearing aid in the opposite ear? In: Seewald RC, Gravel JS, eds. A Sound Foundation through Early Amplification 2001: Proceedings of the Second International Conference. Stafa, Switzerland: Phonak AG. 2002:195-202.
5. Ching TYC, Incerti P, Hill M. Binaural benefits for adults who use hearing aids and cochlear implants in opposite ears. Ear Hear. 2004; 25:9-21.
6. Dillon H. NAL-NL1: A new procedure for fitting non-linear hearing aids. Hear Jour. 1999; 52(4):10-16.
7. Moodie KS, Seewald RC, Sinclair ST. Procedure for predicting real-ear hearing aid performance in young children. Amer J Audiol. 1994; 3(1):23-31.
8. Ching TYC, Britton L, Dillon H, Agung K. RECD, REAG, NAL-NL1: Accurate and practical methods for fitting non-linear hearing aids to infants and children. Hearing Review. 2002; 9(8):12-20, 52.
9. Ching TYC, Dillon H. Prescribing amplification for children: adult-equivalent hearing loss, real-ear aided gain, and NAL-NL1. Trends Amplif. 2003; 7(1):1-9.
10. Byrne D, Cotton S. Evaluation of the National Acoustic Laboratories’ new hearing aid selection procedure. J Sp Hear Res. 1988; 31:178-186.
11. Ching T, Newall P, Wigney D: Frequency response and gain requirements of severely and profoundly hearing impaired children. Austral J Audiol. 1996;18:99-101.
12. Byrne D, Ching TYC. Optimising amplification for hearing-impaired children: I. Issues and procedures. Austral J Ed Deaf. 1997; 3:21-28.
13. Ching T, Newall P, Wigney D. Audio-visual and auditory paired comparison judgments by severely and profoundly hearing impaired children: reliability and frequency response preferences. Austral J Audiol. 1994;16: 99-106.

