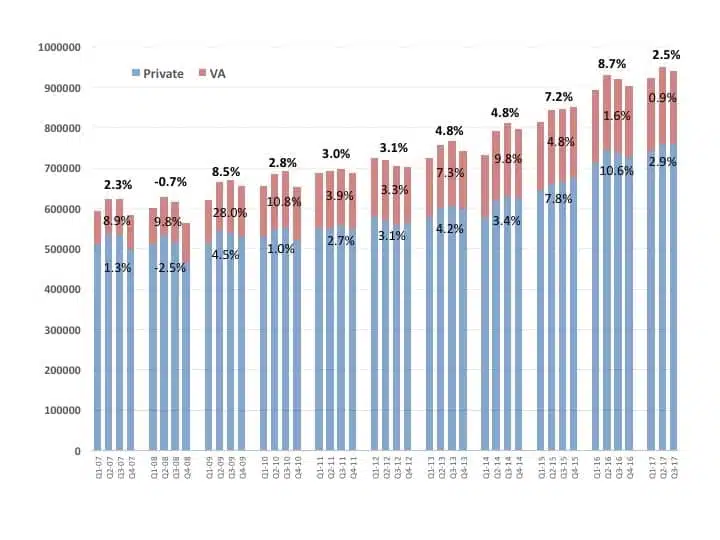
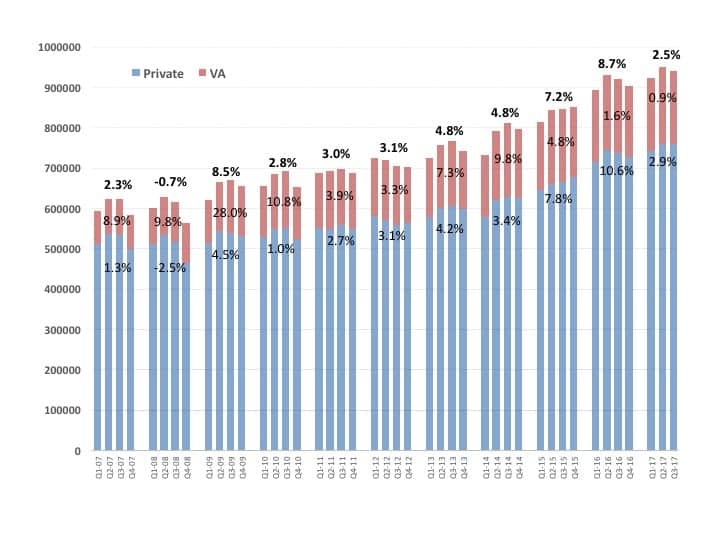
Figure 1. [Click on graphic to enlarge.] Quarterly net unit hearing aid sales for the private/commercial (blue) and VA (red) markets, with year-on-year percentages for each market, and overall yearly sales increases in bold at the top. Source: HIA.
For the first three quarters, from January through September, overall hearing aid unit sales are 2.54% above 2016 sales in the total market, with sales in the private/commercial sector increasing by 2.9%, and dispensing activity in the Department of Veterans Affairs (the VA comprises 19.6% of the total market) increasing by 0.94% (Figure 1). Total sales in Q1-Q3 2017 increased by 3.4%, 2.3%, and 2.0%, respectively; the private sector experienced sales increases of 3.9%, 2.1%, and 2.8% compared to the same quarters in 2016.
Historically, hearing aid unit sales have increased by about 2-4% per year. Thus, the recent HIA statistics for 2017 are trending toward the low side of these norms. But they’re also following 4 years of strong growth (5-8% unit increases) from 2013-2016—sales growth that many in the industry (including certain editors) have largely attributed to the aging Baby Boomer population. However, as mentioned in previous HR analyses, there are also several mitigating factors involved in these recent HIA statistics, including the addition in 2016 of two new reporting members, as well as the distribution power of mass retailers being included in the private sector sales statistics.
The takeaway is that 2017 hearing aid sales are not as strong as might have been anticipated. Anecdotal reports from the field point to a range of mildly good to mildly poor years for independent dispensing businesses. With what appears to be a strong economy, the reason for an overall downturn in hearing aid sales is unclear. Possible explanations include the current turmoil in Washington, consumers’ uneasiness with ongoing healthcare changes, the recent hurricanes in Q3, or consumers sitting on their hands in anticipation of an over-the-counter (OTC) class of hearing aids. Considering that average selling prices (ASPs) of hearing aids have been decreasing by 1-2% annually, the gross revenue of an average practice is likely at about the same level as in 2016.
As mentioned in the HR August Staff Standpoint, the economy rarely seems to be a good indicator of hearing aid sales; however, lagging hearing aid sales have occasionally been a bellwether for a slumping economy.
Other statistics from the Q3 2017 HIA report to note:
-

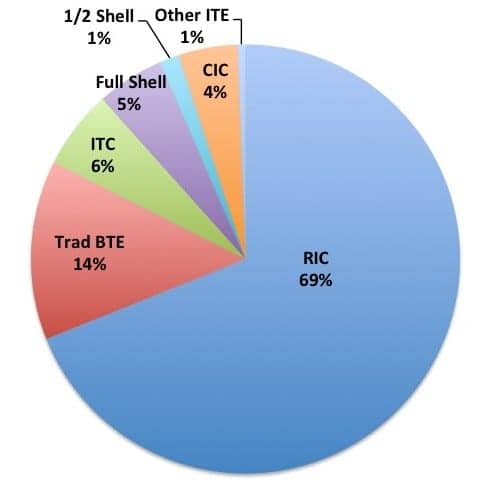
Figure 2. Hearing aid styles in 2017 (January through September). RICs/RITEs and traditional BTEs now make up more than four-fifths of the US market.
Through the third quarter, BTE sales were more than four-fifths (82.4%) of all hearing aid sales. Receiver-in-the-canal (RIC) and receiver-in-the-ear (RITE) devices—a subgroup of BTEs—made up 68.9% of the total market, while traditional BTEs made up only 13.5% (Figure 2).
- In-the-ear (ITE) style hearing aids were 17.6% of all US hearing aids dispensed during the first three quarters of 2017. In-the-canal (ITC) aids constituted 6.0% of the market, full-shell ITEs 5.1%, half-shell ITEs 1.5%, and completely-in-the-canal (CIC) aids 4.4%, while “other ITEs” accounted for 0.6%.
- Almost 9 in 10 of all hearing aids (88.9%) dispensed through September contained wireless technology, according to the HIA report, with 86.3% of hearing aids sold by the commercial sector being wireless and 99.7% by the VA.
- In Q3 2017, 19.4% of all hearing aids dispensed were returned to the manufacturer, up slightly from Q3 2016 (18.0%). A total of 22.5% of all ITEs were returned for credit (RFC). Wireless RIC/RITEs, which made up more than two-thirds of the HIA unit sample, had an RFC rate of 20.1% compared to 17.8% for non-wireless RIC/RITEs. Wireless traditional BTEs had an RFC rate of 18.2% versus a 1.1% rate for non-wireless traditional BTEs. (Editor’s note: Manufacturers have significantly different methods for counting RFCs than dispensing professionals: they include any units that are replaced, remade, or exchanged for any reason. In contrast, most dispensing professionals usually do not count into their RFC rates exchanges/remakes, as well as instances where a patient may have tried more than one set of aids (a frowned-upon practice since it dramatically increases the overall cost of hearing aid production). For this reason, industry RFCs are thought by this editor and many others to be a poor indicator for customer satisfaction, acceptance rates, etc.) —KES


Which type of Audiometers are more preferred/have major market share in the United States/Globally?
Diagnostic Audiometers
Screening Audiometers
Clinical Audiometers
With the emergence of OTC aids. More and more are now waiting for the market to get flooded before they will buy. They see the hearing aid industry and audiologists as a con .
One more proof that hearing aid industry cannot help 80% of hearing impaired who, for whatever reason, do not use hearing aids. We’ll soon see how emerging CE devices with hearing enhancement functionality do, but, it should not be difficult to do better than 20% penetration rate.