Features | April 2015 Hearing Review
Results from this study suggest that a new algorithm reduces the perceived negative effects of reverberation while not introducing unwanted artifacts within the speech signal. In fact, increasing the strength of the algorithm led to an improvement in the judgment of speech naturalness. However, it should be noted that care must be taken not to increase the effect of the algorithm too much.
Whether we are conscious of our surroundings or not, the acoustic properties of the environment affect our perception of the sound around us. Within a closed environment, such as a classroom or a concert hall, the room acoustics have a large influence on the transmission of sound between the source and the listener.
The sound perceived by the listener in a room is composed of both the direct part and the reverberant part of the signal. The exact nature of how these two sources combine depends on the room characteristics, as well as the listener’s position in relation to the sound source. Boothroyd1 identified four key factors that affect the perceived acoustic signal in a room:
- Distance;
- Early reverberation;
- Late reverberation; and
- Noise.
The distance between the source and the listener influences the perceived signal. The farther away the source is from the listener, the greater the influence of the reverberant signal. The point where the energy of the direct sound is equal to the energy of the reverberant signal is called the critical distance (CD). When the listener comes closer to the signal source—within the CD—the direct signal will dominate and the effect of reverberation will be negligible. Beyond the CD, however, the reverberant part of the signal will prevail over the direct signal.2 In this condition, the listener will mostly perceive the reverberant part of the signal within a diffuse sound field, such as a large school auditorium.
Depending on the room’s acoustical properties and the listener’s position within the room, the reflected sound can be divided into early and late reflections or reverberation. Early reflections, defined as all the reflections coming within the first 50 ms after the direct sound, might improve speech intelligibility for both normal and hearing-impaired listeners. Bradley et al3 proposed to use the early reflection benefit (ERB) to quantify the ratio between the early reflections (within the first 50 ms) and the direct sound (within 10 ms). The late reflections, arriving after 50 ms, are considered to have a detrimental effect for hearing-impaired individuals and can therefore be considered to be noise or unwanted sound.4
The characteristics of the reverberant conditions can be quantified by using the CD, the useful-to-detrimental sound ratio (U50) and the useful-to-late sound ratio (C50). These indicators describe the effect of reverberation within a given room at a given distance from the source. The topic is considerably complex, and a full explanation is beyond the scope of this article (see Bistafa and Bradley5 for details). However, the U50 considers the detrimental part of the signal as the sum of the noise and the late reflections, and there is an inverse relationship between the U50 and speech intelligibility.6 Based on these observations, it appears that the perceived effect of reverberation depends on many parameters and that reverberation cannot always be considered to be a problem for a listener.
It is important to look at the function of the room before determining the potential negative effect of reverberation. Reverberation in a concert hall, for example, is frequently desirable; it contributes to the listening experience. Within a classroom or an auditorium, however, the amount of reverberation should be reduced to improve the ability to understand what is being discussed. Excess reverberation in this case is distracting and can even reduce the ability to understand speech.
Speech Intelligibility and Reverberation
The negative effects of reverberation on speech intelligibility have been observed for hearing-impaired subjects in unaided7,8 and aided9,10 test conditions. It is assumed that, in the reverberant (diffuse) sound field outside the CD, reflections arrive from all directions. Because the useful and the detrimental signals are not spatially separated, the benefit provided by directional microphones might be challenged.4
Walden et al11 gathered microphone setting preferences in a variety of listening situations. In the absence of background noise, but in a highly reverberant condition, the distance from the sound source was the main factor affecting the microphone mode preference. When the sound source was far from the listener, there was a significant preference for the omnidirectional mode—a preference not observed when the signal was closer to the listener.
Ricketts and Hornsby2 measured the benefit of directionality on speech recognition tests in both a moderate and a low reverberant environment. The directional benefit was significantly lower in the moderately reverberant environment when the signal-to-listener distance was longer than the estimated CD.
When the room acoustics are affecting speech intelligibility, then it can be seen that another approach besides directional microphones is needed to help the hearing aid wearer listen in reverberant environments.
Solutions for Hearing Aids in Reverberant Environments
Assistive listening devices (ALDs) were developed to help hearing aid wearers in reverberant and noisy environments when conventional technology, such as directional microphones, provides limited benefit. FM receiver systems or induction loops with hearing aids can significantly improve speech reception in a classroom environment.12
However, their use depends on the available facilities and on the technology that the wearer has in his or her hearing aids. It cannot be expected that all potentially reverberant environments have FM or loop equipment available for the hearing aid wearer. It is also unrealistic to expect the hearing aid wearer to continuously connect (or disconnect) the devices to other equipment as he or she moves from room to room. These observations suggest that a dedicated algorithm, designed to reduce reverberation, might help hearing aid wearers in adverse reverberant conditions.
A dedicated algorithm was developed that aimed to detect and reduce the amount of reverberation experienced by the hearing aid wearer. The challenge in developing such an algorithm was to reduce reverberation only when reverberation is present and not to reduce the informative portion of the signal.
In this investigation, the following research questions were addressed:
1) Does the reverberation reduction algorithm reduce the perceived amount of reverberation?
2) Does the reverberation reduction algorithm produce unwanted artifacts within the speech signal?
This experiment used normal hearing listeners to assess the perceptual differences of different algorithm settings. The analytic hierarchy process (AHP)13 was used to determine the best setting for a reverberant environment.
Methods
Participants. Normal-hearing listeners were chosen to evaluate the perceptual effect of the reverberation reduction algorithm, as they form a relatively homogeneous group and no compensation for individual hearing loss was needed. The use of normal-hearing listeners reduces the sources of variability that could have arisen from individual differences, such as suprathreshold deficits including reduced frequency and temporal resolution, and modulation detection as suggested by Brons et al.14
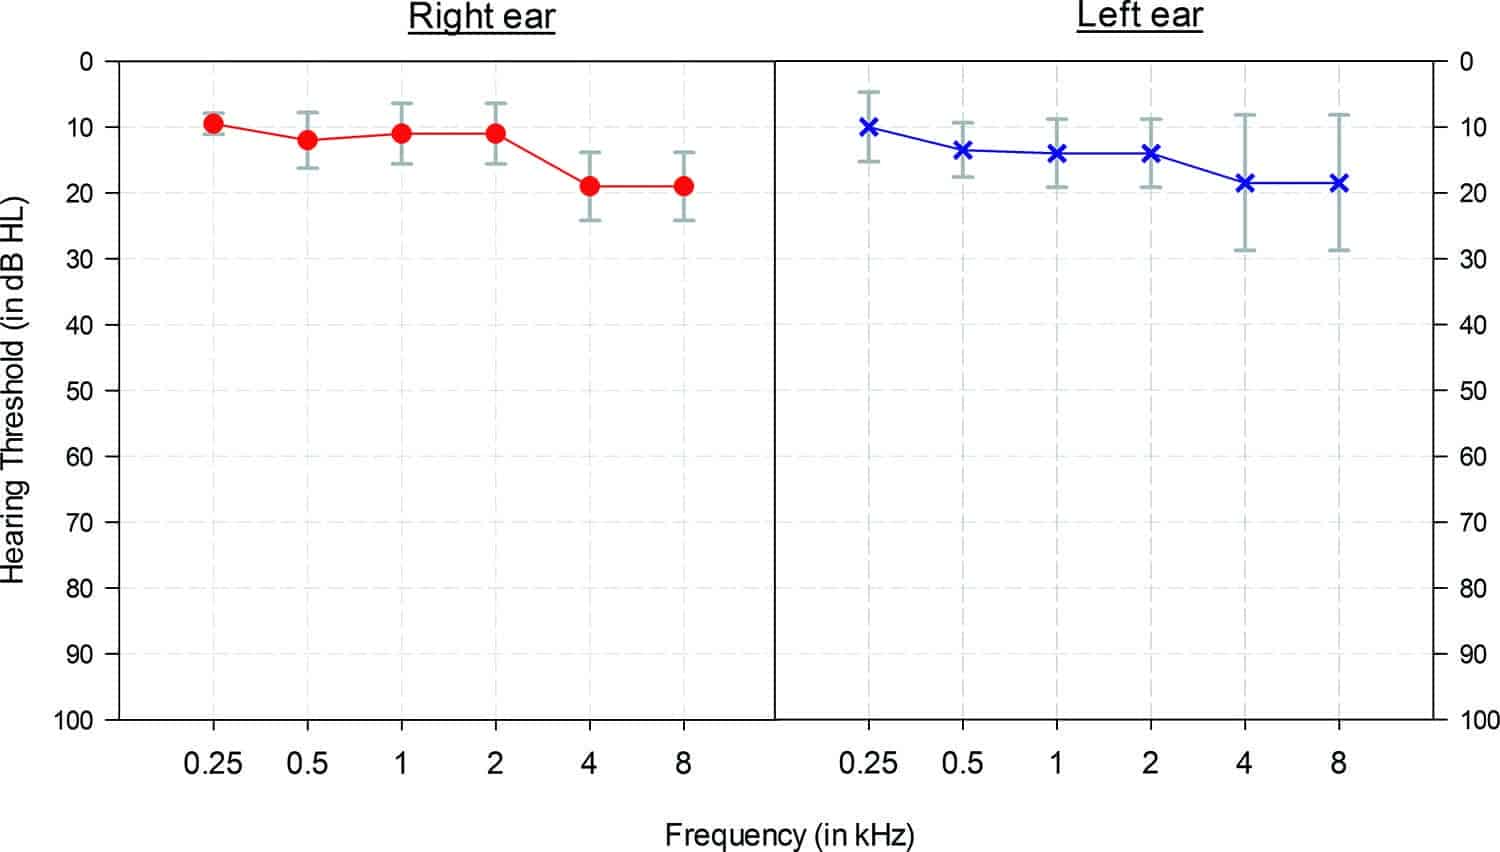
Figure 1. Hearing thresholds (dB HL) for the 11 test participants. Bars represent one standard deviation.
A total of 11 normal-hearing listeners participated in this study (10 males and 1 female). The average audiometric thresholds for air conduction (left and right ears) are shown in Figure 1. The audiometric data were collected prior to testing using a GSI 61 audiometer and E-A-R TONE 3A insert earphones in a single-walled sound attenuated room.
The reverberation reduction algorithm. The reverberation reduction algorithm was implemented within a commercially available receiver-in-the-ear (RITE) hearing aid. Four settings (RevRed1, RevRed2, RevRed3, and RevRed4) with increasing attenuation strength were used for this experiment.
Analytic Hierarchy Process (AHP). Paired comparisons are commonly used in perceptual testing to assess differences between algorithms, such as those found in hearing aid signal processing.15 It is important to define one or many criteria for comparison during the test design phase. These criteria should be selected in terms of the tested device or algorithm and also regarding the samples used for the comparison.
The International Telecommunications Union (ITU P.835, 2003)16 guideline recommends the use of three criteria: speech signal, background noise, and overall effect for noise suppression algorithm tests. The background noise criterion was replaced by the amount of reverberation for this evaluation. Different rankings were expected with regard to the tested criteria, as a more aggressive setting might provide the best reverberation attenuation but at the same time could also negatively impact speech naturalness by introducing unwanted audible artifacts. These artifacts could potentially be distracting for the listener and are therefore undesirable. It is a complex problem where the optimal setting might not be the most effective setting on one single tested dimension.
The analytic hierarchy process13 is a multi-criteria decision-making technique that provides a method to select the most suitable setting in a test condition by applying a weight to the selected criteria. To evaluate the preferred reverberation reduction setting, the AHP was used, and two criteria were defined: speech naturalness and amount of reverberation. The overall preference was selected as a third single criterion.
The combination of speech naturalness and the amount of reverberation was compared to the overall preference ranking. The different settings, labeled as the alternatives, were compared in a “round-robin tournament” for each criterion. We used the following five alternatives for our test design: RevRed0 (the unprocessed condition), RevRed1, RevRed2, RevRed3, and RevRed4.
Having five alternatives results in 10 comparisons for each criterion. Each comparison was made between two alternatives, and then rated using a 9-point rating scale where 9 referred to a strong difference and 1 to no difference.
Test materials. Sentences from the “Oldenburger Satztest” (OLSA)17 were used for the AHP. The sentences are similar regarding elocution speed and predictability, so that different sentences can be used for the same test in order to maintain the participant’s attention. The sentences were presented at an average of 65 dB SPL. The samples were recorded from the hearing aid in an Interacoustics TB S 50 pyramid, via a National Instruments PXI 1044 Board (NI), with analog I/O card with a custom-designed LabVIEW software tool (Austin, Tex).
The hearing aid was programmed with a 10 dB linear flat insertion gain. All adaptive features, such as noise reduction and feedback cancelation, were turned off during the recordings.

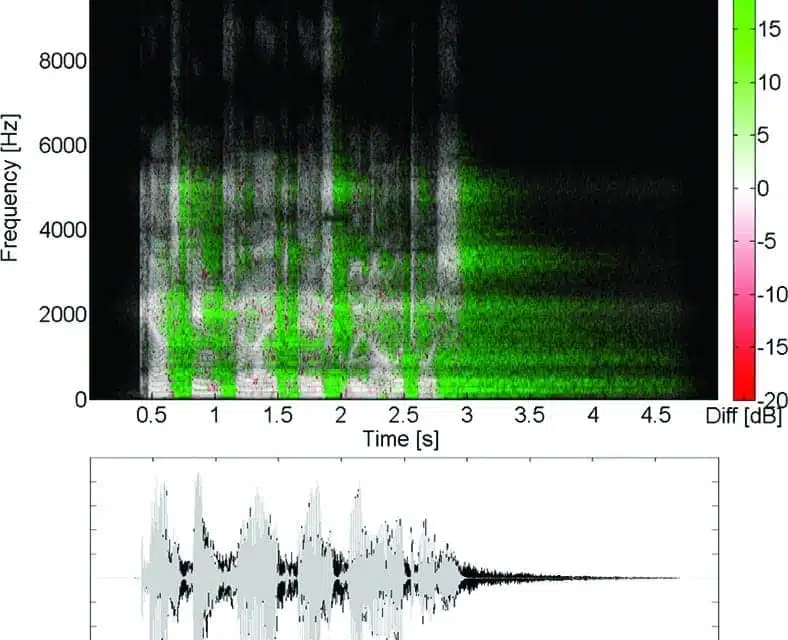
Figure 2. The effect of simulated reverberation on speech with the “Rich Chamber” setting in Adobe Audition. The differences between the dry (without reverberation) and the reverberant signals are represented on the scale on the right in a time-frequency representation (top) and in a time-amplitude representation (bottom). The dry signal is in grey whereas the reverberant signal is in black.
The reverberation was simulated with Adobe Audition (1.5, San Jose, Calif) sound editing software that included predefined reverberation settings, a method that can be reliably repeated. The sentence “Kerstin verleiht elf grüne Autos” (“Kerstin leased eleven green cars”) was recorded once in the original version and once with the simulated reverberation (Rich Chamber setting), as shown in Figure 2. This shows the difference between both recordings in a spectro-temporal analysis, using the Speccompare function18 developed within Matlab (Natick, Mass), and in a time-amplitude representation.
The same sentence was also recorded with the reverberation reduction algorithm enabled and set to the maximum amount of attenuation. Figure 3 shows the attenuation that is applied by the algorithm with the RevRed4 setting on a time-frequency representation and a time-amplitude representation.

Figure 3. The effect of the reverberation reduction algorithm on a speech signal with the algorithm set to the most aggressive parameter—RevRed4. The reduced part of the reverberant signal is shown in a time-frequency representation (top) and in a time-amplitude representation (bottom). The black curve is the unprocessed signal while the grey curve is the processed signal. The test signal is the same as shown in Figure 2.
All of the five alternatives were paired together resulting in 10 comparisons for each tested criterion, as was mentioned earlier. The presentation order was randomly assigned for each listener, and the tested settings were shown as being either A or B.
A short introduction and training was undertaken to allow the listeners to become familiar with the test materials and the questions. The samples were presented binaurally via Sennheiser PC 330 headphones driven by a RME Multiface II sound card, and the subjects’ responses were obtained with a touch screen. For each question, there were 9 possible answers, ranging from “A has more reverberation” to “B has more reverberation,” and it included a “no preference” option. The subjects were permitted to listen to the stimuli as often as they wanted before they answered each question and no time limits were set.
Results
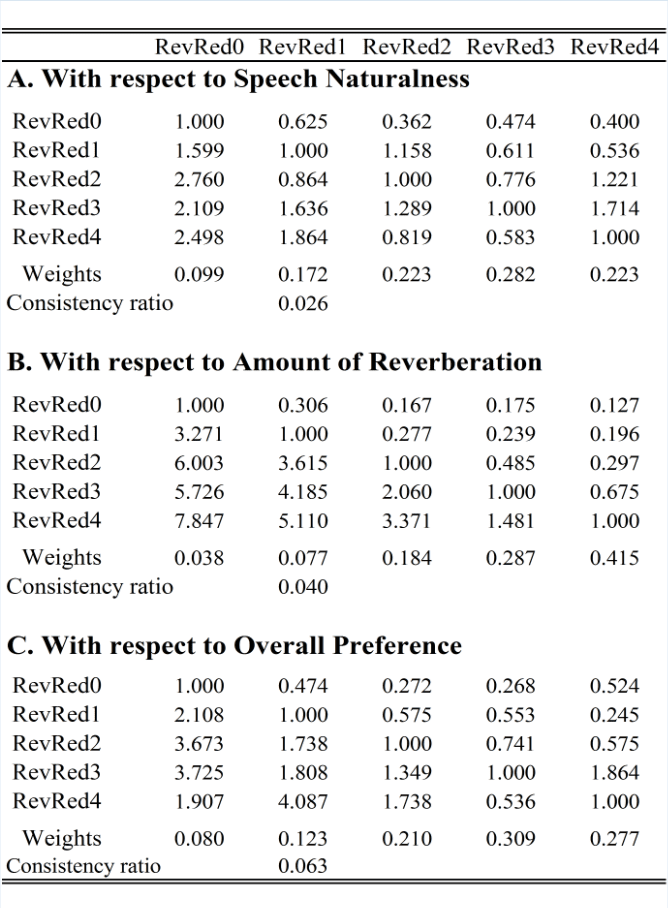
Table 1. The results from the AHP in paired comparison matrices for: A) the speech naturalness scale; B) the amount of reverberation, and C) the overall preference. Values less than 1.0 favor the setting indicated in the column, whereas values greater than 1.0 favor the setting indicated in the row. Ratios closer to 1.0 indicate a smaller perceived difference, while a ratio of 1.0 reflects no perceived difference. The ranking for each scale is represented by the weights on the bottom row. Consistency ratios represent the validity of the rating scale and should be below 10%.
The AHP results can be summarized with pairwise comparison matrices for the different subscales as shown in Table 1. The computed ratios from the matrices indicate the preference and its magnitude when comparing two different settings. Values less than one favor the setting indicated in the column, whereas values greater than one favor the setting indicated in the row. Ratios closer to one indicate a smaller perceived difference while a ratio of one reflects no perceived difference.
As an example, with respect to the amount of reverberation subscale and comparison settings RevRed4 to RevRed0, the mean difference is 7.85, which represents a reduced perceived amount of reverberation for the RevRed4 setting with the 9-point scale.
To evaluate the relevance of the data, it was important to verify consistency of the rankings by the subjects. If RevRed2 is better than RevRed3, and RevRed3 is better than RevRed4, it is therefore expected that RevRed2 is better than RevRed4. This can be verified by using the consistency ratio, which should be lower than 10% in order to validate the scale.13 It is assumed that, if the differences on one scale are clearly audible, then the consistency ratio should be smaller. The consistency ratios for this study were 2.6% for the speech naturalness scale, 4.0% for the amount of reverberation scale, and 6.3% for the overall preference. These low ratios (below 10%) suggest that differences were clear enough in order to provide a consistent ranking for each scale.
The next step was to evaluate the weighting of the different rating scales. The weights for speech naturalness (0.701) and the amount of reverberation (0.299) were combined in order to be compared with the overall preference scale. In other words, we were interested to know if the overall preference can be explained by combining the two tested subscales. The rankings with both approaches are shown in Figure 4.
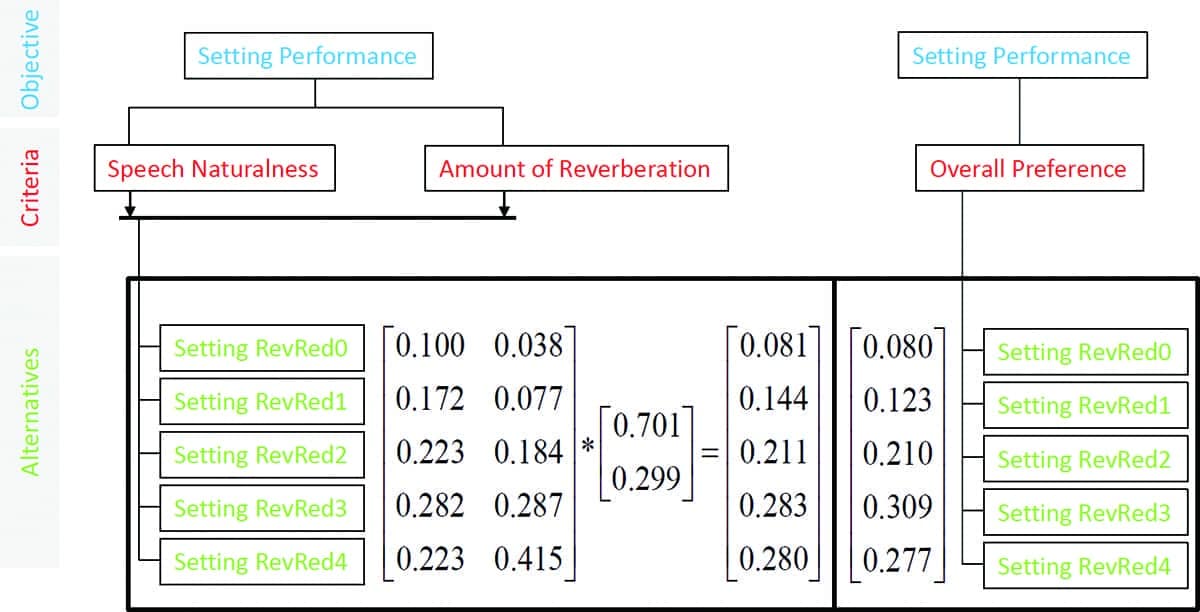
Figure 4. The final ranking for the different tested settings according to a single dimension (overall preference) on the right and the combination of two dimensions (speech naturalness and amount of reverberation) on the left. A higher weight stands for a better position in the ranking.
The final ranking was the same regardless of the rating scale, showing a preference for setting RevRed3, followed (in rank order) by RevRed4, RevRed2, RevRed1, and RevRed0. It suggests that, in a reverberant environment, the algorithm is preferred over the unprocessed condition.
Increasing the strength of the algorithm leads to a stronger preference, but only up to a certain amount. In other words, RevRed4 was reducing the amount of reverberation compared to RevRed3, but was less preferred on the speech naturalness scale.
Discussion and Summary
During the developmental phase of any hearing aid feature that aims to reduce a part of a detrimental signal, developers must be aware that the improvement on one scale, such as the perceived amount of reverberation, should not result in any degradation of the signal via another scale, such as the perceived sound quality. This implies that the preferred setting should solve a multidimensional problem.
The AHP can be used as a suitable tool for choosing the best setting in a specific situation, as in this case, a reverberant environment, and for answering the two research questions posed earlier:
1) Does the reverberation reduction algorithm reduce the perceived amount of reverberation?
Yes, the amount of perceived reverberation was reduced by any setting of the algorithm compared to the unprocessed condition. Increasing the strength of the reverberation reduction algorithm systematically reduced the perceived reverberation.
2) Does the reverberation reduction algorithm produce unwanted artifacts within the speech signal?
No, speech naturalness in the processed condition was always ranked to be better than in the unprocessed condition. Increasing the strength of the algorithm led to an improvement in the judgement of speech naturalness. However, it must be noted that care should be taken not to increase the effect of the algorithm too much.
Combining the amount of reverberation and the speech naturalness scales could explain the ranking on the overall preference scale. The strongest setting (RevRed4) could only improve the perceived experience on the amount of reverberation scale compared to RevRed3. This suggests that the optimal setting in a reverberant environment is not the most aggressive setting.
The use of the AHP helps to provide a framework for making difficult decisions in the hearing aid development process.
Acknowledgements
Portions of this paper were presented as a poster at the British Society of Audiology Annual Conference, September 1-3, 2014 at Keele University in Staffordshire, UK. The authors would like to thank Matthias Bertram for the eSW design and Bernhard Künzle for driving this project.
References
-
Boothroyd A. Room acoustics and speech perception. Seminars Hear. 2004;25(2):155-166.
-
Ricketts TA, Hornsby BWY. Distance and reverberation effects on directional benefit. Ear Hear. 2003;24(6):472-84.
-
Bradley JS, Sato H, Picard M. On the importance of early reflections for speech in rooms. J Acoust Soc Am. 2003;113(6):3233.
-
Kates JM. Digital Hearing Aids. San Diego: Plural Publishing; 2008.
-
Bistafa SR, Bradley JS. Reverberation time and maximum background-noise level for classrooms from a comparative study of speech intelligibility metrics. J Acoust Soc Am. 2000;107(2):861-75.
-
Bradley JS, Reich RD, Norcross SG. On the combined effects of signal-to-noise ratio and room acoustics on speech intelligibility. J Acoust Soc Am. 1999;106(4 Pt 1):1820-1828.
-
Duquesnoy AJ, Plomp R. Effect of reverberation and noise on the intelligibility of sentences in cases of presbyacusis. J Acoust Soc Am. 1980;68(2):537-544.
-
George ELJ, Goverts ST, Festen JM, Houtgast T. Measuring the effects of reverberation and noise on sentence intelligibility for hearing-impaired listeners. J Speech Lang Hear Res. 2010;53(6):1429-1439.
-
Nabelek AK, Pickett JM. Monaural and binaural speech perception through hearing aids under noise and reverberation with normal and hearing-impaired listeners. J Speech Lang Hear Res. 1974;[Dec]17(4):724-739.
-
Shi LF, Doherty KA. Subjective and objective effects of fast and slow compression on the perception of reverberant speech in listeners with hearing loss. J Speech Lang Hear Res. 2008;51(5):1328-1340.
-
Walden BE, Surr RK, Cord MT, Dyrlund O. Predicting hearing aid microphone preference in everyday listening. J Am Acad Audiol. 2004;15(5):365-396.
-
Nabelek AK, Donahue AM, Letowski TR. Comparison of amplification systems in a classroom. J Rehab Res Dev. 1986;23(1)[Jan]:41-52.
-
Saaty TL. How to make a decision: the Analytic Hierarchy Process. Eur J Operational Res. 1990;48:9-26.
-
Brons I, Houben R, Dreschler WA. Perceptual effects of noise reduction with respect to personal preference, speech intelligibility, and listening effort. Ear Hear. 2012;34(1):29-41.
-
Amlani AM, Schafer EC. Application of paired-comparison methods to hearing aids. Trends Amplif. 2009;13(4):241-259.
-
International Telecommunication Union (ITU). ITU-T Recommendation P.835. Subjective test methodology for evaluating speech communication systems that include noise suppression algorithms. Geneva, Switzerland: ITU; 2003. Available at: http://www.itu.int/rec/T-REC-P.835
-
Wagener K, Brand T, Kollmeier B. Entwicklung und Evaluation eines Satztests für die deutsche Sprache III: Evaluation des Oldenburger Satztests. Zeitschrift für Audiologie. 1999;38:86-95.
-
Matlab function available on the Mathworks website at: http://www.mathworks.com/matlabcentral/fileexchange/40078-speccompare
Christophe Lesimple is a clinical audiologist, Martin Kuriger is a DSP engineer, and Neil S. Hockley is the senior development audiologist at Bernafon AG in Bern, Switzerland.
CORRESPONDENCE can be addressed to: [email protected]
Citation for this article: Hockley, NS, et al. Evaluation of a Hearing Aid Algorithm to Reduce the Negative Effects of Reverberation. Hearing Review. 2015;21(1):18.