Tech Topic | January 2021 Hearing Review
By Laura Winther Balling, PhD; Oliver Townend, BSc; Lasse Lohilahti Mølgaard, PhD, Caspar Bang Jespersen, MSEng, and Wendy Switalski, MBA, AuD
Widex has long been using real-time artificial intelligence to help hearing aid users customize their sound in the moment. Now the resulting large amounts of real-life user data can also be analyzed using artificial intelligence, revealing meaningful clusters of preferences for distinct listening situations.
Since introducing SoundSense Learn™ (SSL) in 2018 what we believe was the first real-time artificial intelligence (AI) in a hearing aid, Widex has been helping users adjust their hearing aid settings in problematic situations hundreds of thousands of times. In addition to helping hearing aid users improve their sound in real time,1 the programs created by users are also valuable as anonymous data that can advance our understanding of real-life hearing preferences more generally.2
However, just as the A-B comparisons made by a single user cannot cover the entire space of possible SSL settings without the artificial intelligence in SSL,3 the patterns in millions of A-B comparisons across thousands of users cannot be fully understood just by considering the raw data, because the amount of data is simply too great and too complex to decode any patterns. However, exploring them using AI and clustering algorithms allows a fuller understanding of users’ preferences in different situations.
This article focuses on the AI techniques used to analyze SSL data and the patterns that they allow us to observe for different situations of hearing aid use. First, however, a brief explanation of how SSL works is in order.
SoundSense Learn
SSL is a feature in the Widex MOMENT™ and Widex EVOKE™ apps which uses AI to help users optimize their sound.4 This is not intended to replace fine-tuning in the clinic, but to provide users with the ability to resolve specific situations where their immediate hearing needs and preferences are not being met. The information is also fed back to the hearing care professional (HCP) through the Real-Life Insights feature in the Compass GPS fitting software.
SSL allows the user to manipulate gain in three frequency bands, not by having to interact with an equalizer but by simply indicating their degree of preference between two different settings in a series of A-B comparisons. The process starts with the user indicating which situation they are in and what their listening goal is. After this, the user is presented with two sound settings, and they respond by indicating their relative preference for one or the other. Based on this, the AI algorithm calculates two entirely new settings for the user to compare, and the process continues until the desired sound is found. Finding the desired sound typically takes 15 comparisons at most, and it this often happens much faster. The advanced AI of SSL thus allows the user to easily and quickly explore a vast range of hearing aid settings that, without AI, would require over 2 million A-B comparisons to fully cover the gamut of possibilities.3 Hearing aid wearers can use the settings on the spot and can also save them for later use in similar situations.
If we analyze individual programs in terms of their settings in the bass (0.1 to 0.7 kHz), middle (0.3 to 3.6 Hz), and treble (2.2 to 10 kHz) frequency bands, we get Figure 1, where each dot represents a program that a user has created and saved. To avoid cluttering, the figure only includes a randomly sampled subset of programs created between March and October 2020.
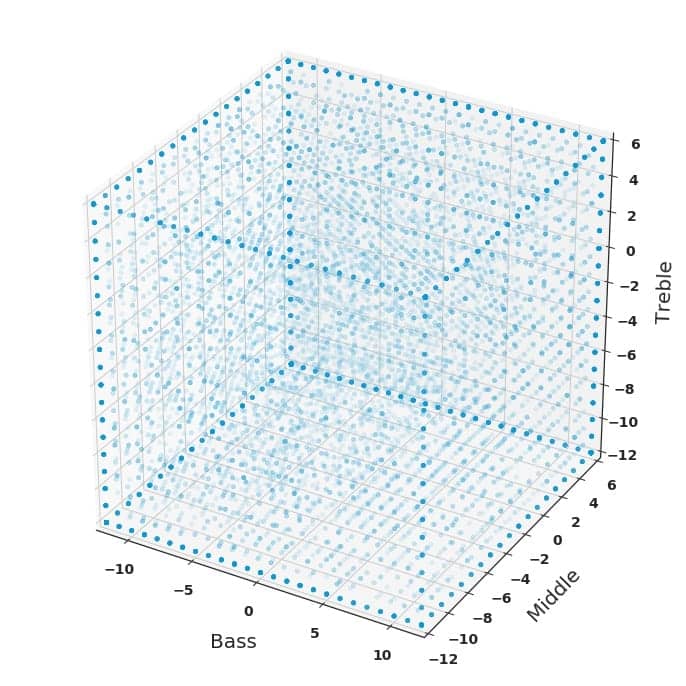
The fact that the programs are distributed all over the three-dimensional space of Figure 1 is important in two ways: First, it shows that adjustments made with SSL are very diverse and completely individual, fulfilling a need that could not be met with a change in fitting rationale—which would for instance have been the case if all the dots had been concentrated in one corner of the cube. Second, the lack of any clusters discernable to the naked eye indicates the need for more advanced analysis, to understand the similarities between sound environments that do exist, also when people are personalizing sound.
Using AI to Reveal Patterns
As described previously, Figure 1 shows the final settings of a subset of SSL programs that users have created; in other words, they represent the solutions that hearing aid users have reached after a number of A-B comparisons. Another way of approaching the data is by analyzing all the A-B comparisons that the users make in their journey towards the final settings. This constitutes an even richer dataset, given that each user makes multiple A-B comparisons in order to reach their final preferred settings. It also represents an interesting alternative view of the SSL mechanism as a preference sensor, a mechanism that maps people’s preferences, as well as a preference optimizer, a mechanism that provides personalized settings for the individual person.5
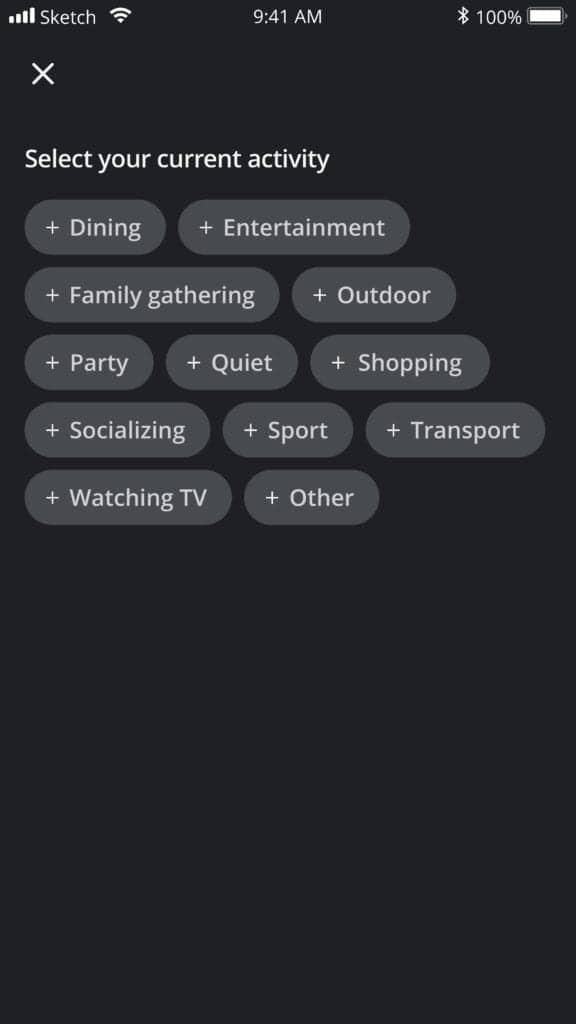
For both ways of considering the data, it is clear that just illustrating the data points as we do in Figure 1 does not reveal any patterns to the human eye. Instead, AI must also be employed to help make sense of the data. Here, we focus on the specific situations that SSL users indicate they are in before beginning the A-B comparisons (Figure 2).
For each of these situations, the analysis relies on A-B comparisons conducted by users in that situation to produce saved programs, capped at 32,000 A-B comparisons per situation for computational reasons. The analysis consists of three steps:
- A probabilistic model (a Gaussian process model)4 is constructed for the given situation, which assigns likelihoods for all possible combinations of settings of the three parameters that SSL controls.
- The Gaussian process model is used to produce 10,000 samples which can be understood as 10,000 predicted or ideal programs representing the preferences indicated in all users’ A-B comparisons for that situation, and
- We fit the Meanshift clustering algorithm6 on these 10,000 predicted programs to summarize the patterns in a concise way for each individual situation.
Importantly, the 10,000 predicted programs are all good suggestions for a specific user in the given situation, but the clustering allows a clearer understanding of the patterns in these programs.
Distinct Preferences for Distinct Situations
Interestingly, it turns out that, for each situation, there are systematic clusters that represent large proportions of the ideal programs for that situation. In general, we see that the clusters cover the data-based predicted programs well: on average, the two strongest clusters per environment account for more than three-quarters of programs (average 79%, range from 49% to 100%). If we look instead at the four best clusters per environment, these provide an almost exhaustive description, covering more than 90% of programs for 8 out of 10 environments. The two environments with most variation in ideal programs are “Socializing” (top 2 clusters cover 60%) and “Entertainment” (top 2 clusters cover 49%), and in fact these situation tags are likely to cover more diverse situations than, for instance, “Transport” (one cluster covers 100%) and “Dining” (top 2 clusters cover 75%).
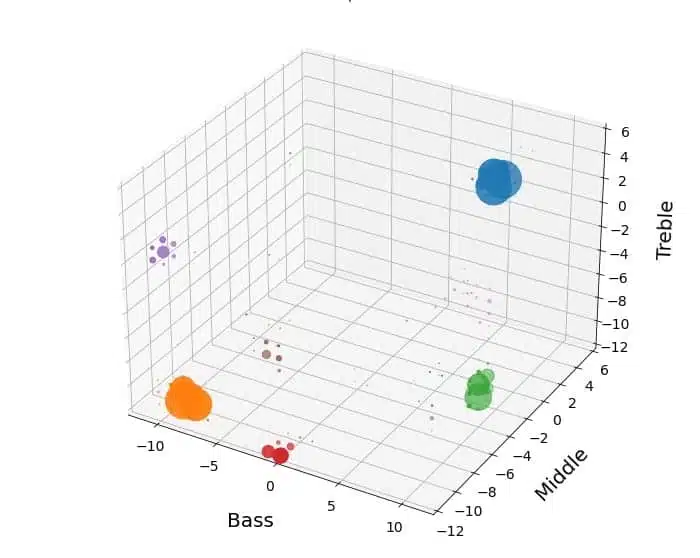
Turning from the coverage of the clusters to their settings, the “Dining” situation is illustrated in Figure 3. Here the most prominent cluster (in blue) is one where the middle and treble frequency bands are turned down, while the bass is kept at the original level or only adjusted slightly. This cluster—which represents the majority of cases (64%)—might reflect users wanting to reduce noise from utensils or wanting to focus more on closer sound sources by reducing the overall level in the higher frequencies. The second most common cluster (in orange, representing 12%) has bass and middle bands turned up, maybe for improved speech understanding, while the treble is kept stable.
Another interesting situation is the “Quiet” situation illustrated in Figure 4. Here, there are two very different patterns that are almost equally frequent: In cluster 1 (blue, accounting for 42% of predicted programs), bass and treble are turned up while middle is kept close to the original or a little higher, probably indicating a wish for more awareness of the surroundings. In contrast, in cluster 2 (orange, accounting for 33%), all three parameters are generally turned down, although less so in the bass, presumably representing a need for less sound in the quiet situations.
An important point about the interpretations of the different clusters is that they are educated guesses. They represent preferences for many individual people in these situations, but they are not representative for every user in the given type of situation—which is exactly the reason why the kind of personalization offered by SSL is important for the individual’s hearing satisfaction.
Perspectives on Individualized Fittings
While it is interesting to analyze the data and speculate what users intended to achieve, we will still come to the same problem that SSL intended to solve: no one knows better about how they wish to hear in the moment than the individual users. Although SSL can intuitively guide users to individual settings in the moment, it is highly probable that certain experiences and preferences for sounds are common to many users. It could therefore be advantageous for an individual user to leverage the experiences of all the users that have been in similar listening situations before them, in the form of analyzed SSL data like what is presented here.
Another interesting aspect of the analysis is that it is dynamic: if the environments or the preferences change substantially, that will be reflected in the probabilistic model for the A-B comparisons, and therefore also in the settings of sampled ideal programs and the clusters of them. This of course requires intelligent management of data and some computing power, but in exchange it offers a dynamic tool for understanding—and potentially responding to—hearing aid users’ preferences as they change. We saw recently that societal changes like the lockdown measures in spring and summer 2020 are reflected in the distribution of environments in which SSL is used,7 confirming that a dynamic model is preferable. At the same time, clusters are, of course, expected to be relatively stable, given the very large number of user preferences the analyses are based on and the diverse versions of each environment they are made in.
Conclusion
SoundSense Learn enables every user to personalize sound quickly and intuitively, leveraging AI in real time to analyze their preferences and provide solutions. Sound improvements are achieved in real-life situations via a simple interface. But this is potentially just the first step in using data to achieve improvements for users. Thanks again to AI, we have been able to analyze the full range of preference data, and these powerful analyses could soon be helping users hear better in real life, faster than before.

Original citation for this article: Balling LW, Townend O, Molgaard LL, Jespersen CB, Switalski W. AI-driven insights from AI-driven data. Hearing Review. 2021;28(1):22-25.
CORRESPONDENCE can be addressed to Dr Balling at: [email protected].
References
- Balling LW, Townend O, Switalski W. Real-life hearing aid benefit with Widex EVOKE. Hearing Review. 2019;26(3):30-36.
- Balling LW, Townend O. Using real-life data to improve real-life hearing. Audiology Practices. http://www.audiologypractices.org/using-real-life-data-to-improve-real-life-hearing.
- Townend O, Nielsen JB, Ramsgaard J. Real-life applications of machine learning in hearing aids. Hearing Review. 2018;25(4):34-37.
- Nielsen JBB, Nielsen J, Larsen J. Perception-based personalization of hearing aids using Gaussian processes and active learning. IEEE/ACM Trans Audio Speech Lang Process. 2015;23(1):162-173.
- Nielsen JBB, Mølgaard LL, Jensen NS, Balling LW. Machine-learning based hearing-aid personalization: Preference optimizer, preference sensor or both? 7th International Symposium on Auditory and Audiological Research. 2019:40.
- Comaniciu D, Meer P. Mean shift: A robust approach toward feature space analysis. IEEE Trans Pattern Anal Mach Intell. 2002;24(5):603-619.
- Balling LW, Townend O, Mølgaard LL, Switalski W. Expanding your hearing care beyond the walls of your clinic. Hearing Review. 2020;27(10):22–25.


Thank you for this really clear presentation.
Big data seems to be great to analyse users preferences according to listening situation.
But the initial tuning of the hearing aids is a big unknown. It would be great to distinguish data between fine tuning with REM and without.