|

|
| H. Christopher Schweitzer, PhD, is director of HEAR 4U International, Lafayette, Colo, and chief of audiology at Able Planet, Fort Collins, Colo. Desmond A. Smith is a research scientist for Acoustimed (Pty) Ltd, Johannesburg, South Africa, and director of digital technology for Able Planet. Correspondence can be addressed to HR or Christopher Schweitzer at . | |
In Part 1 of this two-part series, published in the July HR, we presented a historical review of developments over the past 300 years that have enabled hearing aids to become the most common “treatment” for damaged hearing sensitivity.1 Included were the inspirational horses that James Watt studied in working out the concept of horsepower—the ancestral power units of the microwatts in hearing aids.
Power and energy conversion in the human auditory system is not an easy topic to discuss, partly due to the extraordinary ability of the hearing system to capture descrete sound units over an amazing range of intensities. By way of illustration, consider the 1 cm diameter red spot projected onto a wall by a common laser pointer. That 5 mWatt laser power is 16.7 times greater than the power of a sound of 130 dB relative to normal hearing (by conventional standard of 0 dB HL). Furthermore, while that sound of 130 dB would be so intense as to cause pain to a human listener, a sound with 10-trillionths of that laser-pointer’s power would be just audible (at 0 dB)! That hints at the remarkable energy-conversion capacity of our auditory system. (Alternatively, to emphasize this huge range of power, if a 1 cm diameter laser point were inflated by a power factor of 130 dB, it would theoretically be some 78 times larger than the diameter of the earth!)
What Time Is It?
|
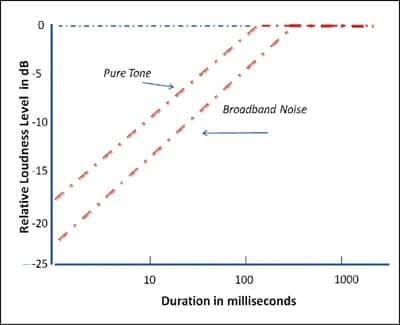
| FIGURE 1. The relation of loudness to duration, adapted from Zwislocki.2 The auditory system accumulates sound energy as it increases in duration, but only up to around 100 milliseconds. For sounds of longer duration, the system “dumps” the excess as it cannot tolerate an infinite accumulation of acoustic energy. |
We also briefly covered in Part 1 the oft-neglected auditory property of “time management.”1 Here, in Part 2, we will extend the discussion of temporal integration and its role in loudness perception, and additionally show how this property can be exploited in audio electronics in such a way as to reduce the risk of over-stimulation (ie, to support hearing preservation).
The reader may recall a time as a child collecting rocks, or shells, or strawberries in a bag or basket. Obviously, in the course of time, the container got heavy or overflowing, possibly forcing the rejection of late arrivals. A more impressive collection might have required discarding the more lackluster samples.
The hearing system performs some rather analogous tricks among its many specialized operations. As a stream of brief acoustical events arrives at the system’s inputs (tympanic membranes), there is a building up of the energy within the first few dozens of milliseconds. Very brief-duration signals require greater amounts of power, relative to longer signals, just to be heard. There’s a proportional influence of duration on loudness for supra-threshold sounds.
But what happens if the source of sound continues for several seconds, or more, as is commonly the case? Does the sound energy continue to accumulate until the sound is infinitely loud? The answer is no; the auditory basket can only admit so many acoustic strawberries.
The collection window of samples of acoustic energy is approximately 100 milliseconds.2 In psychophysics, it would be said that the functional relation of loudness to duration becomes asymptotic at that point. Figure 1 illustrates this important property of hearing. Numerous studies have shown that not only the auditory system, but most other senses as well, operate in such a way as to gather up energy to some maximum accumulation time, and then level off. For example, the eye’s (or optic system’s) ability to sum quanta of light over time reaches its maxima for the optic rods at 100 milliseconds.3 The inverse proportion of intensity and time (Bunsen-Roscoe law) applies as long as the stimulus period is no greater than 0.1 second. Hence, the perception of luminance parallels that of loudness to a noteworthy extent.
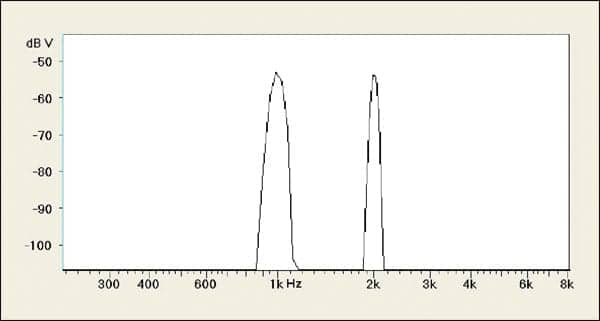
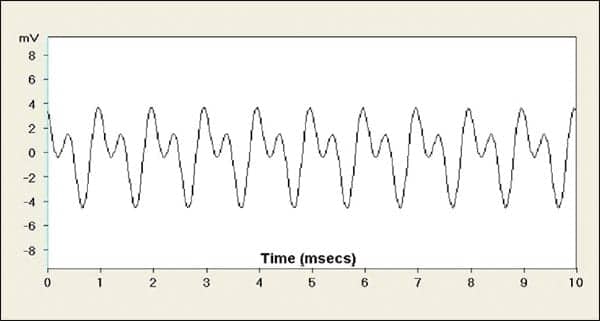
Familiar displays of signals are commonly portrayed in the frequency domain showing intensity against frequency, as shown in Figure 2a or in the time domain showing intensity against time in Figure 2b. However, both Figures 2a and 2b assume (or suggest) that the signal has an infinitely long duration, and thus the standard assumption is that loudness is simply related to signal intensity. In truth, Figures 2a and 2b don’t provide a relationship between loudness and signal duration. Hence, it is easy to forget time-related properties as known to occur with brief acoustic stimuli (Figure 1).
|
| FIGURE 2A. Familiar display of frequency versus sound intensity showing tones of 1000 and 2000 Hz. |
|
| FIGURE 2B. Same tones as in 2a as would appear on an oscilloscope. |
The relationship between loudness and signal duration is further pushed into the background when audiometric puretones for routine tests use presentation durations of 1/2 second or 1 second to deliberately stay well away from the steep part of the temporal summation curve. Hence, clinicians are rarely confronted with this phenomenon. It also has a bearing on the perception of brief plosive speech elements, prompting the development some years ago of an innovative auditory evaluation method with variable duration-damped wave train test signals that mirrored the time properties of speech elements.4
But there’s a dangerous side of temporal integration with regard to hearing damage. There is a fair amount of evidence5-7 that impulsive noise is potentially more damaging than steady-state noise. This may be partly due, perhaps, to the fact that individuals firing weapons and pounding hammers against metal do not as readily perceive the damaging levels of brief explosive sounds because of insufficient loudness integration time.
So, in the case of hearing, it is the amount of energy applied to the ear’s neuroanatomy that determines loudness. Therefore, it should not be surprising that the loudness is directly related to both the intensity and the duration of the signal. Since the loudness of continuous signals is dependent on a fixed time factor (100 msec), it’s possible to calculate loudness directly from the force (sound pressure) pumping energy into the hearing system. Hence, it can be said that loudness is generally related to both the force (SPL) and velocity (motion) at the eardrum. This is not a commonly discussed property of audition, and it is not a linear relationship to either velocity or force. Loudness is, however, linearly related to the amount of energy imparted in the 100-msec “loudness integration window.”
Putting Temporal Integration to Audio Advantage
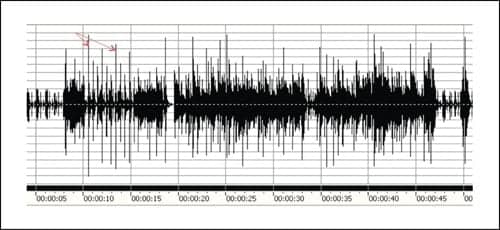
An appreciation of the property of temporal integration is exploited in a recently developed method of signal enhancement8 funded by Able Planet. The new signal processing method brings “softening” properties to Able Planet’s LINX™ system. The approach, which can be rendered in digital or analog forms, operates by instantaneously excising the brief (and therefore less audible) spikes that occur in music and speech, and subsequently increases the average level of the same signal passages (Figures 3 to 5).
In Figure 3, a section of a musical passage is shown in an analysis of amplitude versus time. Many very brief transient spikes are apparent in this recorded passage. What may be less apparent is how little these spikes contribute to a listener’s loudness perception of the passage.
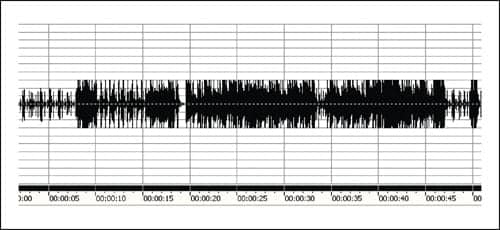
In Figure 4, the brief transient spikes have been removed by a precisely controlled proprietary method of peak clipping. Because the longer duration and more powerful contributors of the passage lie in the middle portions of the waveform, the net loss to loudness, when factoring in the temporal integration properties of Figure 1, is less than 0.5 dB. Hence, brief harmonic distortion components are likewise too brief to achieve significant audibility. Therefore, the sound quality is not disturbed to a notable extent.
When a waveform is clipped for longer periods, distortion is generally a concern. Great efforts have been made to show very low harmonic distortion measurements on the assumptions that such disruptions of “fidelity” are necessarily disruptive. However, it must be recalled that the very identification of an individual voice relates to structured harmonic properties shaped by vocal tract anatomy.
Many rousing discussions have focused on the “good” and “bad” properties of harmonic distortion. What is demonstrated in Figure 4 is that clipping can be managed so that distortion is essentially not an issue.
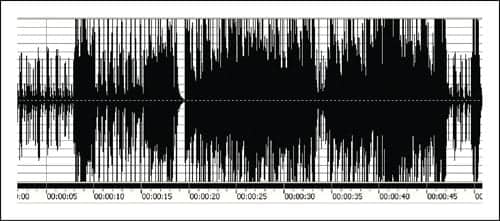
Additional benefits as to speech clarity emerge from this approach of controlled clipping. A kind of “instantaneous compression” can be derived. Figure 5 illustrates how, after the removal of the peaks (without the commonly required AGC feedback loop and associated time constants), the signal can be amplified to an amount equal to the clipping (in this case, 10 dB). This immediately improves the audibility of the soft and mid-level details thanks in part to another psychoacoustic property—the equal loudness contour—which is well known to widen as levels move up away from threshold.
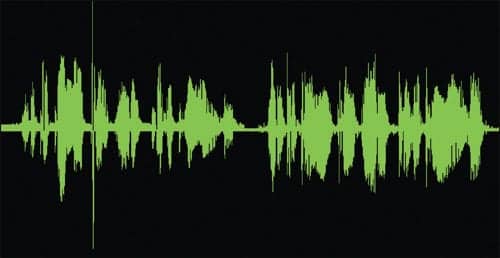
The Able Planet LINX audio treatment also effectively flattens the spectrum (bringing up the higher frequency components relative to the low frequencies) without the usual bias emphasis that often makes amplified sounds have a tinny quality. To illustrate this unbiased “flattening,” the averaged speech of a single sentence spoken by one of the authors is shown in Figures 6a and 6b.
In Figure 6a, the waveforms of a recorded sentence (left) and that same sentence with LINX processing (right) are shown. The final fricative consonant /s/ is clearly increased, while simultaneously a large transient spike has been removed. In Figure 6b, the same sentence has been averaged to show the accumulated spectral properties. Clearly, the processed sample shows a much flatter average spectrum.
|
| FIGURE 3. Example of the amplitude/time properties of a music segment. The majority of the time, the average energy is 10 dB below the brief peaks indicated by the red arrows. |
|
| FIGURE 4. The signal from Figure 3 has now been subjected to 10 dB of controlled clipping by instantaneous limiting of peak power. The “loudness” is not significantly reduced by removing the peaks. However, the potentially damaging spikes have been excised. |
|
| FIGURE 5. After the clipping shown in Figure 4, the music signal has now been amplified or “overdriven” by 10 dB. Average levels of long duration signals are increased, resulting in increased loudness. |
|
| FIGURE 6A. Two waveforms of a male speaker saying the utterance “She took her new pink suit to the cleaners.” On the left is without the Able Planet processing. On the right is the processed speech. Notice the large spike has been removed, and the /s/ of the final consonant has been increased. |
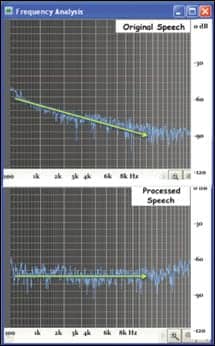
|
| FIGURE 6B. Averaged spectra for the two samples of the sentence in 6a. A clear “flattening” of the spectra is evident in the bottom (processed), yet no high frequency emphasis was applied. |
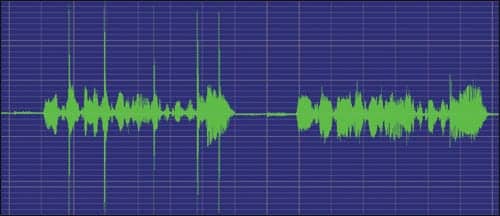
Another example of the instantaneous removal of high-level peaks is shown in Figure 7. Here, a male vocal utterance of a single sentence was produced co-temporaneous with a series of loud “spoon against coffee mug” impulses. The recorded original sample was then analyzed with and without the controlled clipping. The unambiguous removal of the transient peaks can be seen on the right of the figure.
Returning to the damage risk that impulse noise presents to hair cells, the controlled clipping treatment seems to have direct benefit prospects. First, the highest potentially damaging peaks are removed. These energetic transients are often not even perceived as excessively loud due to insufficient temporal integration time. Second, the perceived loudness of potentially damaging levels is more easily recognized as such by a listener due to the fact that there are no inaudible high-level transients. The primary power of the signal has been productively boosted.
But it gets a little more complicated because the principles described above apply equally to long-duration signals. Sound is typically measured with instruments that display the RMS (Root Mean Square) value of the sound pressure, but the loudness experienced is related to the averaged instantaneous power levels. RMS has no physical meaning, but like the word “average” is a mathematical function. RMS is useful, however, because it can be used to calculate average power without knowing the instantaneous power levels in a waveform. RMS is otherwise meaningless, especially when used in the consumer audio industry to specify RMS power levels.
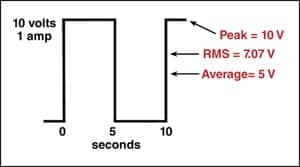
To illustrate why RMS values are used, the example in Figure 8 is instructive. A 10-volt battery is connected to a 10-ohm resistor, and we want to know how much the battery will heat the resistor. From Ohm’s law (see Part 1 of this series), we calculate that the current is 1 amp (10 volts divided by 10 ohms). The rate at which the resistor is heated is determined by the Power—or how fast the potential energy (voltage) can produce the kinetic energy (heat)—which depends on the value of the resistor.
In Figure 8, it can be seen that the battery is switched off half the time. In the first 5 seconds, there is the situation of 10 volts and 1 amp, producing 10 watts for 5 seconds. In the next 5 seconds, we have no power, so the average power is 5 watts.
But suppose a simple meter was employed to measure the average voltage, which was then multiplied by the average current. This would indicate an average of 5 volts and an average of 0.5 amps, which gives a power of:
5 volts x 0.5 amps = 2.5 watts
…only half the correct value. One could, of course, simply multiply this result by 2 to get the correct power and energy levels, but that would only work for square waves. For sine waves and other waveforms, such as white noise, the RMS/average ratios are quite different.
RMS comes to the rescue when it is not convenient to calculate power from a detailed analysis of the waveform. To calculate the RMS value in Figure 8, we would have to 1) square the voltage; 2) find the average; then, 3) find the square root. In this example, the square of 10 volts is 100 volts. The average of the squared value is 100 volts for 5 seconds plus 0 volts for 5 seconds, which equals 50 volts. Now, if we find the square root of 50 volts, we get the RMS voltage, which is 7.071 volts.
|
| FIGURE 7. The sentence, “They returned from their vacation on the 16th of July,” was recorded by a male speaker simultaneously with loud regular impulses from cutlery. The recording was then analyzed without (left) and with the LINX™ processing technique (right). The peaks are obviously removed in the processed sample. |
|
| FIGURE 8. Example of a waveform with an average level of 5 volts and an RMS level of 7.071 volts. |
|
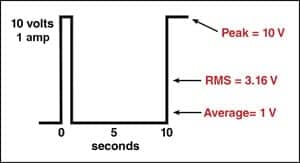
| FIGURE 9. Example of a waveform with high peak levels. |
If we want to know the “heating effect,” we must also find the RMS value for the current in the 10-ohm resistor, which turns out to be 0.7071 amps. Clearly, the RMS values for the voltage and the current bear no relationship to any actual values in the example. However, we now find that, if the RMS levels of voltage and current had been measured with a true RMS meter, we could use Ohm’s law to calculate the average level or ‘heating power” of the circuit. Note that 7.071 volts 0.7071 amps = 5 watts—the true average.
Therefore, although RMS has nothing to do with any actual physical quantities, by a little bit of mathematical magic, we can calculate the correct average value of a varying voltage (or complex sound wave) regardless of the waveform of the electrical or acoustic waveform. It works just as well for square waves, sine waves, white noise, or a series of brief peaks provided the resistance (or impedance) of the circuit remains constant.
There is, however, a problem with RMS measurements because they don’t tell the whole story. For example, consider a repeating waveform that consists of 10 volts presented for 1 second followed by 9 seconds with no voltage (Figure 9). To get the same average as a square wave, we’d have to increase the peak voltage to 50 volts. But suppose we had put a fuse in the circuit that was designed to blow at 20 volts (2 amps). The experiment would fail because the voltage could never get to 50 volts.
By now, the reader will hopefully see how this argument leads to hearing preservation. The RMS levels measured by sound level meters can only be used to calculate average instantaneous sound pressure levels. They are uninformative about brief sound pressures that may occur in complex waves—levels that may be “blowing fuses” in the cochlea.
| ADDITIONAL READING: Introduction: Occupational Hearing Conservation and Hearing Protectors, by Marshall Chasin, AuD, and Lee D. Hager. March 2007 HR. What’s So Special About Music? by Lawrence J. Revit, MA. February 2009 HR. Performing Musicians and Hearing Aid Design. Four-part podcast, March 12, 19, 26, and April 2 featuring Larry Revitt, MA, Mead Killion, PhD, and Marshall Chasin, AuD. Available at: www.hearingreview.com/sciencetech. |
It is common and appropriate to warn people about exposure to industrial noise at 85 dB for more than 8 hours per day. But it takes only a few milliseconds at 140 dB to cause visible hair cell damage that can be clearly seen under a microscope. This is why the use of a method, such as we have described in the LINX processing, that effectively and instantaneously excises high-level transients has merit in support of hearing protection—in addition to the speech intelligibility benefits also described to a brief extent in the preceding pages.
Conclusion
This two-part article provided a review of the fundamental history and several often-confusing principles of mechanical and electrical power, force, energy, and their relation to time, audition, and amplification.
In Part 2, we further elaborated on physical properties of acoustical power that contribute to the range of auditory sensations from soft to loud. We also illustrated how an appreciation of some of these premises, especially those related to temporal integration, allowed for the design of an innovative amplification approach that exploits properties of psychoacoustics to introduce a protective approach to sound processing and intelligibility enhancement.
References
- Schweitzer HC, Smith DA. Horsepower to hearpower. Hearing Review. 2009;16(7):10-15.
- Zwislocki JJ. Temporal summation of loudness: an analysis. J Acoust Soc Am. 1969;40(2):430-441.
- Ohatani Y, Okamura S, Ejima Y. Temporal summation of magnetic response to chromatic stimulus in the human visual cortex. Neuroreport. 2002;13(13):1641-1644.
- Schweitzer HC, Smith DA, Kepler L. Incorporating durational components to sound field hearing aid measures: Early clinical results with “acoustometry.” Presented at the annual meeting of the American Academy of Audiology;1991; Denver.
- Henderson D, Hamernik RP. Impulse noise: critical review. J Acoust Soc Am. 1986;80(2):569-584.
- Starck J, Toppillo E, Pyykko I. Impulse noise and risk criteria. J Noise Health. 2003;5(20):63-73.
- Murphy WJ, Byrne DC, Franks JR. Firearms and hearing protection. Hearing Review. 2007;14(3):36-38.
- Smith DA, Schweitzer HC. Method and Apparatus for Auditory Enhancement and Hearing Conservation. US Patent File ABL004.325847;2008.
Citation for this article:
Schweitzer HC, Smith DA. From horsepower to hearpower, Part 2: Amplification for clarity and hearing conservation. Hearing Review. 2009;16(13):20-24.


