Tech Topic | August 2019 Hearing Review
Hearing aids continue to offer special programs for special listening needs. But just how good are these programs, and what types of preferences do hearing aid wearers have when using them? This study compares two special programs with the Universal program in Widex EVOKE hearing aids. Along with some revealing insights into fitting individual patients, the results demonstrated that both special programs performed the job they were designed to do, and the overall study shows the potential benefits of providing special programs for special listening situations and individual preferences.
Introduction
The fundamental task of a hearing aid is to accommodate the listening needs of the wearer in all possible situations encountered in everyday life. With wearers, situations and listening needs all varying a lot, this task is indeed challenging. The task has fueled—and is still fueling – the development of a variety of features that aim at making hearing aids adapt automatically to the auditory reality (Smeds and Wolters 2017)of the wearer. During the last decades, Widex has developed a multitude of such features, and the features are continuously improved to offer even better automatized performance. For example, the launch of Widex EVOKE included improvements of the functionality of the Fluid Sound Technologies (the elements of the Widex sound classification system, Kuk (2017)) and the Variable Speed Compressor (Kuk et al, 2018). The results of these advances have been high levels of satisfaction reported by EVOKE wearers in a variety of real-life situations (Balling et al, 2019).
However, even with the advances in automatized processing, the need for other and more personalized solutions is still experienced by some wearers in some situations. The inherent issue with automatized processing is that it is based on assumptions that may be correct for many wearers in many situations—but in some situations the same assumptions may be wrong for wearers who, for example, may have a completely different listening intention in a particular situation than the one assumed by the algorithms that control the processing. Furthermore, personal preference is an important factor that may be difficult to account for. Not only does personal preference vary across wearers, it sometimes also varies across time for the individual wearer. Thus, the processing that is preferred in a given situation on a given day may be different from the processing preferred in the same situation on another day.
The need for more personalized hearing solutions has been addressed in different ways. One of the most well-known methods is to give the wearer access to additional programs (settings of hearing-aid parameters) that can be manually selected in situations where the basic default program does not fully meet the needs of the wearer. A number of research studies, eg, Keidser et al (1995), Keidser (1995) and Kuk (1992), and many years of clinical experience have shown how additional programs may offer benefits in certain types of situations.
To expand the range of personalization options, Widex EVOKE introduced two new additional programs—Impact and Comfort—to supplement the automatized processing provided by the Universal program. These two programs serve different needs and are intended for different situations and listening intentions. In this article, we will describe the programs and present the results from a study— performed in the lab and in real life—that evaluated the two programs in different types of situations and for different listening tasks and intentions.
The Impact and Comfort Programs
The Impact program in Widex EVOKE was designed to provide more speech cues to the wearer—and thereby improve speech intelligibility—in situations where some speech cues may be audible but where the wearer still struggles to understand everything. In brief terms, this has been obtained by optimizing the setting of the Speech Enhancer (Kuk and Paludan-Müller, 2006), by making the fast part of the Variable Speed Compressor (Kuk et al, 2018) more expansive, and by providing more gain at high frequencies, compared to the Universal program. As seen in the waveforms and spectrograms of a processed speech signal, which are presented in Figure 1, the effect of the Impact program is a reinforcement of the temporal and spectral contrasts in the speech signal, as compared to the processing performed by the Universal program. Thus, the peaks in the speech signal are amplified more, and the soft parts (and pauses) in the speech receives less amplification with the Impact program. The result is a more distinct sound of the speech, especially the high-frequency consonants, which in some situations will make the speech easier to understand. However, these processing changes are not without consequences. The sound of the speech may be perceived as sharper and less natural than the Universal processing, and this explains why the Impact processing is implemented as an additional program and not as part of the Universal program. Some wearers may like the sound—or be indifferent to the sound quality when they are offered an improved ability to understand speech—while others may be more reluctant to accept it.
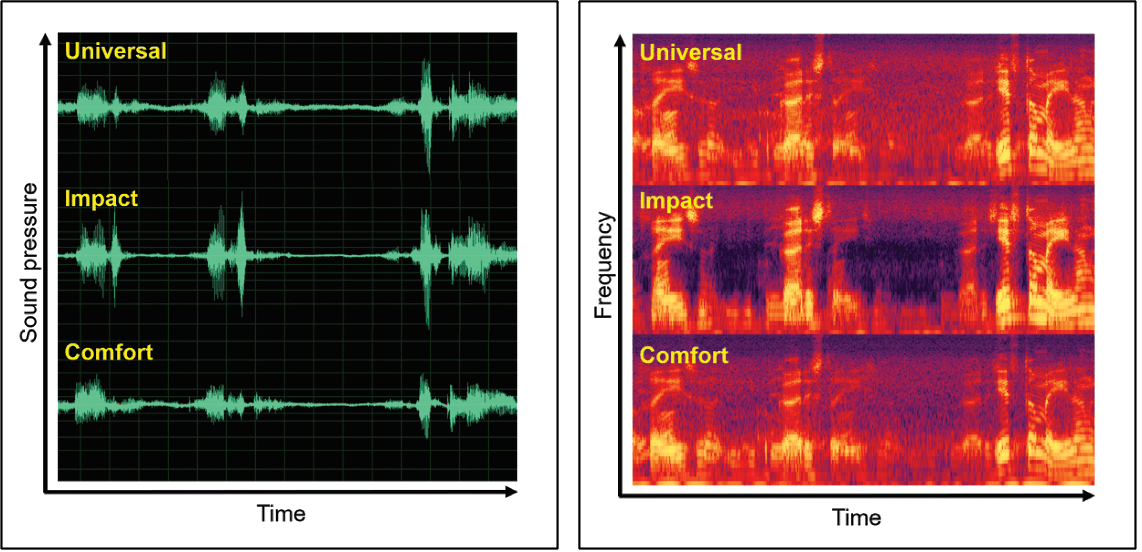
Figure 1. Waveforms (left panel) and spectrograms (right panel) for a speech signal in a soft background noise processed by the Universal (top), Impact (middle), and Comfort (bottom) programs. In the spectrograms, brighter colors indicate higher intensities.
Long-term connoisseurs of Widex hearing aids will remember the Comfort program offered by Widex DIVA. The new Comfort program in Widex EVOKE is based on the same underlying idea: To offer a more comfortable listening experience while maintaining the wearer’s auditory connection with the environment. While the program provides a significant gain reduction for loud and very soft input signals, signals at moderate levels are less affected. This is demonstrated in Figure 1, where a comparison of the waveforms and spectrograms generated by the Comfort and Universal programs when processing a speech signal shows that the Comfort program attenuates the highest peaks in the speech but preserves many of the other speech cues. Even though this may result in a reduction in speech intelligibility, the wearer will be in contact with the environment and will obviously have the option to switch back to the Universal (or the Impact) program if the wish to understand the speech supersedes the wish for comfort. The effect of the Comfort program is more substantial for louder (noise) signals, where the gain reductions become more significant.
Study Methods
We conducted a study to compare the Impact and Comfort programs to the Universal program in sound scenarios relevant for the two programs. The study involved two visits to the lab for each participant, with a field trial period in between. At the first visit, the participants were fitted with the Widex EVOKE test hearing aids and instructed in the assessment task that they had to complete in the following field trial period of approximately two weeks. At the second visit to the lab, the participants performed two different lab tests to assess the programs under controlled conditions.
Participants. A total of 16 participants (5 females) with a sensorineural hearing loss within the fitting range of the test hearing aids were recruited for the experiment. They had a mean age of 69.9 years (SD: 8.5 years), and their mean pure-tone average (PTA) at 0.5, 1, 2, and 4 kHz was 49.3 dB HL (SD: 10.7 dB HL). One participant (female) dropped out after a few days of the field trial, because she did not want to continue the assessment task (see below). All participants gave their written informed consent prior to participation.
Hearing aids. The test hearing aids were Widex EVOKE Fusion 440. The hearing aids were fitted with custom moulds or instant closed ear tips (but no open fits) using the recommended Widex fitting procedure (incl. measurement of a Sensogram and completion of the feedback test). All hearing aids were fitted with three programs: Universal, Impact and Comfort. During the field and lab assessments (see below), the Universal program was locked in the Party sound class to avoid unintentional switching between sound classes. During normal use (between assessments) in the field trial period, the participants only had access to the Universal program.
Ecological Momentary Assessment (EMA). To evaluate the Impact and Comfort programs in the participants’ everyday life, the EMA methodology was used (Shiffman et al. 2008). In contrast to traditional self-assessment questionnaires used for (retrospective) evaluation of the listening experience at the end of a field-trial period, the EMA approach allows assessment of a given listening situation while it is experienced by the participant, by prompting the participant to answer questions about their listening experience while it happens. This approach thus eliminates the recall bias associated with the traditional approach. In recent years, the EMA method has gained popularity within a variety of research fields, incl. audiological research (Wu et al, 2015; Timmer et al, 2017), not least due to the widespread use of smartphones that allow for an effective and convenient user interface to be established.
In this study, we used a proprietary EMA app developed by Widex for research purposes (Jensen, Hau, Lelic, et al, 2019). The app allows controlling and retrieving data from a set of hearing aids while the participant performs the EMA task. All participants were equipped with an iPhone with the EMA app installed, and a Pro Link device allowing for communication with the hearing aids. The participants were instructed to start the app and complete the EMA procedure in situations where they had a need for (and focus on) either speech clarity (defined as a precise and distinct presentation of the speech of interest) or listening comfort (defined as a comfortable and effortless listening experience that can be tolerated for a long time). When starting the app, the participants first stated their current focus (ie, clarity or comfort). Then, depending on their answer, they were asked to perform one of two paired program comparisons: Impact vs. Universal (in case of clarity) or Comfort vs. Universal (in case of comfort). The comparison was controlled by the app, allowing the participant to switch between the programs using two buttons labelled A and B (randomly assigned to the two programs). The preference between the two programs was rated by placing a slider on a scale from -5 (strong preference for A) to +5 (strong preference for B), with 0 indicating no preference. In the Impact vs. Universal comparison, the participants were asked to base their preference on speech clarity. In the Comfort vs. Universal comparison, the preference should be based on listening comfort. The preference rating and hearing aid data on the detected sound class (at the time when the assessment was started) were saved for further analysis.
Just Follow Conversation (JFC). The ability to follow speech in the presence of background noise was assessed using a JFC test approach. The aim of this test is to determine the signal-to-noise ratio (SNR) at which a participant is just able to follow running speech being presented in the presence of background noise. One benefit of the JFC approach, compared to other adaptive speech intelligibility tests, is that offers a high level of ecological validity by using connected speech presented at realistic SNRs (Smeds et al, 2015).
The JFC test used in the present study was based on the approach used by Hygge et al (1992) and Larsby and Arlinger (1994). The speech stream was taken from an audiobook (a Danish translation of Persuasion by Jane Austen), narrated by a female speaker where all pauses were truncated to not exceed 250 ms to create a fast and steady speaking tempo. The speech was mixed with a sound scenario recorded in a canteen and presented from a single loudspeaker in a listening room, at 0 degrees azimuth. The level of the noise was fixed at 60 dBA. Using an iPad interface, the participants were asked to adjust the level of the speech (in 1-dB steps) to reach the SNR where they were just able to follow the story being narrated. This SNR was then the outcome of one run of the test. Each participant was tested in four conditions: Unaided and aided using each of the three programs: Universal, Impact, and Comfort. For each test condition, six JFC runs were completed, with the initial SNR of the runs changing between +/- 10 dB SNR (or 0 and +10 dB SNR for the unaided condition). The unaided condition was always completed first, while the order of the three hearing aid programs was counterbalanced across participants. Prior to the actual test, a training round was performed unaided with three runs instead of six. For two participants who could not perform the test unaided, the training was instead done using the Universal program.
Rating of listening comfort. Participants were presented with four sound scenarios in a listening room with sound presented from eight loudspeakers (at 0, +/- 45, +/- 90, +/- 135, and 180 degrees azimuth) at realistic sound levels. The scenarios included a train station (63 dBA), a cocktail party (69 dBA), a canteen (69 dBA), and city noise (68 dBA). During the test in each scenario, the participant was able to switch between three hearing aid programs (Universal, Impact and Comfort) using buttons labelled A, B, and C on an iPad interface. To blind the participants to the identity, the three programs were randomly assigned to the three buttons in each scenario. The participants were asked to switch between the programs and rate the listening comfort for each of the three programs on an 11-point scale, going from 0 to 10. The presentation order of the four scenarios was counterbalanced across participants. Prior to the actual test, the participants completed a training trial in a fifth scenario (train ride) in order to get familiar with the task.
Results
In the following, the results from the EMA trial and the two lab tests will be presented. The EMA trial data include results from all 16 participants (incl. the one who dropped out of the study during the trial), while the lab results are based on data from the 15 participants who completed the entire study.
Real-life assessments
During the EMA trial period, the participants made a total of 179 speech clarity assessments and, by pure coincidence, the same number (179) of listening comfort assessments. Not surprisingly, there was a substantial individual variation in the number of assessments made during the trial. The participants made between 2 and 42 assessments of speech clarity and between 2 and 38 assessments of listening comfort.
In the presentation of the EMA results, the data will be grouped according to the sound class read from the hearing aids in the moment when the assessment was initiated by the participant. This allows a basic differentiation between assessments made in different types of sound scenario. For the sake of simplicity and to avoid sound classes with very few observations, data from pairs of EVOKE sound classes with and without speech are pooled (e.g. Urban includes the sound classes Urban and Urban with Speech), and data from the two Music sound classes are also pooled. This reduces the number of sound classes from 11 to 6, without affecting the overall conclusions.

Figure 2. Top: Box plots of the EMA speech clarity preference ratings in the Impact vs. Universal EMA paired comparisons, grouped by sound class. Positive ratings indicate Impact preference. Boxes indicate 25, 50 (median), and 75 percentiles, and whiskers indicate 5 and 95 percentiles. Mean values are indicated with filled squares. Outliers are marked with crosses. Bottom: Number of preferences for each program, for all situations and by sound class. “No preference” ratings are indicated as “None.”
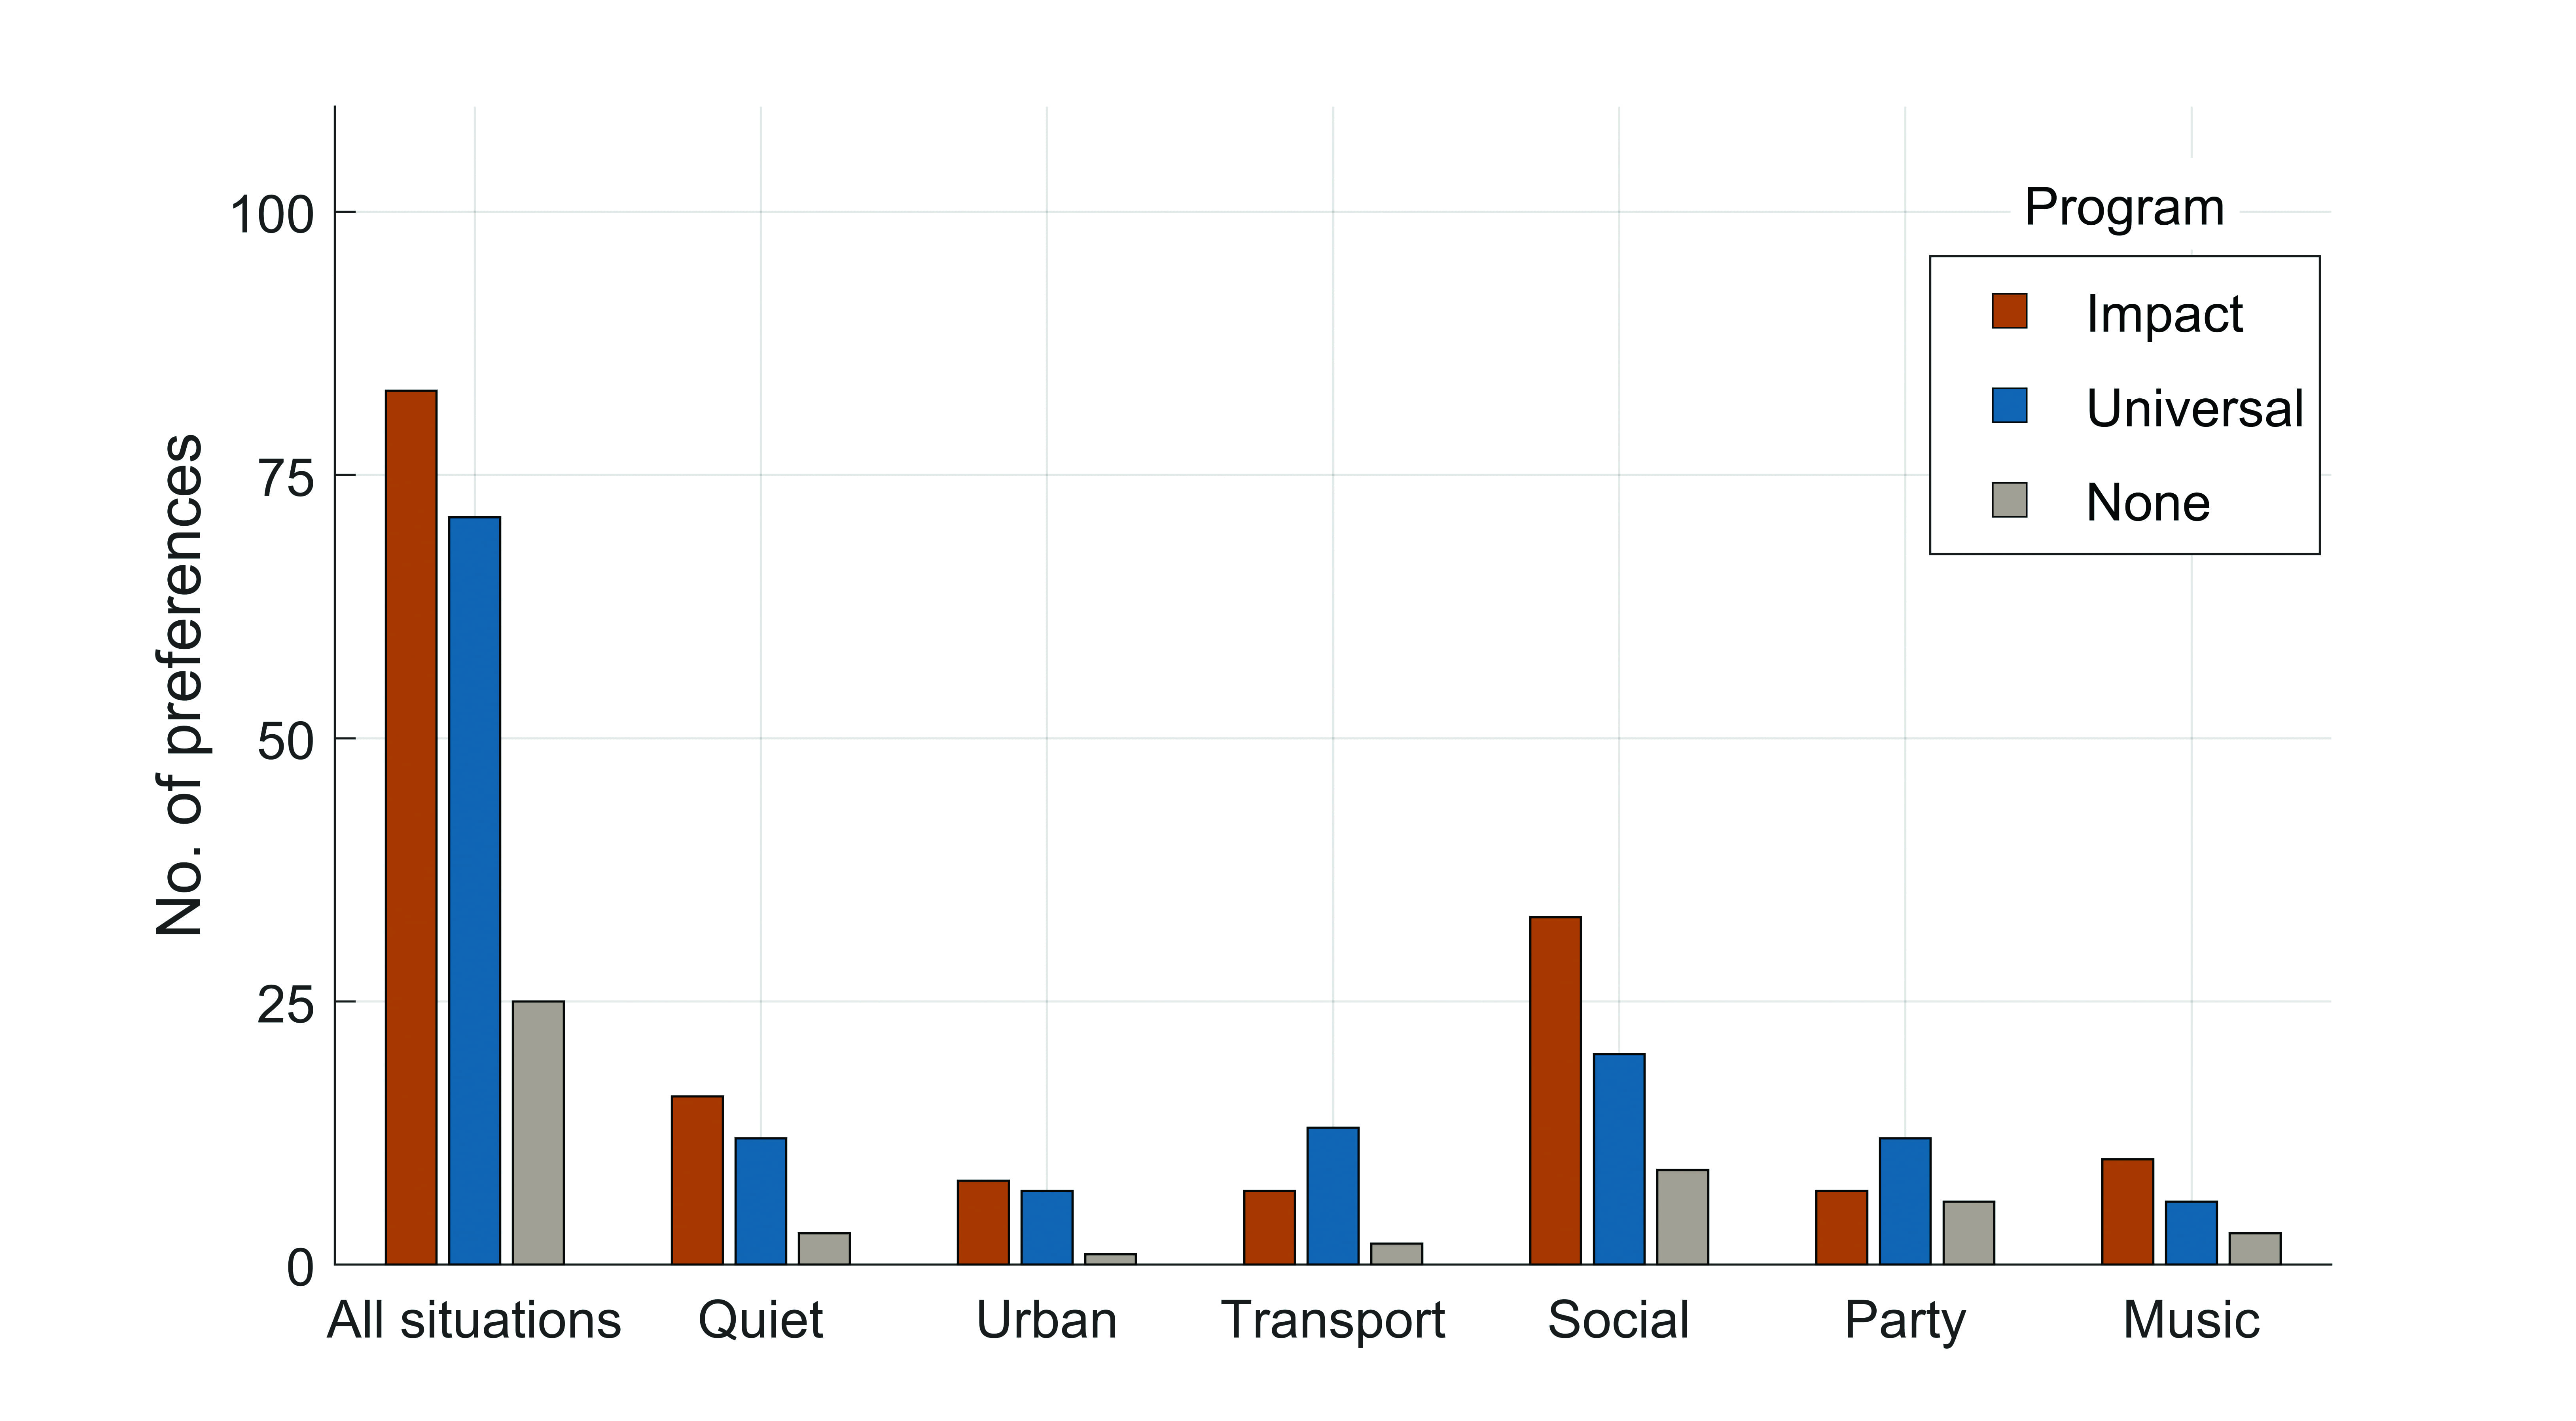
The top panel in Figure 2 includes box plots showing the distribution of ratings of the speech clarity preference between Impact and Universal. In this type of plot, median values of 0 indicate an equal number of preferences for Impact and Universal, with values above 0 indicating more preferences for Impact (than for Universal), and vice versa for median values below 0. The bottom panel of Figure 2 shows the number of preferences for each program (and number of no preference ratings) in the paired comparisons, across all situations and for each type of situation (ie, sound class). This plot also indicates the number of assessments made for each type of situation.
Several observations can be made for Figure 2. Across all situations, ie, when pooling all data, a general preference for Impact is observed. However, it is noticeable that preferences for both programs are observed in all sound classes, and that preference varies between sound classes. The clearest preference for Impact is observed in situations corresponding to the Social sound class, and trends towards Impact preference are also observed in the Quiet, Urban, and Music situations. Preferences for Universal were observed in situations corresponding to the Transport and Party sound classes.
In the bottom panel of Figure 2, it is interesting to see that the situations in the Social sound class are those where participants most frequently decided to make the speech clarity assessment. This makes sense since these situations are always characterized by the presence of speech. The situations could, for example, include a dinner in a dining room or a business meeting in an office where a group of people are engaged in conversation. These are exactly the type of sound scenarios for which the Impact program is designed to have an effect, so there is a good correspondence with the observation that the largest Impact benefit was observed in the Social situations.
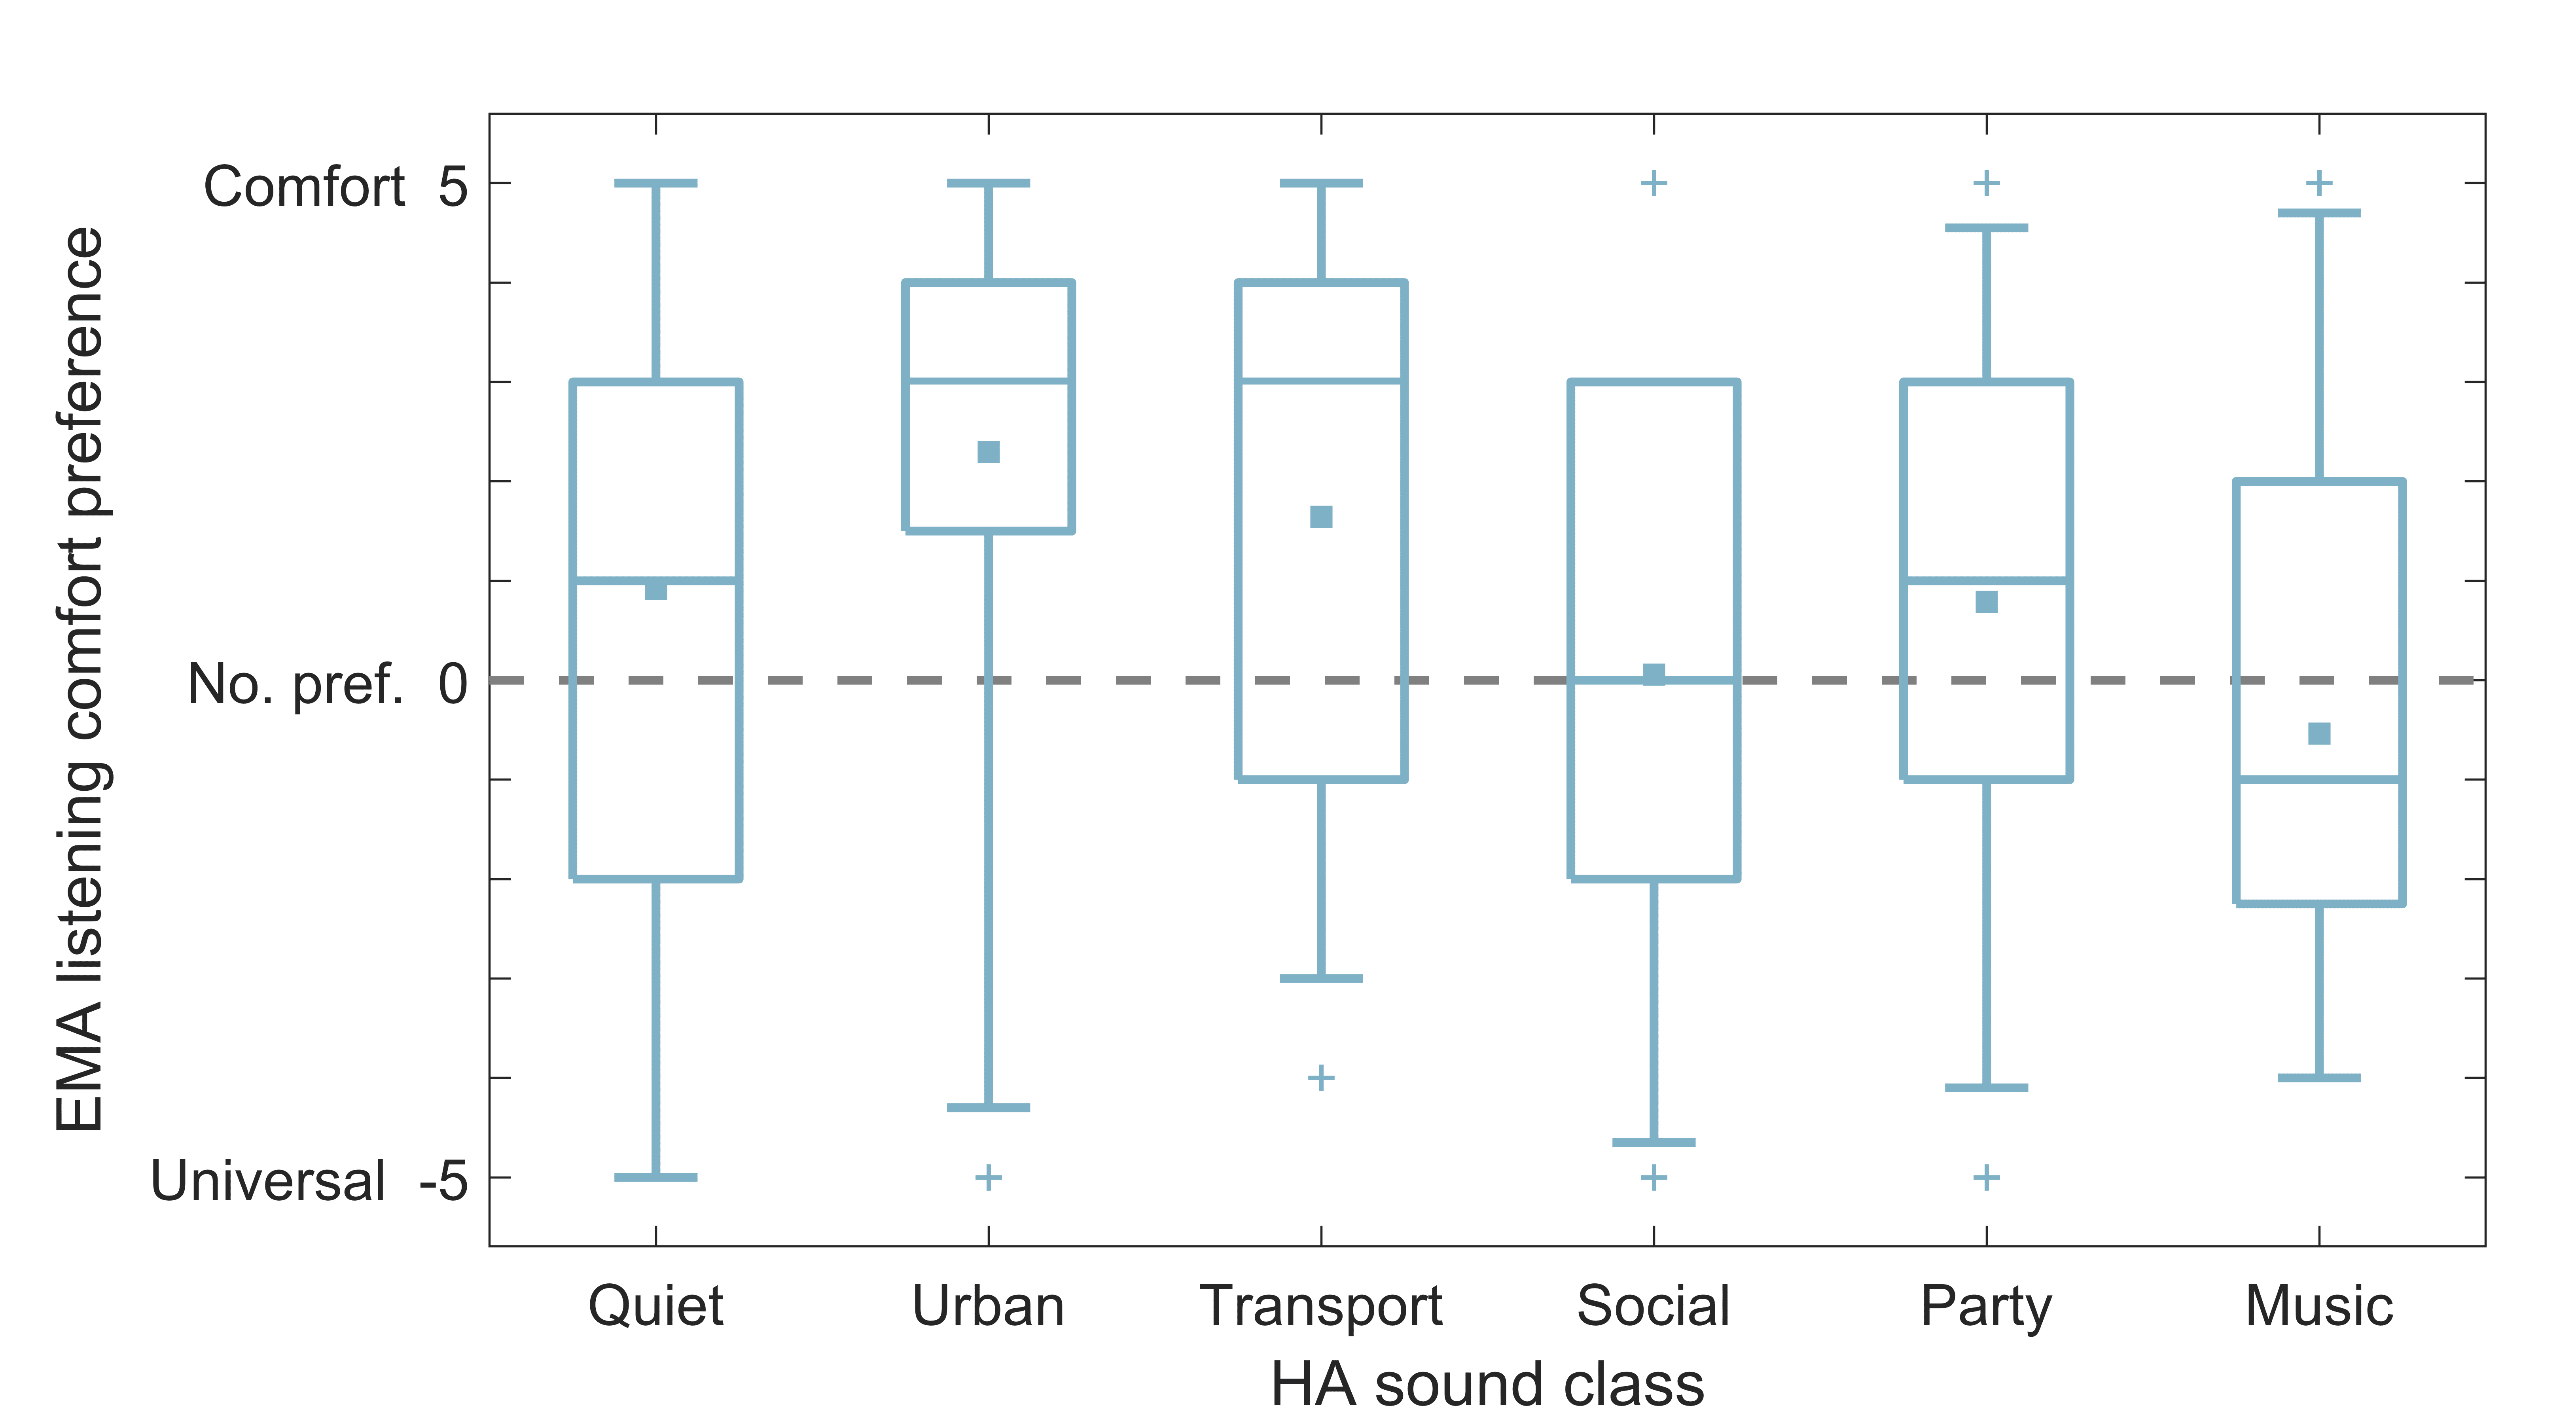
Figure 3. Results of EMA listening comfort preference ratings in the Comfort vs. Universal paired comparisons, shown in the same way as the speech clarity preference ratings in Figure 2.
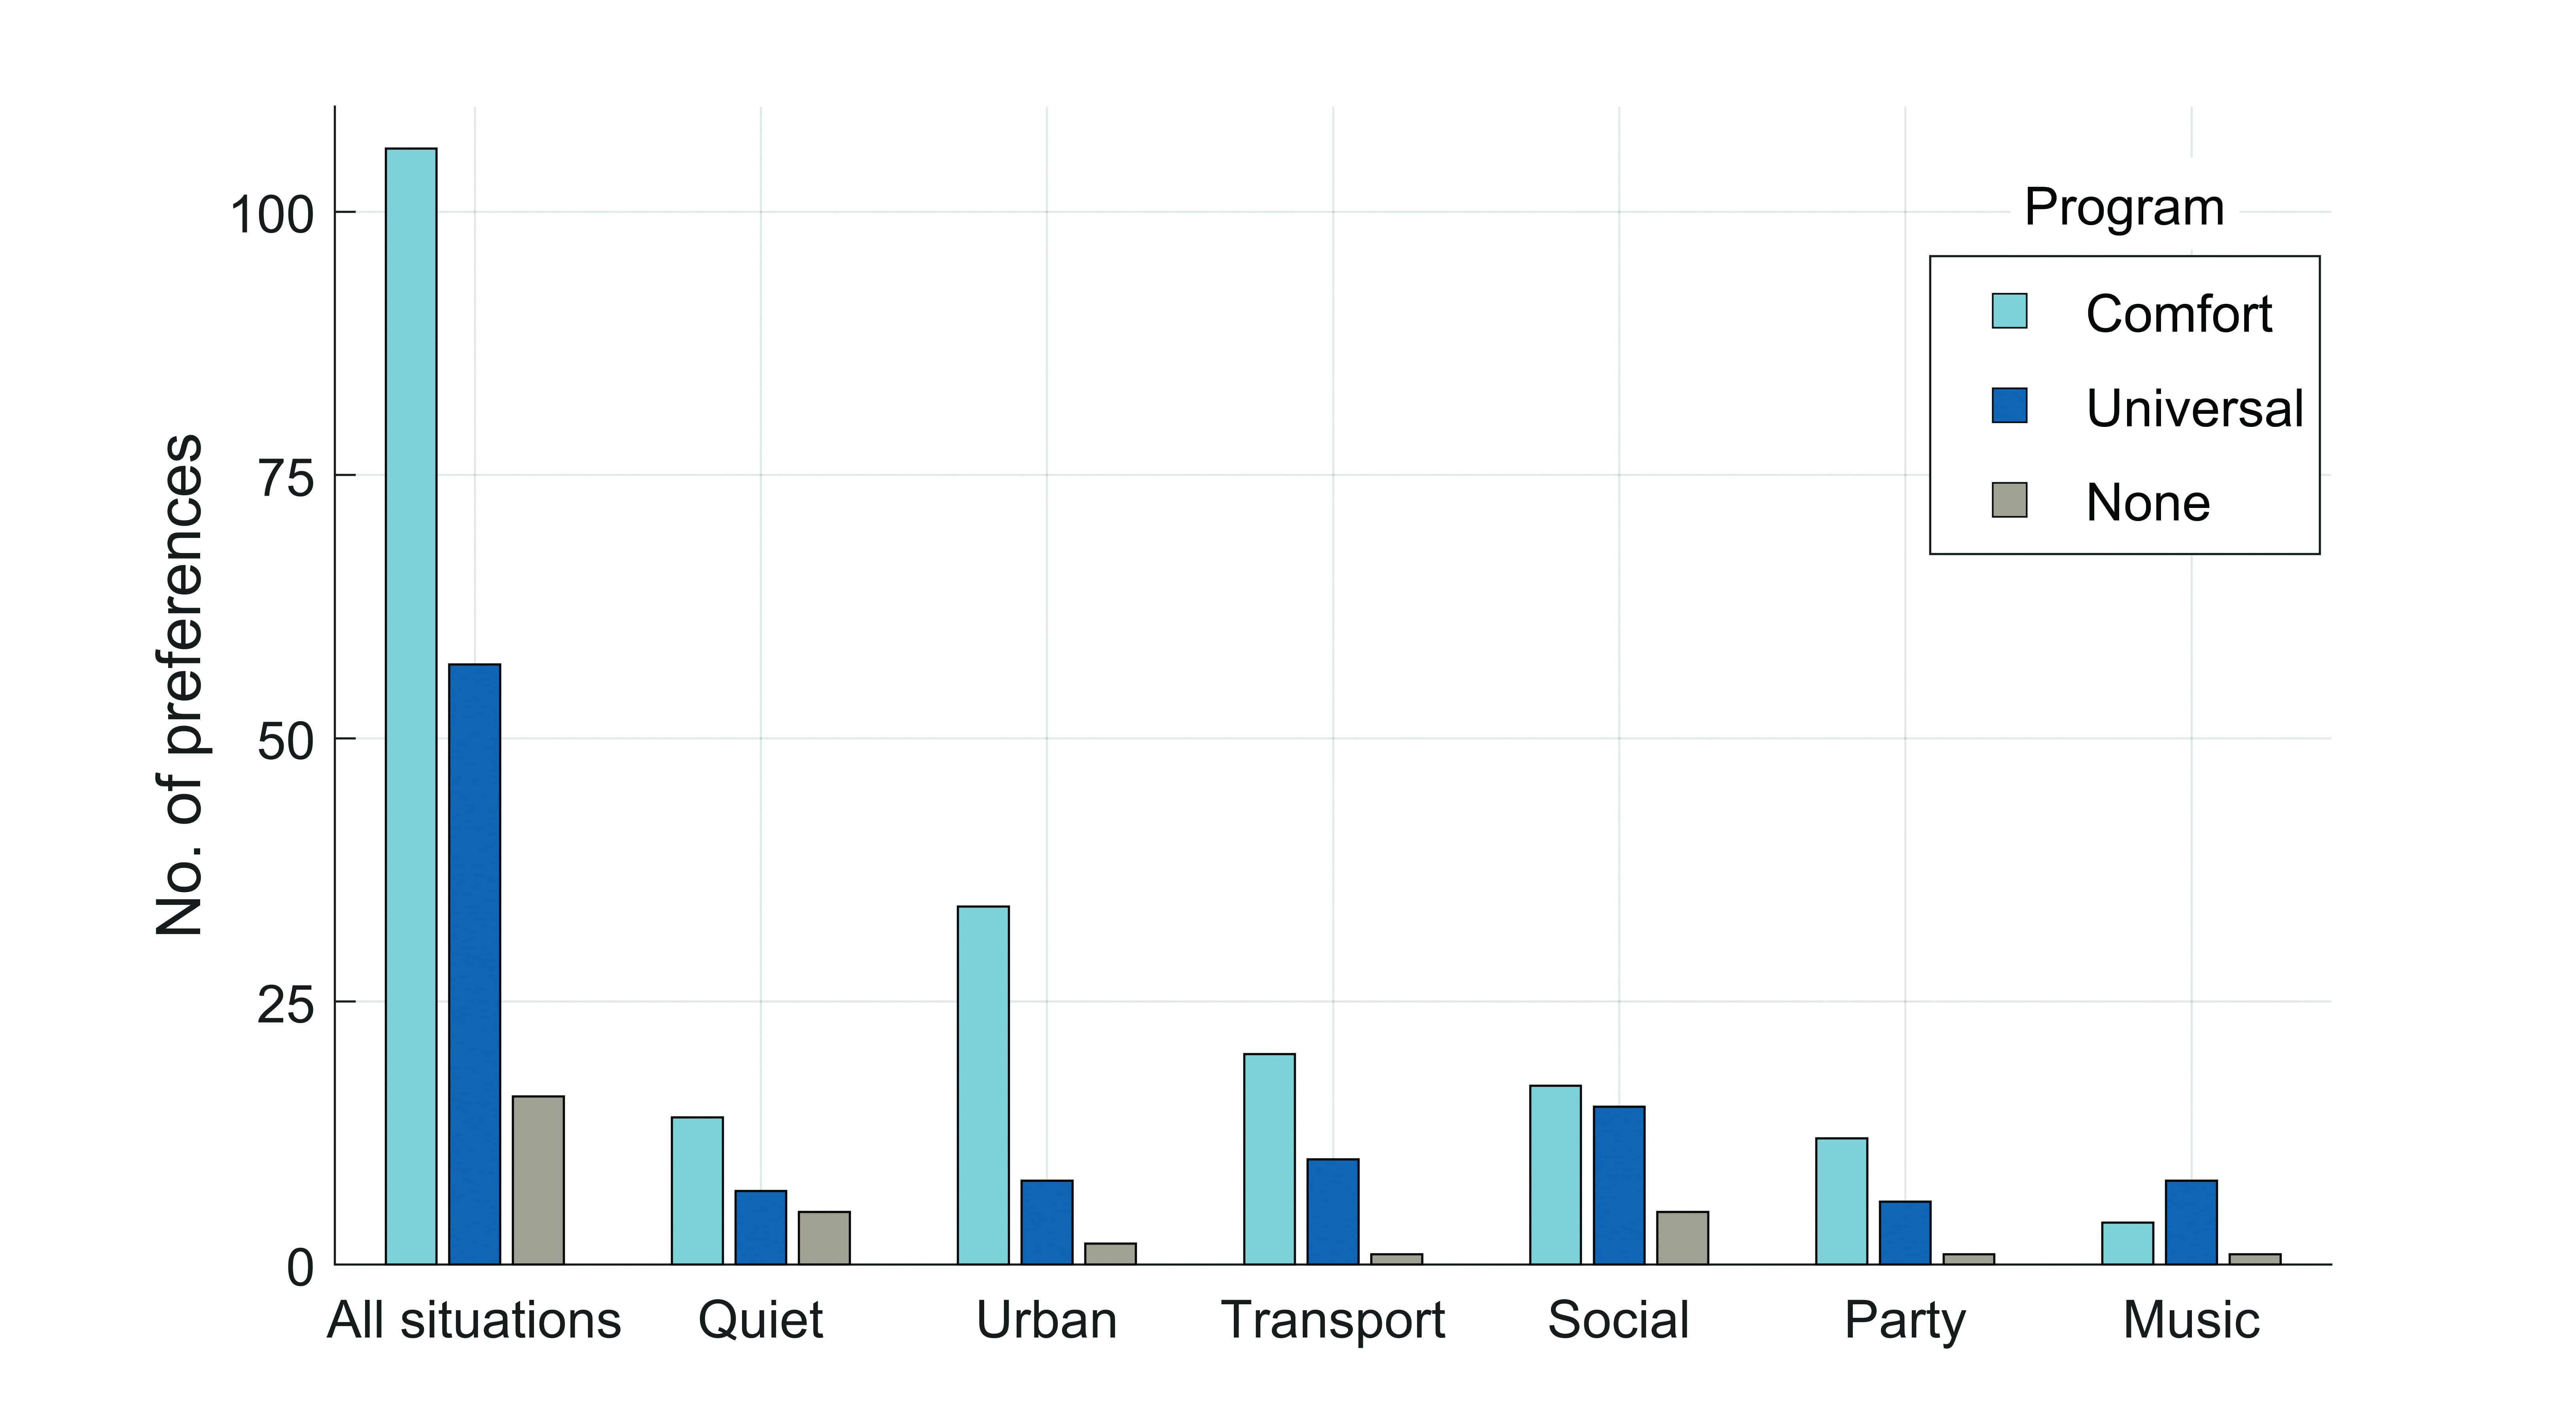
Figure 3 shows the results from the listening comfort preference ratings made during the EMA trial, displayed in the same way as the speech clarity data shown in Figure 2. The figure shows an overall preference for the Comfort program, with more Comfort than Universal preferences observed in five out of the six sound class groups. Not surprisingly, the clearest Comfort preferences were observed in the Urban, Transport, and Party situations, which are often characterized by high levels of background noise. It is interesting to notice that a relatively high number of assessments were again made in Social situations, and that there is an almost equal number of preferences for the Comfort and Universal programs in these situations. Together with the fact that the Social situations appeared frequently in the speech clarity assessments, this demonstrates how listening intentions and needs may vary within the same type of listening situation, and it shows that different hearing solutions may be preferred.
Looking at the distribution of EMA preference ratings made by the individual participants (not shown), it is interesting that there were no clear and unambiguous preferences for one of the programs (in neither the speech clarity nor the listening comfort ratings). Instead, the individual participants expressed preferences for both programs (or no preference) at different times during the trial. This indicates that even if one program tends to be preferred in many situations, there may still be situations where another program does a better job.
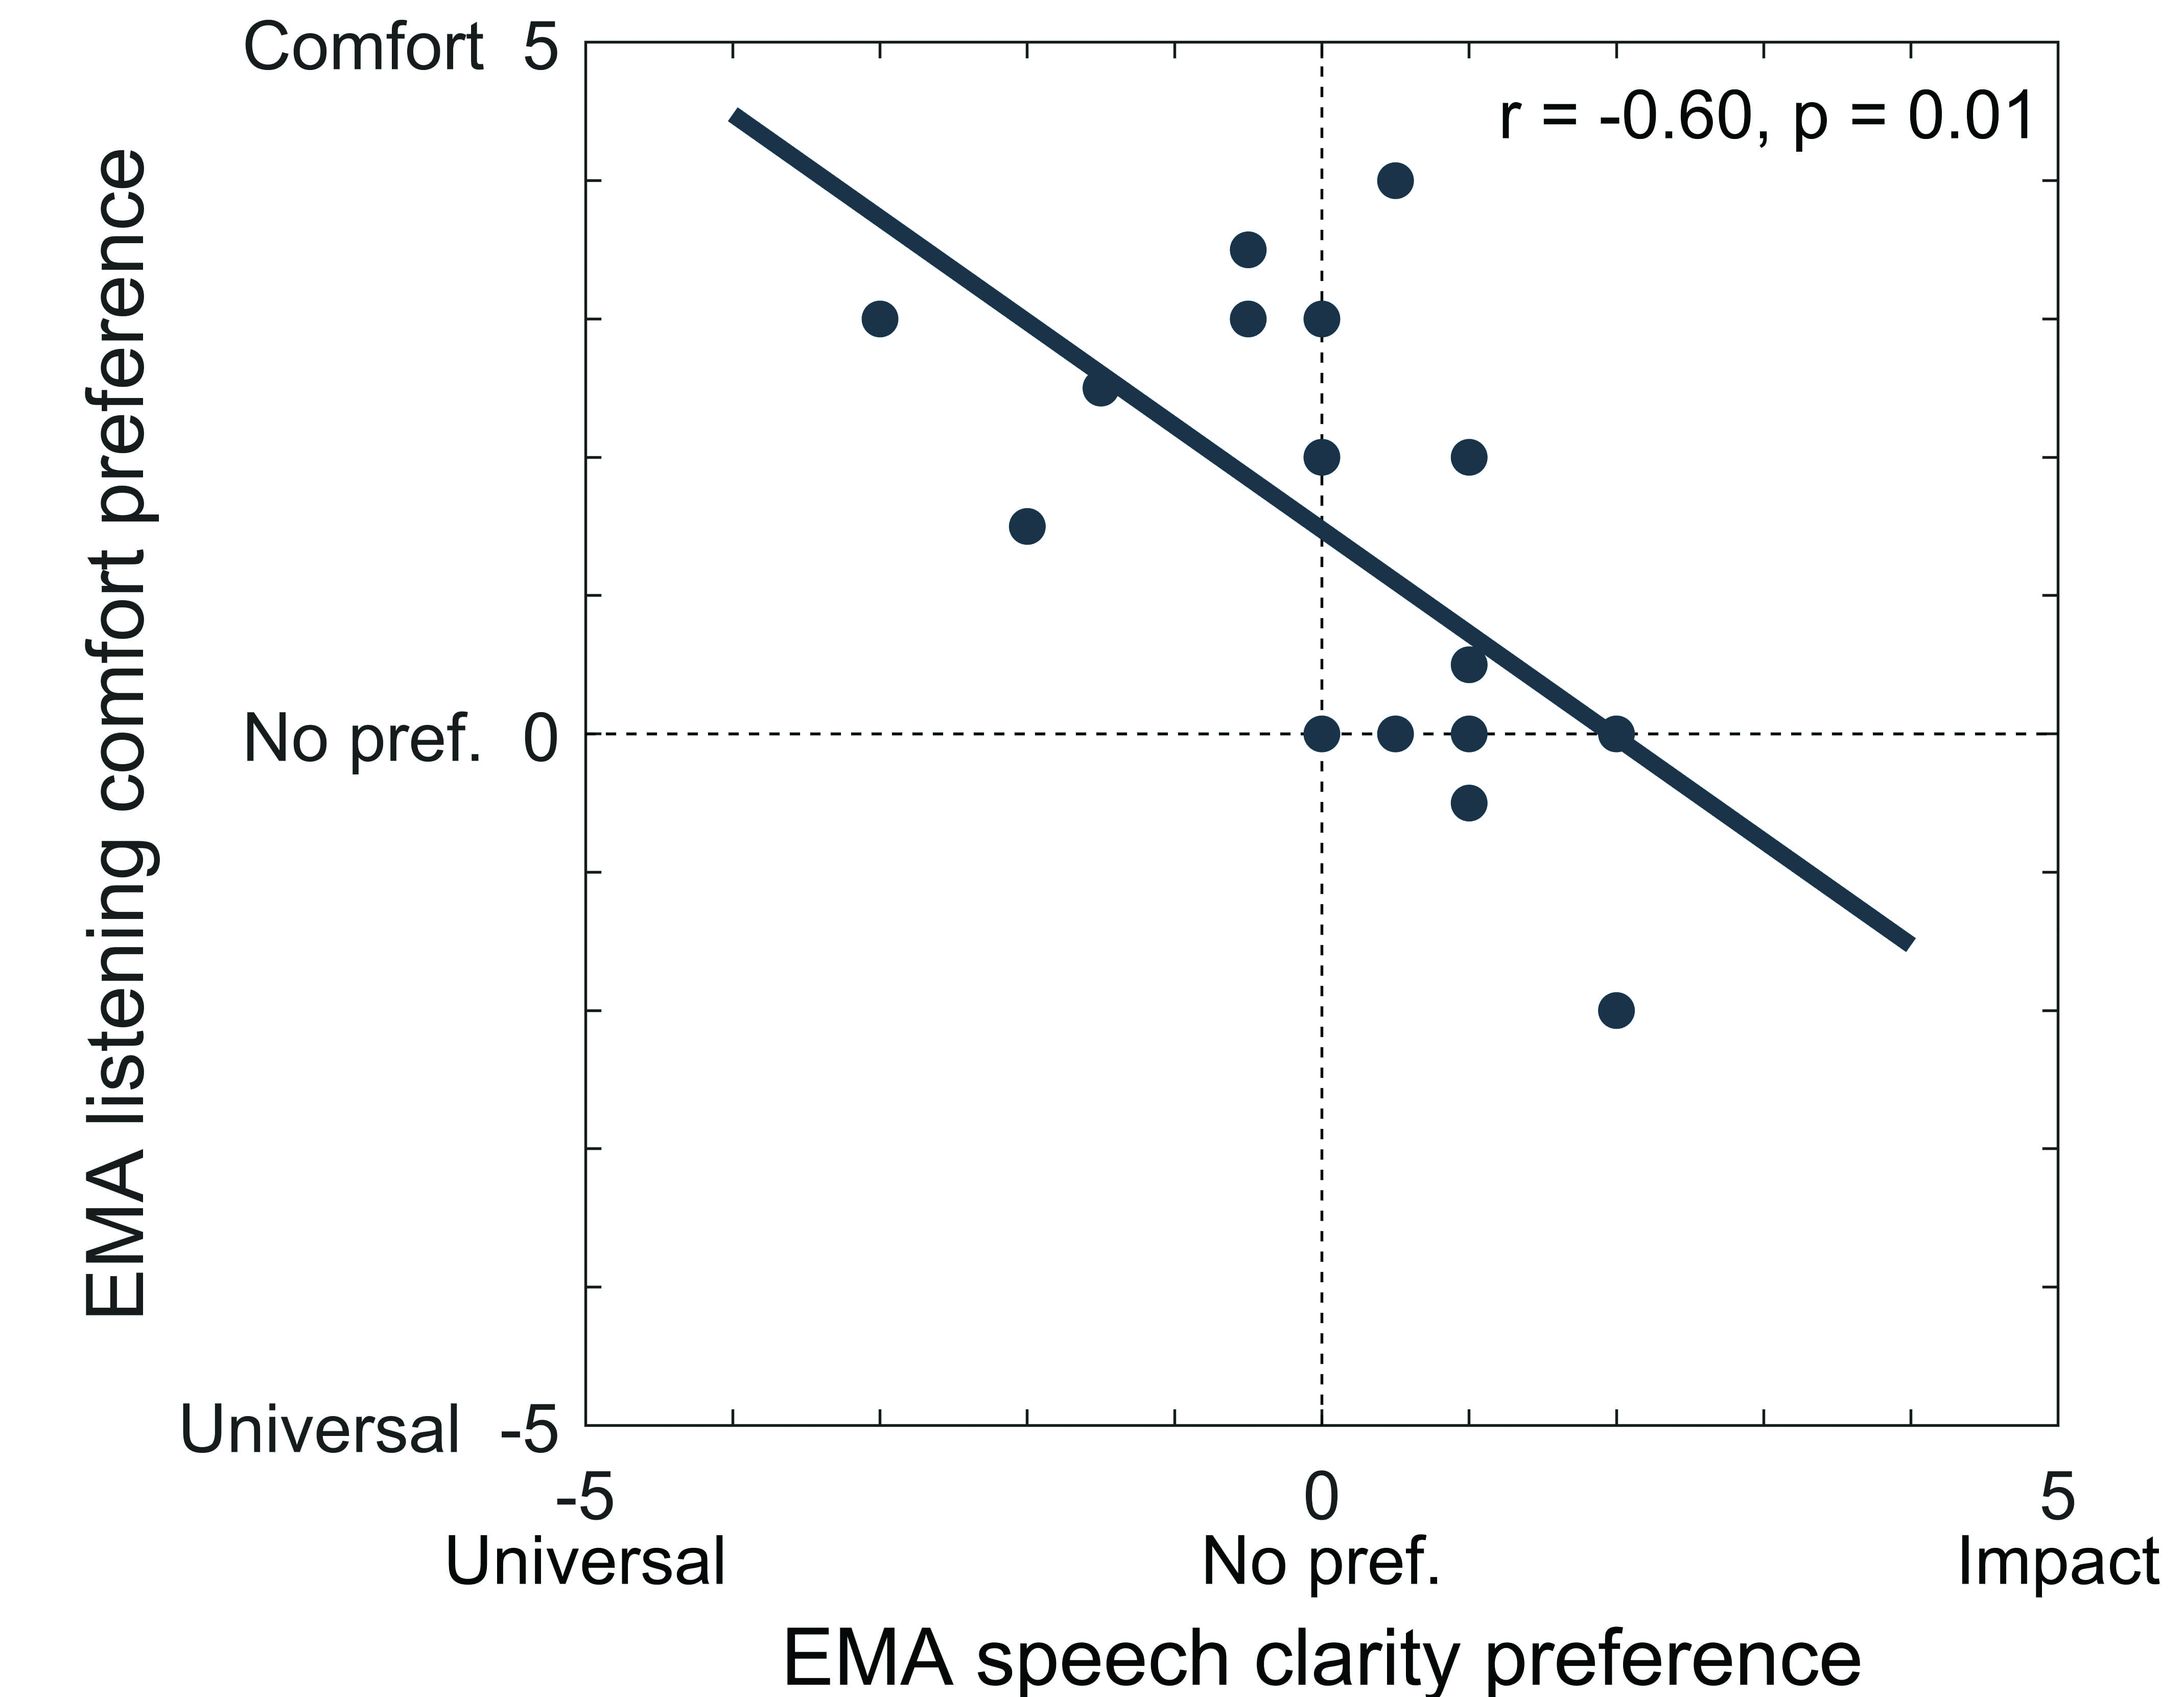
Figure 4. Individual median Comfort (vs Universal) preference ratings plotted as function of median Impact (vs Universal) preference ratings. Medians are based on all ratings across all situations. A linear regression line has been added to show the overall relationship.
Even though no individual participant showed an exclusive preference for one of the programs, there still appears to be a connection between the preferences. This is seen in Figure 4 where the individual participants’ median Comfort preference ratings are plotted as function of their median Impact preference ratings. A significant inverse correlation is observed in the plot. Thus, the higher the Impact preference (for speech clarity), the lower the Comfort preference (for listening comfort), and vice versa. The results indicate that the wearers who prioritize listening comfort and prefer the gain reduction provided by the Comfort program are less likely to accept the more aggressive processing and the more pronounced speech cues provided by the Impact program. Conversely, the wearers who prefer the Impact program for speech clarity tend to like (or need) the Comfort program less. An interesting observation is that no data points appear in the lower left quadrant of Figure 4. Thus, all participants (except one who had a median preference rating of 0 in both domains) experienced a benefit of either one or both of the additional programs (as indicated by positive median Impact and/or Comfort preference ratings), while none had a general preference for Universal in both the speech clarity and listening comfort domains.
Speech intelligibility in noise
Figure 5 shows the results of the JFC test in the lab. The top panel includes box plots showing the distribution of the individual JFC results (SNRs) obtained with the three programs, with the mean values indicated as filled squares. The best mean performance (lowest SNR) was obtained with the Impact program that had a mean SNR of 5.4 dB, whereas the mean SNR was 6.1 dB for Universal and 8.9 dB for Comfort. The JFC data were analyzed with a mixed-model ANOVA, and a Tukey HSD post-hoc test showed that the Impact benefit of 0.7 dB SNR (over Universal) was significant (p Figure 5. Top: Box plots of the individual mean JFC results for each of the three programs, with data plotted in the same way as in Figure 2. Bottom: SNR benefit of Impact (vs. Universal) plotted as function of hearing aid SNR benefit (Universal vs. unaided). The bold linear regression line, the correlation coefficient, and the corresponding p-value are calculated after removal of the outlier shown in gray. The dotted regression line is based on all data points, including the outlier.[/caption]

The JFC test was also completed unaided for 13 of the 15 participants, whereas the last two participants were unable to complete the unaided test. Based on the data from these 13 participants, the bottom panel in Figure 5 shows the individual Impact advantage (the SNR benefit of the Impact program relative to the Universal program) plotted as a function of the general hearing aid advantage (the SNR benefit of the Universal program relative to the unaided condition). Various observations can be made in the plot. Not surprisingly, all participants received a benefit from the hearing aids, as indicated by hearing aid benefits in the range 2 to 12 dB SNR. Ten participants (plus the two not appearing in the plot) received a benefit of Impact over Universal in the range 0.3 to 1.6 dB SNR, one participant performed equally well with Impact and Universal, while two participants performed better with the Universal program. Another noteworthy observation in the plot is the inverse relationship between hearing-aid and Impact advantage. Even though it should be noted that one outlier makes a substantial difference in terms of the strength of the relationship (as indicated by the two different trend lines in the plot), the data pattern indicates that the wearers who get the least benefit from the Universal program are the ones who benefit the most from the Impact program, while those getting a substantial benefit from the Universal program seem less likely to benefit (a lot) from the Impact program.
Listening comfort
The results from the listening comfort ratings made in the lab are shown in Figure 6. The top panel includes box plots showing the distribution of the individual ratings of the three programs, for each of the four sound scenarios. The bottom panel shows the number of individual preferences for the three programs. In case of a tie between two (or three) programs, each of these programs has been counted once in the plot, which explains why the sum of preferences in each scenario is higher than the number of participants (15).
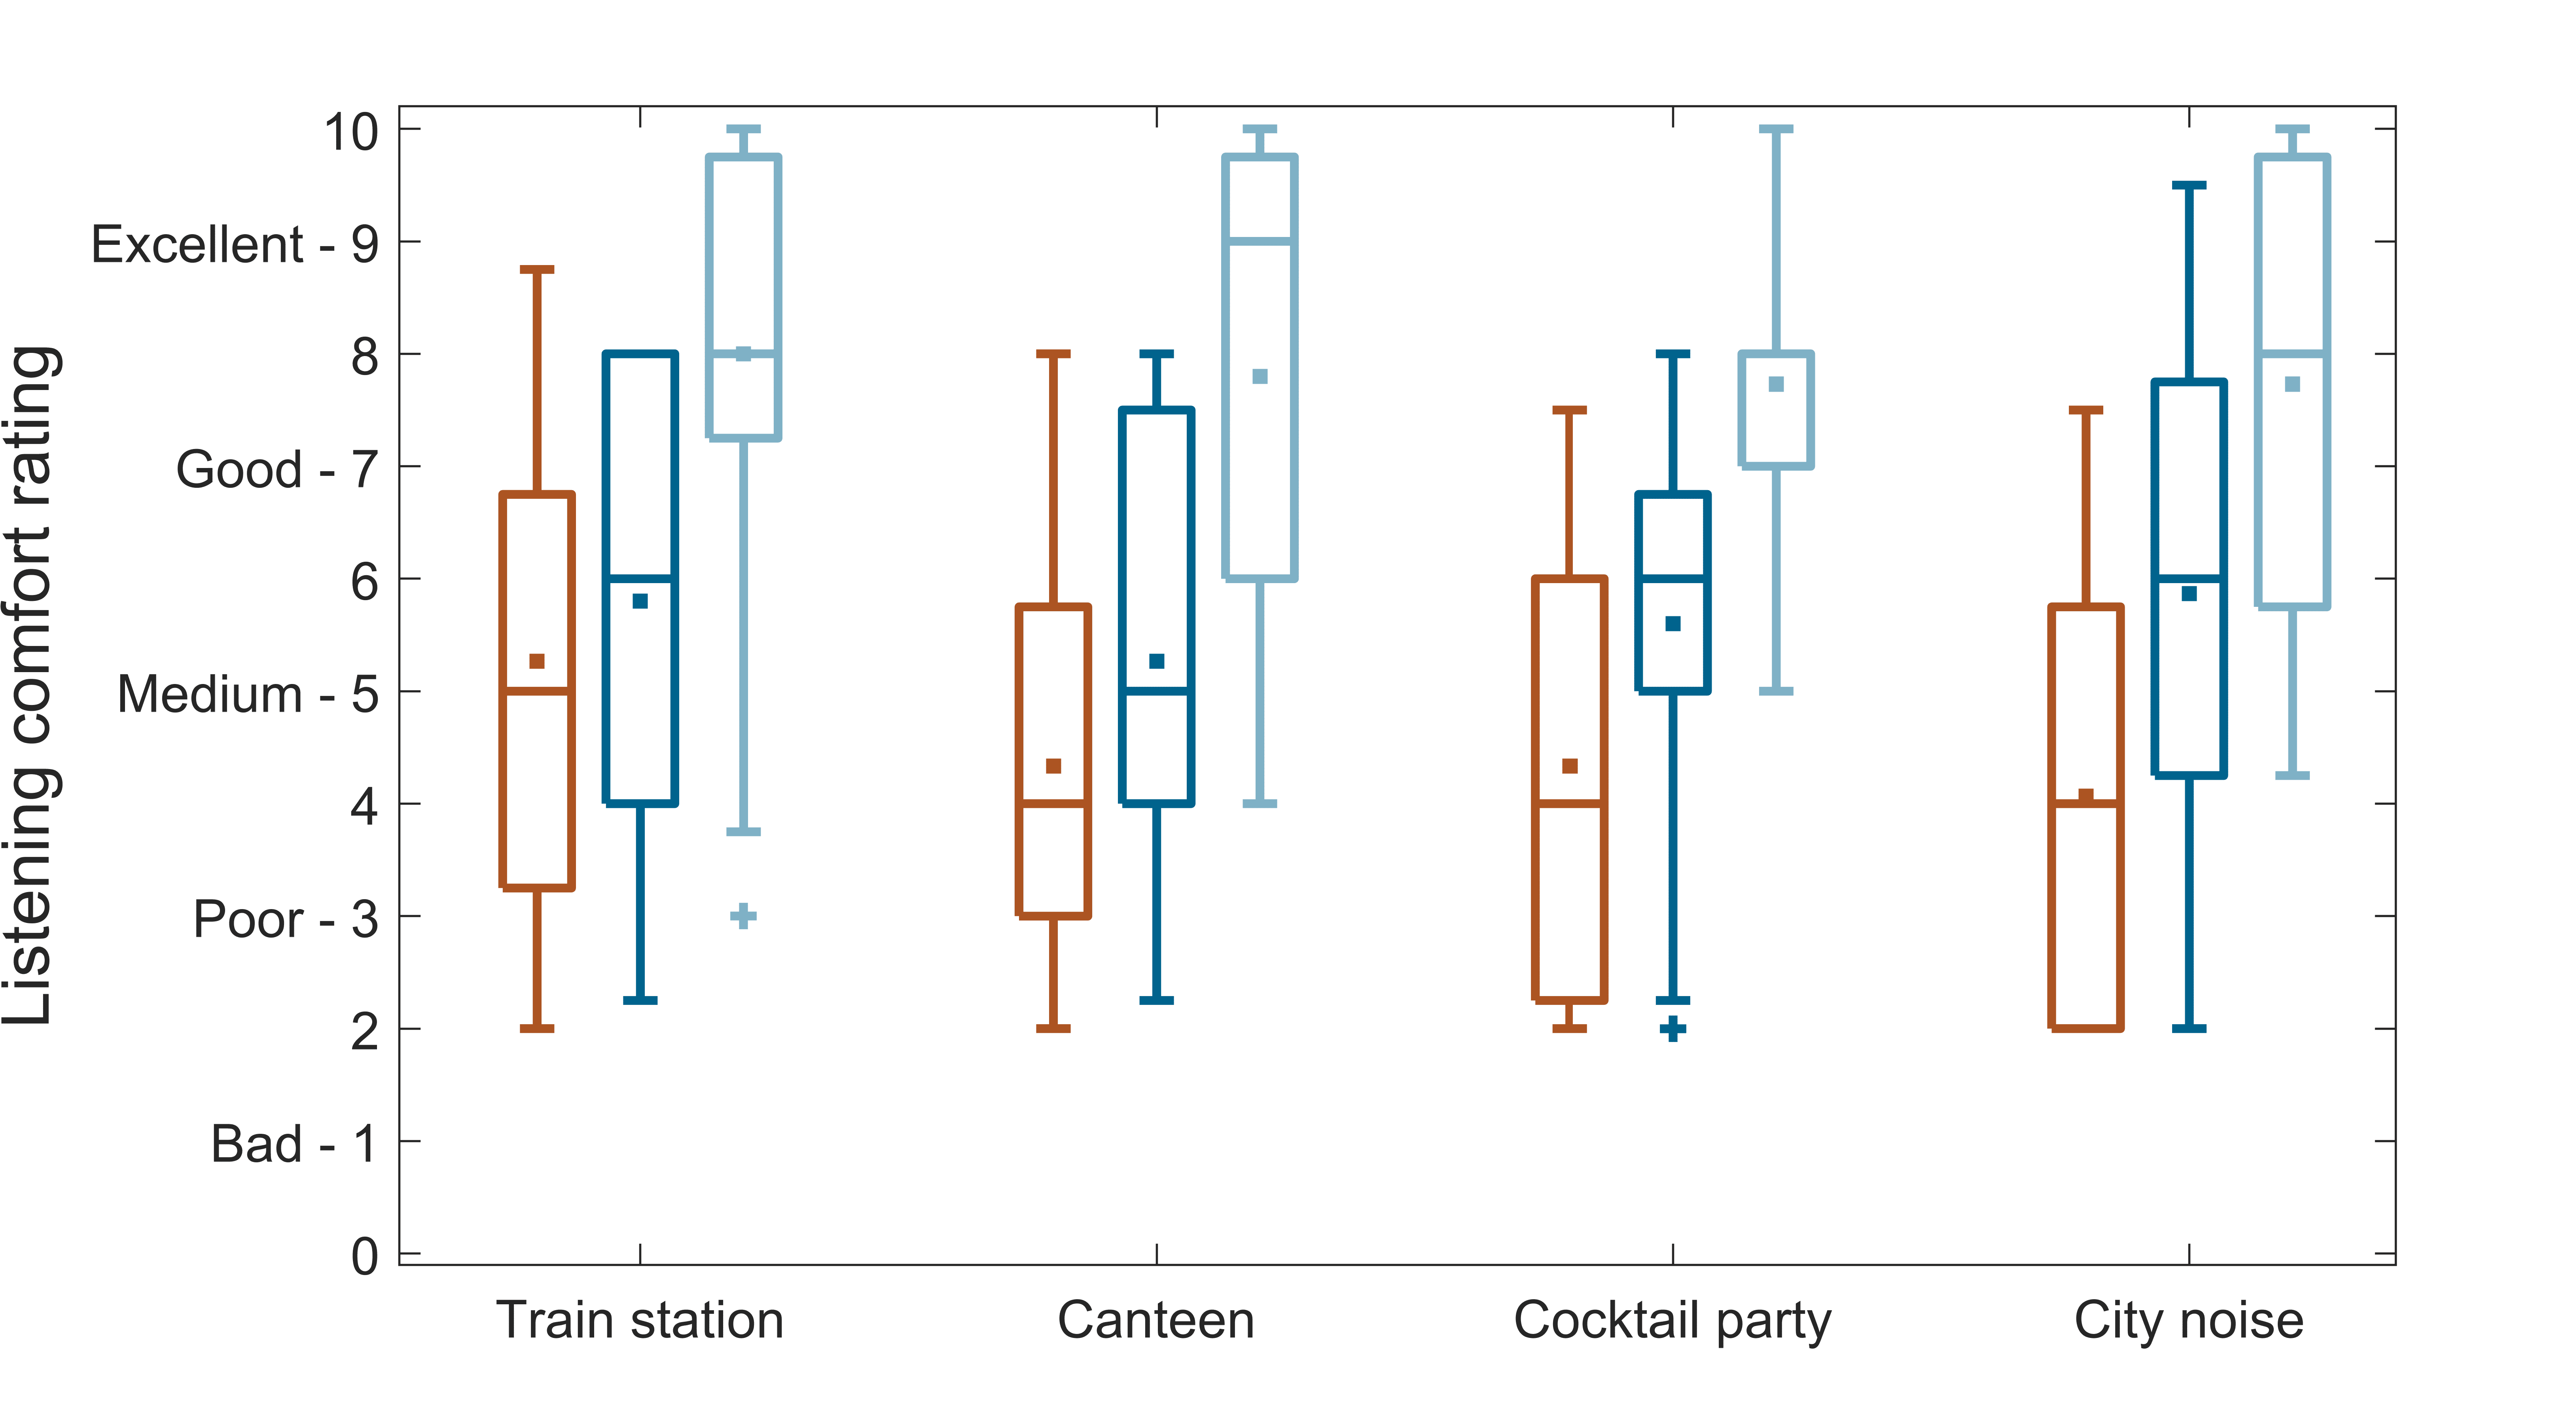
Figure 6. Top: Box plots of the individual listening comfort ratings made in the lab for each of the three programs in the four sound scenarios, with data plotted in the same way as in Figure 2. Bottom: Number of preferences for each program in each scenario. In case of ties between programs, each of these programs has been counted once.
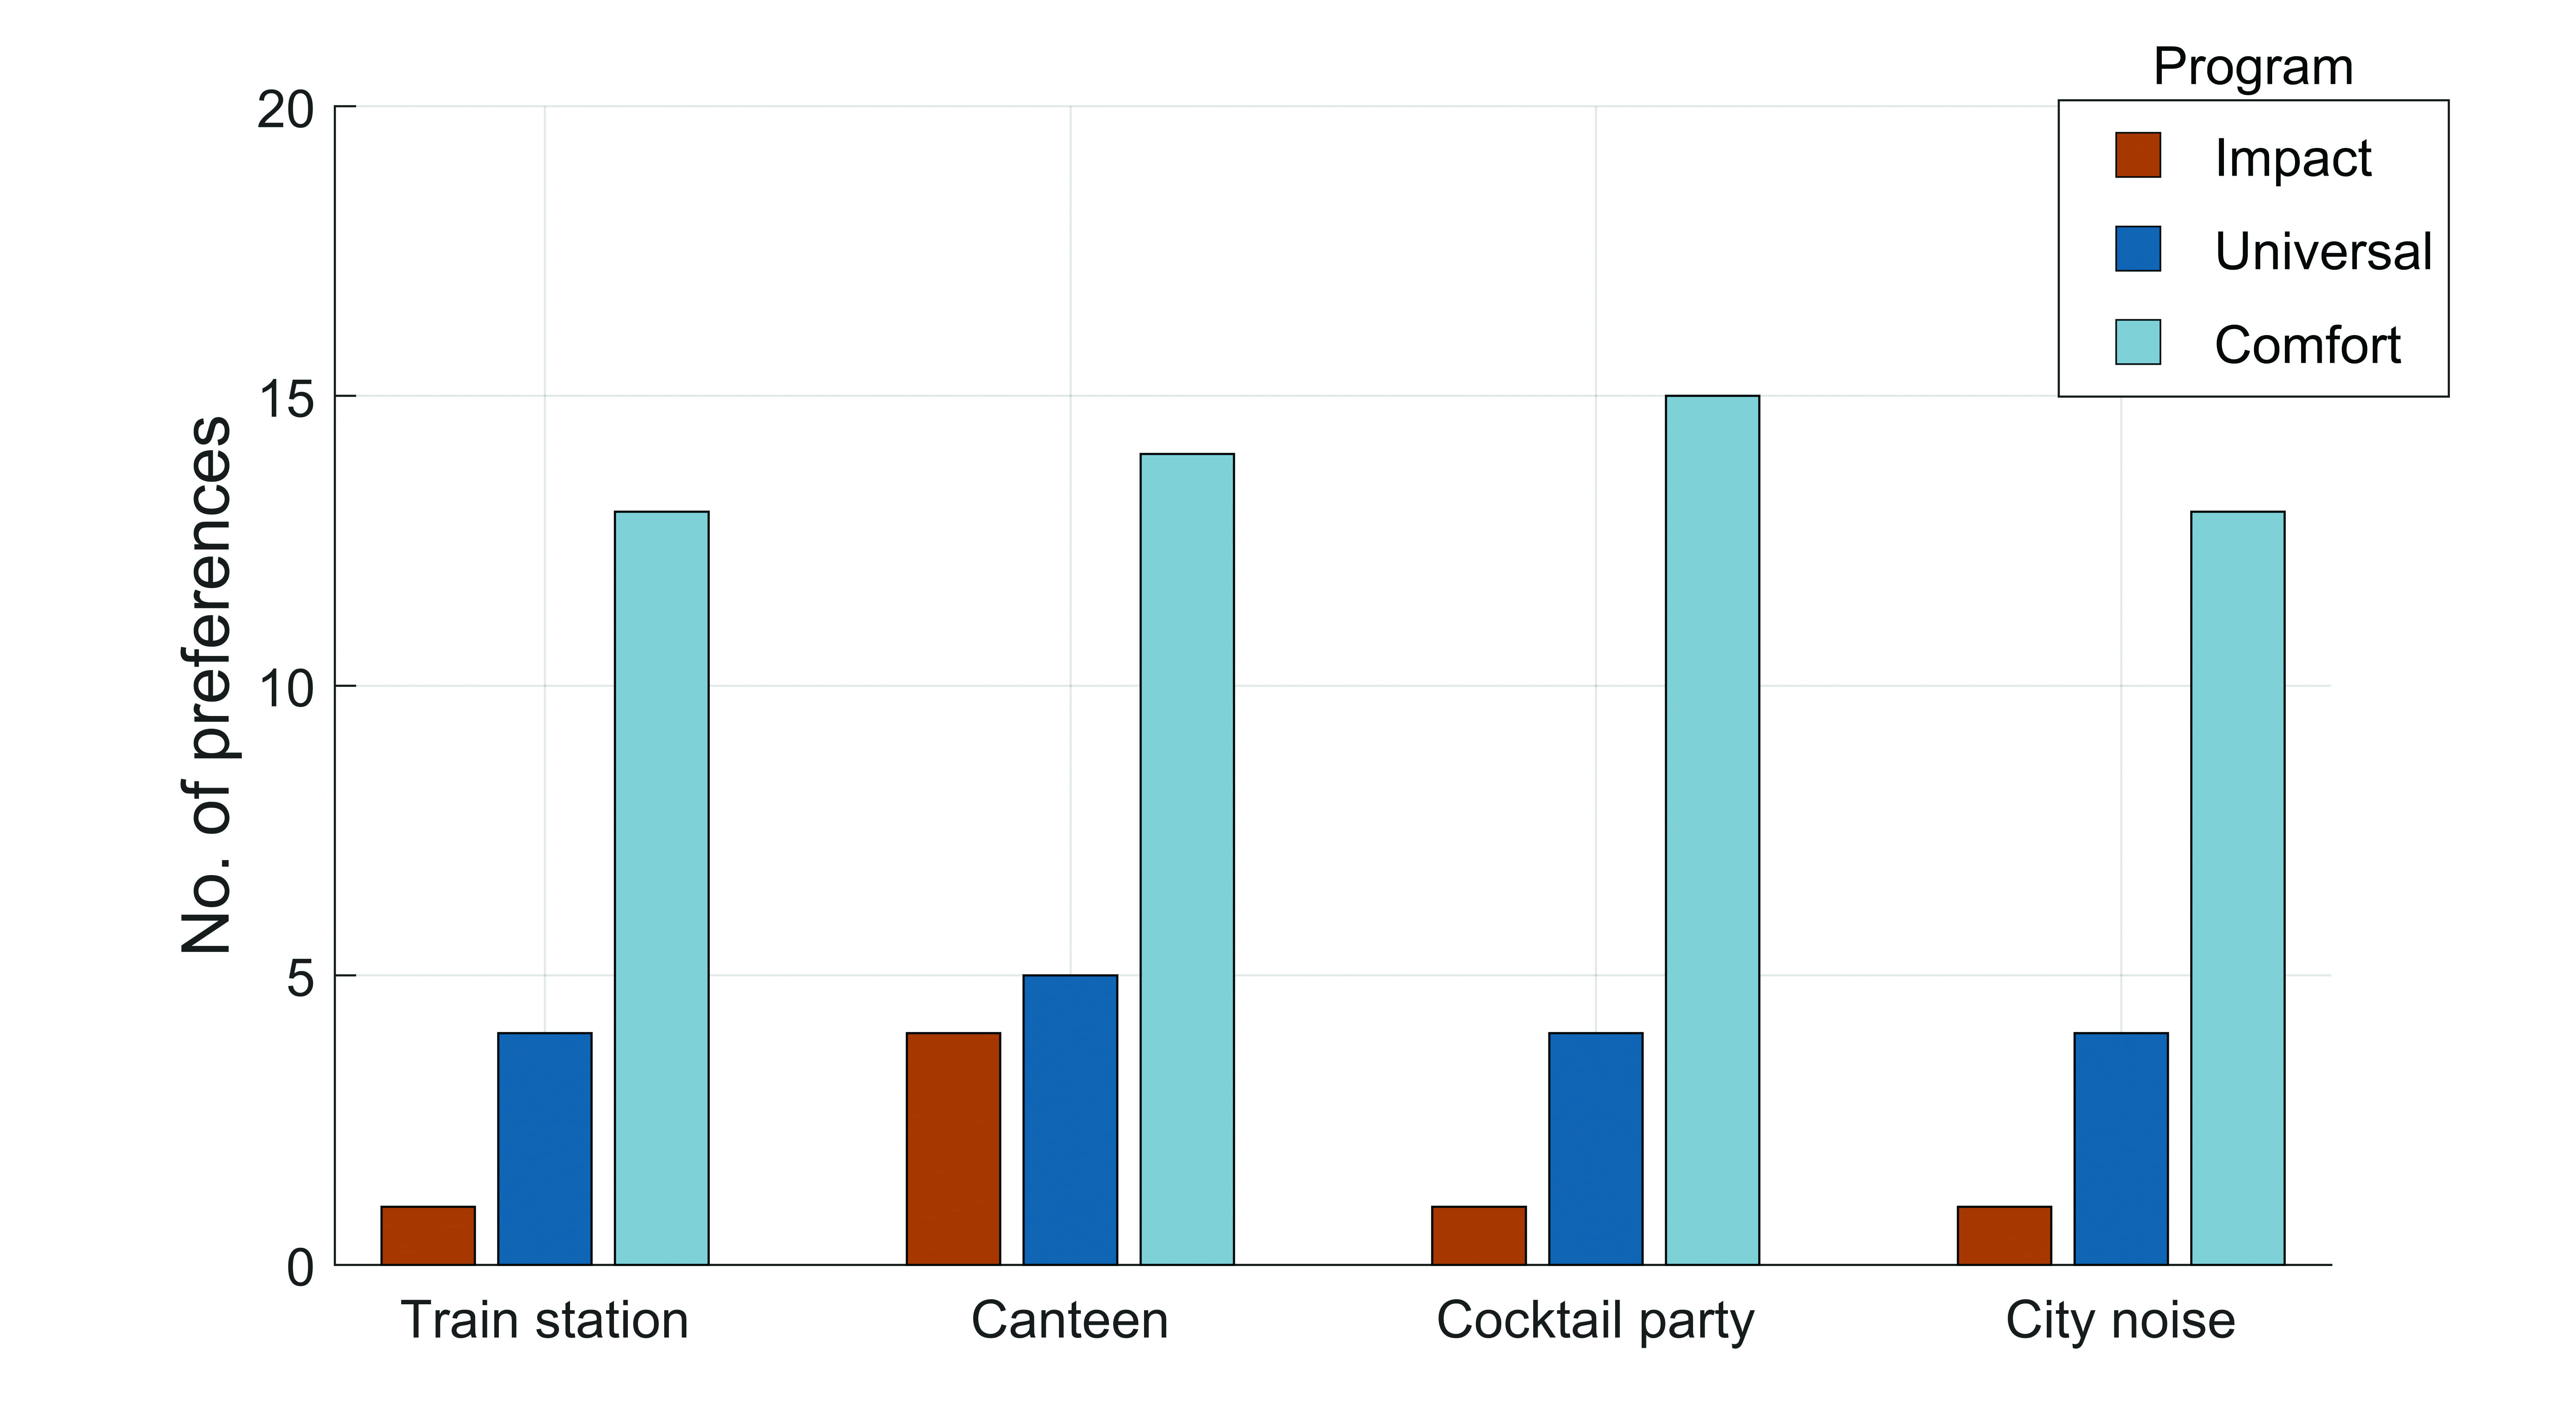
Both panels in Figure 6 clearly show how Comfort was the preferred program in all four scenarios. Across the four scenarios, the mean rating of Comfort was 7.8 while the mean ratings of Universal and Impact were 5.5 and 4.5, respectively. A mixed-model ANOVA showed a highly significant effect of program, and a Tukey HSD post-hoc test showed significant pairwise differences between all three programs. Thus, Comfort was significantly better than Universal (ppDiscussion
Across the different outcome measures included in this study, the most general conclusion was that both the Impact and Comfort programs were able to do the job they were designed to do. This was seen in the EMA trial in the preferences over the Universal program in the types of situations for which the programs were developed, and it was seen in the lab as significant Impact benefits in the JFC (speech intelligibility) test and significant Comfort benefits in the listening comfort ratings.
However, the study also made it quite clear that preference (between programs) is a complex matter where many factors are involved. While the EMA data did show overall trends towards preference for one or the other program in the different types of situations, it was striking that preferences – and in some cases strong preferences – were observed for both programs in a given group of situations (defined by the sound class). The data showed that the preference (for one or the other program) also varied within participants, and not just between participants. Thus, the same participant sometimes preferred one program and sometimes the other – even when being in the same type of situation. This clearly supports the concept of providing the hearing aid wearer with different options, e.g. different programs in the hearing aids that can be used according to the momentary needs of the wearer.
The results from the two lab tests, which included a direct comparison of Impact and Comfort, showed that the two programs serve different needs that make them useful in some situations – but not necessarily in others. The JFC test clearly showed that the Comfort program is not designed for speech intelligibility. The program removes cues that are essential for speech understanding, which resulted in substantially poorer JFC performance, compared to both Impact and Universal. In the listening comfort ratings, the picture was the exact opposite. Here, the Comfort program was a very clear winner with ratings in the ’good’ to ‘excellent’ part of the rating scale, and Impact was a clear looser with ratings reaching into the ‘poor’ part of the rating scale. Thus, none of these programs would be suitable as a default (master) program—and this was never the intention when the programs were developed. The programs are special programs intended for special—and sometimes extreme—occasions.
Even though the study showed that the Impact and Comfort programs were preferred over—or performed better than—the Universal program in certain situations and test conditions, it would not be fair to say that the Universal program was clearly outperformed. In the EMA trial, there were a substantial number of cases—within each of the situation types—where Universal was preferred over Impact (for speech clarity) and Comfort (for listening comfort). And in the JFC test, while there was a significant difference between Impact and Universal with 12 out of 15 participants performing better with Impact, the mean difference was less than 1 dB, indicating that the Universal performance was almost as good as the Impact performance. It was only in the listening comfort ratings that a quite substantial difference between Universal and the best program (Comfort) was observed, which was not that surprising given the gain reductions offered by the Comfort program in these scenarios. All in all, the results indicate that while options do and should exist to optimize performance in specific situations and for specific listening intentions, the automatized processing offered by Universal program is able to provide good performance for those wearers who prefer not to switch between different hearing aid programs in daily life. A noteworthy finding in the JFC data was the inverse relationship between Impact (vs. Universal) and Universal (vs. unaided) benefits, which suggests that those wearers who get the least benefit from the Universal program in challenging situations are those who may benefit the most from getting access to the Impact program.
This study focused on the perceptual domains addressed by the Impact and Comfort programs. The Widex EVOKE offers a range of other programs developed for other domains and types of sound scenarios, eg, the Music program, which is one of the most frequently used additional programs. However, even with a multitude of different programs available, wearers may find themselves in situations where neither the Universal nor the additional programs provide the perfect listening experience. This has been addressed in Widex EVOKE by including the SoundSense Learn feature that uses machine learning to optimize the setting of the hearing aids based on direct preference input from the wearer. The perceptual benefits provided by SoundSense Learn have been demonstrated both in the lab and in real life (Townend et al, 2018; Jensen, Hau, Nielsen, et al, 2019; Balling et al, 2019). With its combination of fully automatized processing, additional programs like Impact and Comfort, and the SoundSense Learn feature, Widex EVOKE offers a palette of possibilities to provide personalized sound that meets the individual wearer’s specific needs and listening intentions in a wide variety of situations. As suggested by the findings in this study, some programs may serve the needs of some wearers more than others, and the decision on which options are relevant for a given wearer needs to be taken in a dialogue between the wearer and the hearing care professional who fits the hearing aids.
Conclusions
The data from the EMA trial showed a general preference for the Impact program over the Universal program in situations where the participants focused on speech. The preference was most pronounced in situations associated with the Social sound class in EVOKE, which were also the situations where speech clarity was most frequently assessed by the participants. The listening comfort assessment in the EMA trial showed a general preference for Comfort over Universal, most markedly in situations associated with the Transport and Urban sound classes that are characterized by being loud and noisy.
The JFC speech intelligibility test showed a significant benefit of Impact over Universal. The Impact benefit was observed for most of the participants, but it was strongest for the participants who received the least benefit from Universal relative to unaided performance. This suggests that the Impact program may be a solution for wearers who experience insufficient performance of the Universal program in challenging communication situations. The listening comfort ratings in four different noisy scenarios showed a significant benefit of Comfort over Universal. The two lab tests showed that while the Impact and Comfort programs provided clear benefits in the domain they were designed for, they provided rather poor performance in the other domain.
All in all, the study demonstrated the potential benefits of providing special programs for special occasions. The results showed that while the Universal program in Widex EVOKE offers a high level of performance in many situations, the more extreme solutions offered by the Impact and the Comfort programs are able to improve the performance of the hearing aids to better accommodate the specific needs of the wearer in special situations.

Niels Søgaard Jensen, MSc
, is Senior Evidence and Research Specialist, Anja Kofoed Pedersen, MA, is Clinical Research Audiologist, Eline Borch Petersen, PhD, is Clinical Research Engineer, and Jesper Theill, BSc, is Development Engineer at Widex A/S in Lynge, Denmark.
Correspondence can be addressed to Dr Jensen at: [email protected]
Citation for this article: Jensen NS, Pedersen AK, Petersen EB, Theill J. When one size does not fit all: Special hearing solutions for special occasions. Hearing Review. 2019;26(8):22-26.
References
Balling LW, Townend O, Switalski W. Real-life hearing aid benefit with Widex EVOKE. Hearing Review. 2019;26(3):30-36.
Hygge S, Rönnberg J, Larsby B, Arlinger S. Normal-hearing and hearing-impaired subjects’ ability to just follow conversation in competing speech, reversed speech, and noise backgrounds. Journal of Speech, Hearing, and Language Research. 1992;35(1):208-215.
Jensen NS, Hau O, Lelic D, Herrlin P, Wolters F, Smeds K. Evaluation of auditory reality and hearing aids using an ecological momentary assessment (EMA) approach. Proceedings of the 23rd International Congress on Acoustics (ICA 2019), Aachen, Germany. In press.
Jensen NS, Hau O, Nielsen JBB, Nielsen TB, Legarth SV. Perceptual effects of adjusting hearing-aid gain by means of a machine-learning approach based on individual user preference. Trends in Hearing. 2019;23:1-23.
Keidser G. The relationship between listening conditions and alternative amplification schemes for multiple memory hearing aids. Ear and Hearing. 1995;16(6): 575-586.
Keidser G, Dillon H, Byrne D. Candidates for multiple frequency response characteristics. Ear and Hearing. 1995;16(6).
Kuk F. Going BEYOND: A testament of prorgessive innovation. Hearing Review. 2017;24(1)[Suppl]:3-21.
Kuk F, Slugocki C, Korhonen P, Seper E, Hau O. Evaluation of the efficacy of a dual variable speed compressor over a single fixed speed compressor. Journal of the American Academy of Audiology. 2019;30(7):590-606(17)
Kuk FK. Evaluation of the efficacy of a multimemory hearing aid. Journal of the American Academy of Audiology. 1992;3(5):338-348.
Kuk FK, Paludan-Müller C. Noise-management algorithm may improve speech intelligibility in noise. Hearing Journal. 2006;59(4):62.
Larsby B, Arlinger S. Speech recognition and just-follow-conversation tasks for normal-hearing and hearing-impaired listeners with different maskers. International Journal of Audiology. 1994;33(3):165-176.
Shiffman S, Stone AA, Hufford MR.Ecological momentary assessment. Annual Review of Clinical Psychology. 2008;4:1-32.
Smeds K, Wolters F, Rung M. Estimation of signal-to-noise ratios in realistic sound scenarios. Journal of the American Academy of Audiology. 2015;26(2):183-196(14).
Smeds K, Wolters F. Towards a firm grip on auditory reality. Hearing Review. 2017;24(12):20-25.
Timmer BHB, Hickson L, Launer S. Ecological Momentary Assessment: Feasibility, construct validity, and future applications. American Journal of Audiology. 2017;26(3S):436-442.
Townend O, Nielsen JB, Balslev D. (2018) SoundSense Learn—Listening intention and machine learning. Hearing Review. 2018;25(6):28-31.
Wu Y-H, Stangl E, Zhang X, Bentler RA. Construct validity of the Ecological Momentary Assessment in audiology research. Journal of the American Academy of Audiology. 2015;26(10):872-884(13).