This is the first segment of a multi-part publication that will cover significant trends in the hearing instruments market. Since 1989, Knowles Electronics has conducted six MarkeTrak surveys of the U.S. hearing-impaired market following the landmark 1984 Hearing Industries Association (HIA) study.
Future publications in this series will revisit customer satisfaction in detail, and explore the following new MarkeTrak topics: use of ALDs; consumer uses of information in choosing a specific brand of hearing instrument; factors impacting choice of dispenser and retail outlet; suggestions to manufacturers for improving hearing instruments; perceptions of improvements in quality of life; and use of computers in hearing healthcare.
In November 2000, a short screening survey was mailed to 80,000 members of the National Family Opinion (NFO) panel. The NFO panel consists of households that are balanced to the latest U.S. census information with respect to market size, age of household, size of household, and income within each of the nine census regions, as well as by family versus non-family households, state (with the exception of Hawaii and Alaska) and the nation’s top 25 metropolitan statistical areas.
The screening survey covered three issues:
1) Physician screening for hearing loss;
2) Whether the household had a person “with a hearing difficulty in one or both ears without the use of a hearing aid,” and
3) Whether the household had a person who was the owner of a hearing instrument.
This short survey helped identify 15,800 hearing-impaired individuals and also provided detailed demographics on those individuals and their households. The response rate to the screening survey was 72%. In January 2001, an extensive survey was sent to 3,000 hearing instrument owners, with tabulation of the data occurring in April 2001. The response rate for the hearing instrument owner survey was 87%.
The data presented in this article refer only to households as defined by the U.S. Bureau of Census (i.e., people living in a single-family home, duplex, apartment, condominium, mobile home, etc). People living in institutions have not been surveyed; these would include residents of nursing homes, retirement homes, mental hospitals, prisons, college dormitories, and military bases. The reader should also keep in mind that the following demographics refer only to those who admit to their hearing loss.
Results & Discussion
The data presented in this study compares the MarkeTrak survey results over the last 12 years with selected data from the 1984 HIA database of the hearing-impaired market. Tables 1-6 contain general trends and indices of the hearing-impaired and hearing instrument owner populations. Each table will be discussed in the order of appearance with references to relevant figures. (Note: sample sizes are denoted in each table by “(n=__).”
Market Penetration Increases; Physician Referrals Decrease
Hearing Impaired Population: As measured by MarkeTrak, the incidence of hearing loss per 1000 households was relatively stable, historically varying between 266 and 275 and settling at 275 in 2000 (Table 1). This equates to 28.6 million people reporting a hearing difficulty or 10.3% of the U.S. population. Thus, the hearing-impaired population has grown by 1.4 million since the 1997 MarkeTrak V survey; this is to be compared to a growth of 1.1 million people for the period 1994-1997.
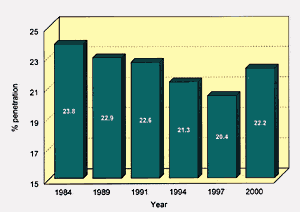
Fig. 1. Hearing aid market penetration (1984-2000)
expressed as percent of hearing-impaired who own
hearing instruments.
The Hearing Instrument Population: Hearing instrument penetration declined steadily between 1984 and 1997 (Fig. 1). Between 1997 and 2000, market penetration increased to 22.2%—its highest rate since 1989, when MarkeTrak was established. The number of hearing instrument owners grew to 6.35 million (up 800,000) while hearing-impaired nonusers increased by 610,000 to 22.3 million people. (Reasons for this growth are explored under “Distribution.”) During the last three years, HIA statistics indicate that U.S. net sales of hearing instruments grew 12.6% (1998-2000 versus 1995-1996) compared to 7.6% in the previous three years (1995-1997 versus 1992-1994).1
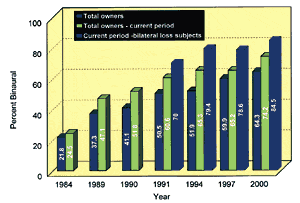
Fig. 2. Binaural hearing instrument owner
population trend.
The stellar historical growth rate for binaural hearing instrument purchases is shown in Fig. 2. Since the last MarkeTrak survey in 1997, the binaural population increased from 59.9% to 64.3% for all users, and from 74.3% to 78.7% (Table 1) for all bilateral loss consumers. The binaural purchase rate in 2000 (current period) increased to 74.2% for all users and 84.5% for bilateral loss consumers.
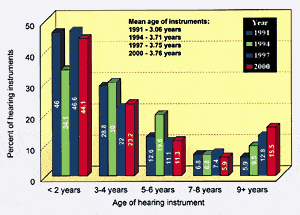
Fig. 3. The age of hearing instruments (current
users only).
Fig. 3 documents the age distribution of hearing instruments in use as measured in the four previous MarkeTraks. (Author’s note: A “user” is defined as an individual reporting he/she wears and uses his/her hearing instrument, and usage is accepted even if it is only occasional [e.g., even if less than a half-hour per day]). Use of hearing instruments that are 2 years old or less decreased slightly to 44.1% of the market. Hearing instruments greater than 9 years old increased to 15.5% of the market. Clearly there is an opportunity here to “upgrade” a significant portion of the market to newer technology. The average age of hearing instruments in use held steady at 3.76 years.
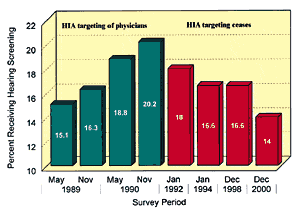
Fig. 4. Percent of U.S. population screened for
hearing loss during a physical exam.
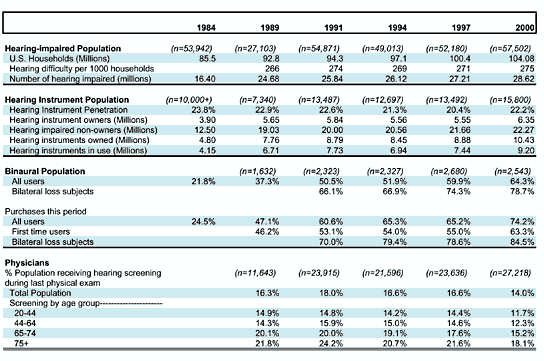
Table 1. Hearing instrument market: potential users, market penetration, binaural population and physician screening.
Physician Screening for Hearing Loss: We specifically ask individuals who received their physical exam in the last six months to indicate if their physician screened for hearing loss during the exam. Historical trends relative to this information are shown in Fig. 4 and Table 1. Physician screening has dropped to 14% for the total population. Declines are seen in every age category.
This finding is puzzling given the fact that one manufacturer has distributed in excess of 30,000 physician screening kits to primary care physicians, the Better Hearing Institute (BHI) has made physician awareness of hearing loss its key market development objective, and the American Academy of Audiology (AAA) has developed a physician referral program for audiologists. In 1989-1990, HIA demonstrated that modest gains in physician awareness leading to physician screening for hearing loss was possible with a targeted media campaign. Certainly improving physician awareness of hearing loss and achieving increased referrals and endorsements remains one of the most important market development objectives for the hearing industry. Previous research has determined that consumers are five to eight times more likely to have higher purchase intents if their doctor believes they need a hearing instrument.2,3
Prices Rise; Audiologists Make Gains in Dispensing
Price of Hearing Instruments: Referring to Table 2, it can be seen that third-party payment (e.g., Medicare, union, insurance, HMO, etc.) for hearing instruments improved to 28.6% of hearing instruments sold in 2000, up 1.1% over 1997 (See Fig. 5). As a reminder to the reader, the dramatic third-party payment decline in 1991 was probably due to the scrutiny of post-retirement benefit accounting practices by the Financial Accounting Standards Board; corporations were warned that they must accrue the cost of post-retirement health care benefits during the working life of the employee. In 1991, this ruling created great pressures on corporations to reduce post-retirement health care benefits.
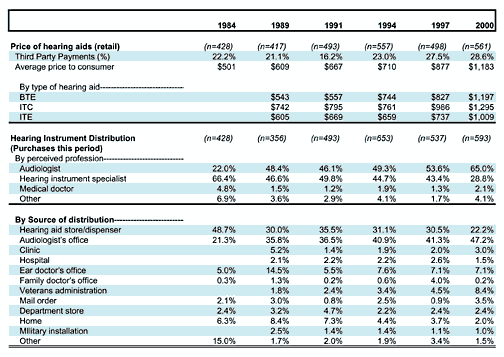
Table 2. Hearing instrument dispensing by price and source of distribution.
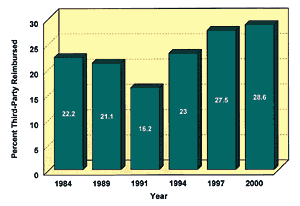
Fig. 5. Third-party reimbursement trend (% of sales).
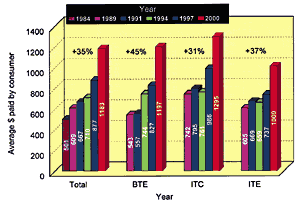
Fig. 6. Average retail price (in $) paid by
consumer per hearing instrument. Price includes
effects of free, discounted, and third-party
reimbursed hearing instruments.
The average price of a hearing instrument as paid out of the pocket of the consumer (includes free and third party discount) increased 35% to $1,183 (Fig. 6). In comparison, the retail price rate increases in the last two MarkeTrak surveys were 23.5% (1997) and 6.4% (1994). The price increases by style of hearing instrument were as follows: BTE 45%, ITC 31%, ITE 37%. Undoubtedly the higher prices are due to the introduction and significant penetration of digital hearing instruments in the U.S. market during the last three years.
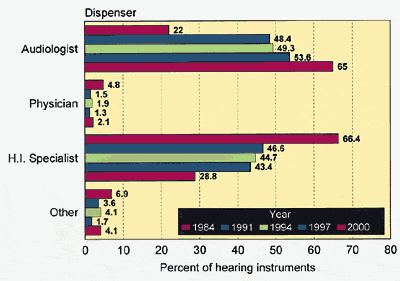
Fig. 7. Hearing instrument fittings by perceived profession
(% of sales).
Distribution: The dispensing role of the hearing instrument specialist continues to decline. Sixty-five percent of hearing aids were fit by audiologists in 2000, compared to 53.6% in 1997 (Fig. 7 and Table 2). In comparison, hearing instrument specialist sales declined 14.6% to 28.8% of sales in 2000. Hearing instrument fittings by medical doctors and others (e.g., mail) remain nominal. It should be noted that the distribution data represents perceptions of the consumer, who may not always be able to differentiate an audiologist from a hearing instrument specialist.
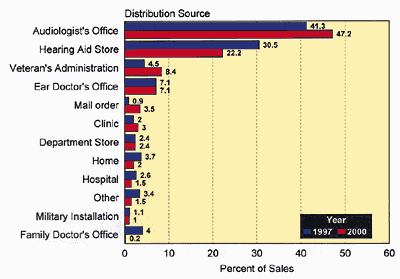
Fig. 8. Hearing instrument sales by source of distribution
(% of sales).
With respect to the source of distribution (Fig. 8), there are some major changes from the previous two MarkeTrak surveys. Significant increases are seen in fittings occurring in audiologist offices (47.2% in 2000 versus 41.3% in 1997) with a corresponding decrease in fittings occurring in hearing aid stores (22.2% in 2000 versus 30.5% in 1997). Veterans Administration sales increased to 8.4% (versus 4.5% in 1997), and mail-order sales increased to 3.5% (up from 0.9% in 1997), the highest it has been in history.
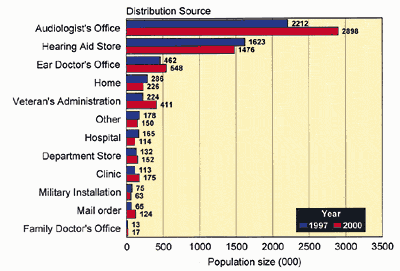
Fig. 9. Total hearing instrument owner population (in thousands)
by source of distribution (based on last purchase).
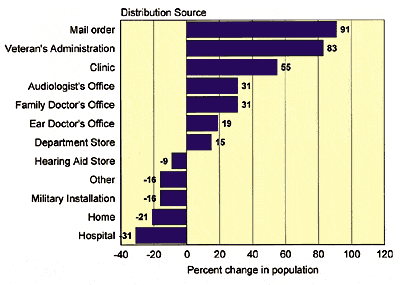
Fig. 10. Percent change in total hearing instrument owner population by source of distribution (based on last purchase): MarkeTrak V (1997) versus MarkeTrak VI (2000).
In Fig. 9, I have estimated the size of the hearing instrument owner population in 1997 and in 2000, based on the place where they purchased their last hearing instrument. Most notable are the significant increases in the VA population (411,000 in 2000 versus 224,000 in 1997) and mail-order sales (124,000 in 2000 versus 65,000 in 1997). Fig. 10 documents growth in each distribution source in rank order. Mail order and VA fittings increased 91% and 83% respectively. I estimate that these two sources account for one-half of the incremental hearing instrument penetration over the last three years. Without the VA and direct mail growth, market penetration would be 21.3%—still lower than the industry high of 23.8% measured in 1984.
Usage Increases, First-Time Users Decline and Customer Base Ages Further
Satisfaction with Hearing Instruments: Table 3 and Fig. 11 document overall satisfaction with hearing instruments for the years 1989-2000. Satisfaction with all hearing instruments (regardless of age of the device) is virtually unchanged.
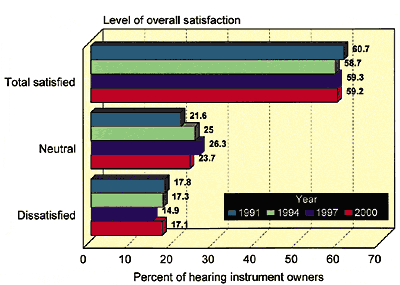
Fig. 11. Overall satisfaction with hearing instruments that are 4 years old or less.
Referring to Fig. 11, if hearing instruments four years of age or less (the effective life of a hearing instrument) are considered, the overall customer satisfaction rate is statistically equivalent over the last four MarkeTrak surveys, despite increases in the penetration of programmable and DSP products. Referring back to Table 3, satisfaction with new hearing instruments (e.g., less than one year old) declined to 62.9% in 2000.
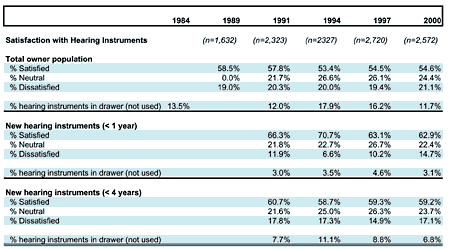
Table 3. Satisfaction with older versus newer hearing instruments, and
statistics on “in-the-drawer” aids.
Considering all hearing instrument owners, “in-the-drawer” hearing aids improved to 11.7% in 2000 versus 16.2% in 1997. New hearing instruments in the drawer would also appear to be improving. In 2000, 3.1% of hearing aids less than one year of age went unused, compared to 4.6% in 1997.
The reader may wonder why customer satisfaction ratings are virtually unchanged given the above figures and the recent dramatic increases in programmable instruments, which are known to have higher customer satisfaction ratings. The second article in this series takes a closer look at this issue.
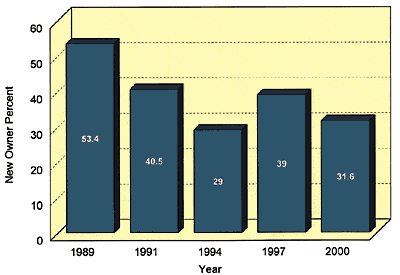
Fig. 12. New users as a percent of sales (calendar year 2000).
New Hearing Instrument Owners: First-time owners decreased in 2000 to 31.6% of sales from 39% of sales in 1997 (Fig. 12 and Table 4). By comparison, in 1989 they represented more than half of sales.
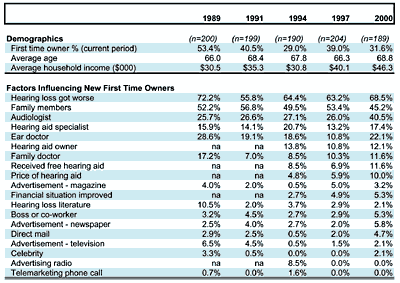
Table 4. First-time hearing instrument users and factors that influence the purchase of an aid.
We are hypothesizing that 1989 was an unusually high year for new users and that they were probably motivated to purchase by Eddie Albert hearing aid television commercials in 1988 and 1989. The low new user rate in 1994 (29%) was most likely due to the negative publicity of the FDA’s initiatives against the hearing instrument industry in the preceding years. After a decline between the years 1991 and 1997, the age of new users would appear again to be on the increase. The current new user is 68.8 years of age with an annual household income of $46,300, up from $40,100 in 1997.
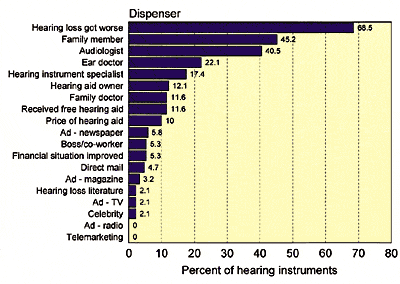
Fig. 13. Factors influencing first-time users to purchase hearing instruments (calendar year 2000).
Referring to Fig. 13, factors influencing new first-time owners to purchase a hearing instrument were: perception that their hearing loss was getting worse (68.5%), family members (45.2%), audiologists (40.5%, up from 26% in 1997) and ear doctors (22.1%, up from 10.8% in 1997). Notable changes are the increase in ENT and audiologist influence, as well as consumers indicating they received free hearing aids (11.6% in 2000 versus 6.9% in 1997). It would appear that family practice physician recommendations are increasing steadily (now 11.6%); but they are still below their high in 1989 (17.2%) when the HIA was advertising to physicians. With respect to media, we see small gains in the influence of newspaper ads (5.8% versus 2%) and direct mail (4.7% versus 2%).
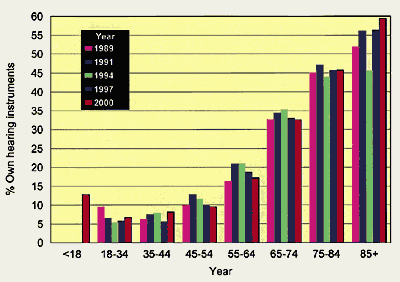
Fig. 14. Market penetration by age group.
Hearing-Impaired Population Demography: In Table 5, detailed demography is presented for the year 2000, and penetration rates are compared for the years 1984-2000. When market penetration by age (Fig. 14) is compared, it is evident that no significant gains have been made since 1989 in any age category, with the exception of perhaps the consumer aged 85+; this customer segment had temporarily stayed out of the market in 1992-1994 during the period of negative publicity associated with the FDA initiatives.
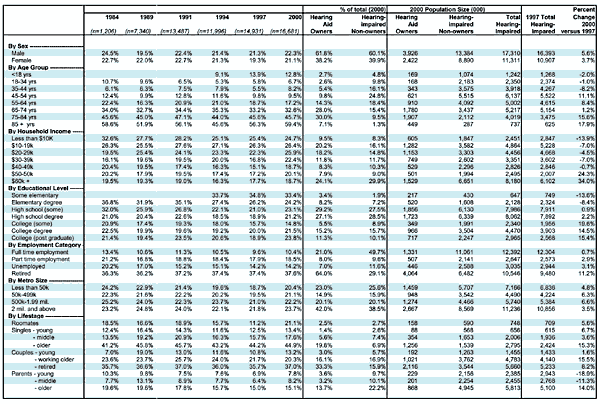
Table 5. Hearing instrument penetration and populations by selected demography.
Fig. 15 documents the size of the hearing-impaired population over the last decade by age category. Most notable is the increase in the age 45-54 “baby boomer” segment (+2.1 million), conceivably spurred by President Clinton’s admission of hearing loss and his use of CIC hearing instruments in October 1997. During this same time period, the age 75+ segment grew by one million people.
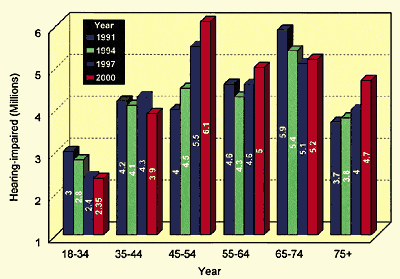
Fig. 15. Adult hearing-impaired population by age group (1991-2000).
Baby-boomer (ages 45-54) growth spurred by President Clinton in
10/1997 continues.
When MarkeTrak VI (2000) and MarkeTrak V (1997) population figures by age segment are compared (Table 5), the largest growth took place in the following segments:
- Ages 45-54, 75+;
- Incomes: greater than $50,000;
- Education: some college and above;
- Employment status: retirees;
- Metro size: small to under 2 million metropolitan areas;
- Lifestage: older singles, older couples, and older parents.
Clearly coming our way is a major wave of potential consumers in the “baby boomers” segment, who are both more educated and affluent than the industry’s current consumer base. Unfortunately, our industry has not enjoyed any level of success in convincing this segment to purchase our products and services.
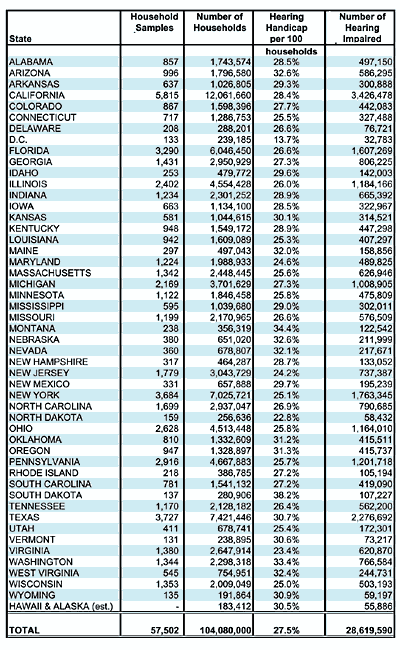
Table 6. Incidence of self-reported hearing impairment and
estimated hearing-impaired population by state.
Finally, an estimate of the hearing-impaired population size by state is presented in Table 6, along with the incidence of hearing-impairment per 100 households. In terms of population sizes, the top 10 markets in rank order are: California, Texas, New York, Florida, Pennsylvania, Illinois, Ohio, Michigan, Georgia, and North Carolina.

Where are They? Number of Hearing-Impaired People by State Blue: <250,000 Green: 250-500,000 Yellow: 500-750,000 Orange: 750,000-1MM Red: 1MM+ |
| Fig. 16. Number of hearing-impaired people by state (from Table 6). |
Key Findings
- The hearing-impaired population has grown to 28.6 million, with major increases in the “baby boomer” and elderly age-75+ brackets. The available market has become more educated and affluent.
- Market penetration increased to 22.2% (a 2.2% increase since 1997). During the last three years, the VA and direct mail sales have contributed about half of this penetration growth. This amounts to about 246,000 new hearing aid owners if we hold their population size constant to the 1997 survey.
- Hearing screenings by physicians have decreased to 14% (16.2% in 1997) despite significant saturation of the physician market with hearing screening kits by some manufacturers and renewed attention to the issue by AAA and the BHI. There has been a steady decline in physician screening now since 1990 (when it was 20.2%) concurrent with the cessation of HIA marketing initiatives.
- Overall customer satisfaction with hearing instruments is virtually unchanged despite increased penetration of programmable and DSP technology.
- Hearing instruments in the drawer have decreased (an improvement) to 11.7% (16.2% in 1997).
- The new user rate has dropped to 31.6% (39% in 1997), while the age of the average consumer has increased to nearly 69 and their income has improved to $46,300 ($40,000 in 1997). Conceivably, the higher price of hearing instruments has created barriers to entry for the less affluent consumer segments.
- The binaural rate continues to increase. Binaural hearing instrument penetration among bilateral loss subjects is now 84.5%, and 74.2% for all hearing aid users.
- Hearing instrument sales through audiologists continue to increase. The most notable changes in distribution over the last three years have been the growth in direct mail and VA sales (91% and 83% increases respectively).
- The effective retail price for hearing instruments (what the consumer paid out of their pocket) increased nearly 35%, compared to 24% in 1997 (MarkeTrak V) and 6% in 1994 (MarkeTrak IV). These increases reflect the remarkable increase in usage of programmable (30%) and DSP (29%) hearing instruments, as reported by HIA in the third quarter of 2001.1

Correspondence can be addressed to HR or Sergei Kochkin, PhD, Knowles Electronics, 1151 Maplewood Drive, Itasca, IL 60143; [email protected]
References
1. Hearing Industries Assn (HIA): Hearing Industries Association Statistical Report. Washington, DC: HIA, 2001.
2. Kochkin S: MarkeTrak III: The billion dollar opportunity in the hearing instruments market. Hear Jour 1993; 46 (10): 33-38.
3. Kochkin, S. MarkeTrak IV: Correlates of Hearing Aid Purchase Intent. Hear Jour 1998; 51 (1): 30-41.


