
Research | May 2020 Hearing Review online
A pilot study incorporating acoustic, place-based and experience sampling methods
By Danielle Glista, PhD, Robin O’Hagan, CDA, Leonard Cornelisse, MSc, Tayyab Shah, PhD, Donald Hayes, PhD, Sean Doherty, PhD, Jason Gilliland, PhD, and Susan Scollie, PhD
The race to achieve the best performance in a hearing aid, to a large extent, has come to rely on the ability of the hearing aid to correctly identify the wearer’s auditory ecology and then appropriately modify the device’s signal processing for that individual. This pilot study analyzes collected and paired data related to the numerous facets of auditory ecology and shows how they can be useful in improving future hearing aid performance.
Hearing aid digital signal processing has evolved to include the ability to log, analyze, and classify acoustic input, essentially in real-time. The result of this is a series of ongoing acoustic snapshots of what the listener is hearing that can be used in the personalization of the hearing aid (HA) fitting. Although the underlying techniques used to accomplish these snapshots can differ across manufacturers, the main objective for tracking and classifying this information is consistent: to allow the hearing aid to use information related in the listener’s auditory ecology1 to automatically modify the signal processing performance. In other words, automatic modification of the signal processor can account for the acoustics of a listening situation.
This is typically accomplished through classification schemes incorporating acoustic metrics, such as signal level, type of noise, and relative ratio of the target signal to competitor. When combined, acoustic metrics can offer information related to the listener’s social context or listening intent. Benefit from an automatic HA classifier is therefore contingent on the accuracy of the classification scheme. Traditionally, HA classification has been limited to the information obtained from acoustics sensors. A more holistic approach could enrich this series of snapshots over time by integrating additional information related to the characteristics of the listening activity (eg, type, location), social context (eg, companions, listening intent) and the overall experienced environment (eg, traveling speed).
Hearing aid performance is most often evaluated in laboratory-based settings and supplemented with paper and pencil questionnaires and/or interview techniques. Wu et al2 have shown that questionnaires can be used to supplement acoustic analyses of signals recorded through a hearing aid to reveal the more commonly experienced listening contexts of importance to the listener.
To improve generalizability and minimize memory biases, many research centers are placing a greater emphasis on the collection of real-world, real-time data using experience sampling research methods.3 Data collection combining passive and interactive techniques are surfacing in the literature. Passive data collection techniques used in real-world scenarios generally involve digital recording devices that log a signal of choice. The dosimeter, a commonly used device, collects data related to sound/noise levels. More modern examples include digital audio and video recorders found in almost all smart devices. Many of these devices are accompanied by software that enables offline data extraction and digital signal processing. For example, the Language Environment Analyses (LENA) processor coupled with a data extractor, can categorize listening activities and environments, in addition to basic signal level analyses.4 A global positioning system (GPS) device can passively track the spatial coordinates, or location, of individuals throughout their day. When accompanied with geographic information systems (GIS), big-data captured with GPS can be manipulated, analyzed, managed, and/or spatially presented.5-8
Interactive data collection has the advantage of being linked to subjective feedback. One example of an interactive technique gaining interest in audiology research is ecological momentary assessment (EMA). EMA involves repeated sampling of the individual’s moment-to-moment experiences and behaviors in real-world contexts9 and can be paired with smart devices to display surveys in real-time.10 Emerging literature in this area suggests that EMA is a feasible and valid research method for listeners with hearing-impairment.11 In the case where the listener wears hearing aids, pairing EMA methods with smart devices can allow for the combination of interactive and passive data collection. A recent study by Aldaz and colleagues12 demonstrates the pairing of acoustic data with subjective participant feedback to optimize HA classification and user-defined settings over time. Innovative data collection techniques, including device pairing, present the possibility of real-world investigation into the efficacy and effectiveness of advanced digital signal processing features.13 In addition, information around the experienced physical context (eg, location-based information) may potentially contribute to a richer understanding of auditory ecology and provide valuable information for HA classification systems.
This pilot study aimed to collect and pair data related to the many facets of the experienced auditory ecology and to inform future research studies focused on HA fitting personalization. Specifically, this exploratory study aimed to describe the following:
- The feasibility of participant data collection using 4 different data collection methods/modalities (HA, LENA, GPS and EMA);
- The steps taken to align a large data set from multiple logging devices;
- The added value of combining passive and interactive techniques for tracking listener’s auditory ecology, including those which offer location-based information.
Methods
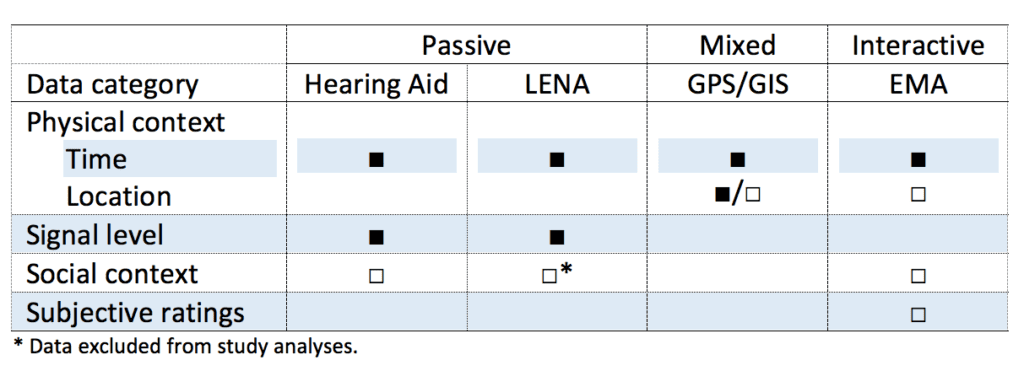
Study overview. Data collection techniques were informed by an interdisciplinary collaboration including scientists from Western and Wilfrid Laurier Universities and Unitron Canada. This team brought together experts in the areas of HA signal processing and aural (re)habilitation, with those that specialize in human environment analysis and urban development. Passive and interactive data collection techniques included in this study measured the following dimensions: signal level, physical location, social context and subjective ratings. Table 1 groups the data collection techniques used across devices according to: 1) continuously logged; or 2) categorized, requiring additional input in the form of automatic processing or subjective categorization.
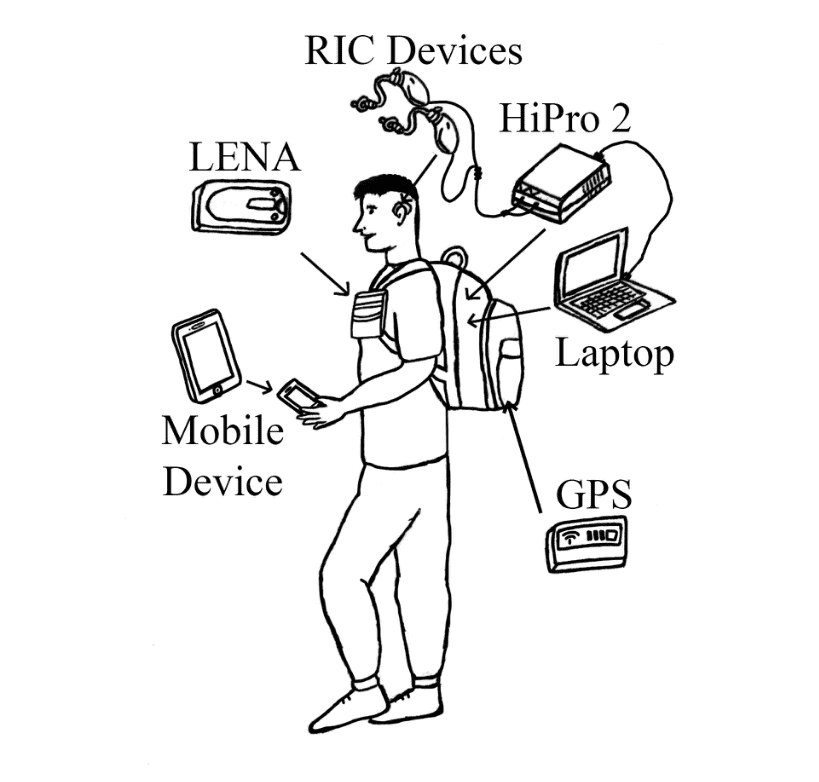
This study included 6 pilot participants, sampled from the research team’s lab members, with self-reported normal hearing. Participants were asked to collect from a range of portable devices over two 8-hour days (Figure 1). Unitron Moxi Kiss 500 receiver-in-the-canal devices were fitted bilaterally to have 0 dB gain. Hearing aids were connected via a HiPro 2 to a laptop with prototype Unitron TruFit software. LENA devices and Columbus V-900 GPS systems were worn externally by all participants, and EMA was enabled through an application downloaded on each participant’s smartphone. Prior to beginning data collection, each participant attended an audiologist-led fitting and training session specific to the study devices.
Data collection. Data logging, processing, and storage techniques varied considerably across devices. HA-logged data were classified through an environmental classification system14 which automatically controlled the program structure. The data were stored on the laptop in 1-second intervals, for each device separately; this included overall level (dBA), stimulus category, and directionality. LENA devices measured average level (dB SPL) across 5-minute intervals. Data were extracted from the LENA devices using proprietary software; Lena categorization of listening activities and environments was not used for the purpose of this project. GPS and GIS combined passive and interactive techniques through passive logging of location-based information on a second-by-second basis using the GPS device, followed by GIS mapping and classification of location using municipal planning data on the local environment. GIS data were further examined for validity and reliability; missing data points were replaced based on linear interpolation of the geographical coordinates.
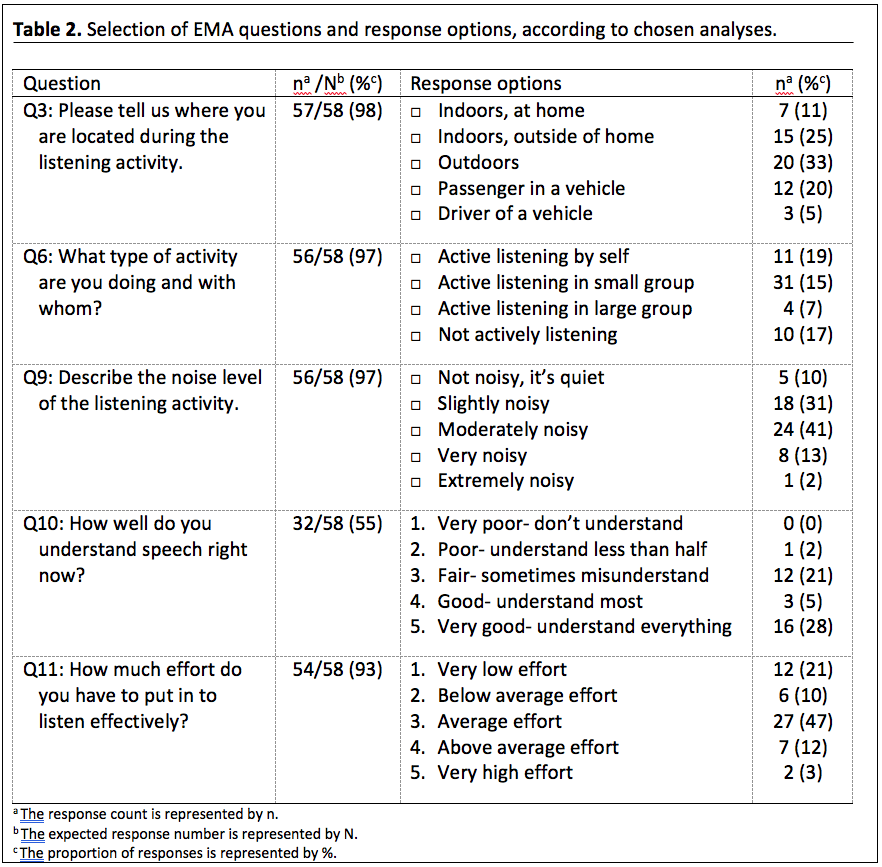
In addition to wearing passive tracking devices, participants also completed EMA surveys. EMA data collection required subjective completion of survey questions on the users’ smartphone using the following electronic prompts: 1) Time-triggers sent at random times, 10x per day and between 8 AM and 8 PM, with a minimum of 30 minutes between prompts; and 2) Self-triggers chosen by the user during a novel listening situation of interest. A total of 17 questions (6 nested) probed the participants’ experience with situations including those related to type of listening and noise level, in addition to 4 ratings scales (refer to Table 2 for a selection of question/response details). EMA surveys that took longer than 30 minutes to complete were excluded from analses11; 3 entries were removed from the final EMA dataset, leaving 58 analyzable EMA surveys.
EMA data were securely uploaded and stored by MetricWire15, a Canadian-owned company, with access to data only permitted to the researchers. Participant data were automatically encrypted and owned by the researchers.16
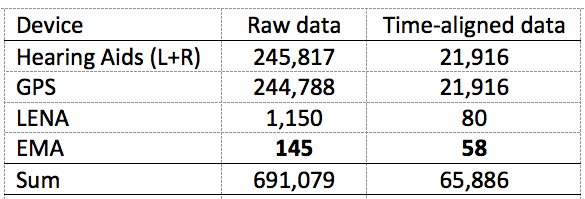
Data alignment. Data extracted from each device were formatted and integrated into one file using the following time-based identifiers: HA PC time, GPS date and time fields, LENA clock time, and EMA survey start time. The time-alignment strategy for this study considered the limitations of all datasets and the study rationale, resulting in alignment to the real-world EMA dataset, collected with subjective interpretation, and a more manageable final dataset. Table 3 summarizes the total data collected across devices, as well as the time-aligned data used in analyses.
For the signal level analysis portion of the study, data selection incorporated time-windowing, to minimize fluctuation in signal levels measured across devices at single time points. The final dataset used to explore the signal level across environments was therefore based on data averaged across a 5-minute time window surrounding all 58 data entries collected with the EMA. Based on the maximum duration of an EMA entry (30 minutes), averaged data could span up to 6 five-minute time-windows. This resulted in the inclusion of 39 five-minute, 18 ten-minute, and a single 25-minute time-window(s) in the final dataset.
Results
Results are displayed according to time-aligned data by category (refer to Table 1) to illustrate the utility of location-based information in enriching ecological understanding.
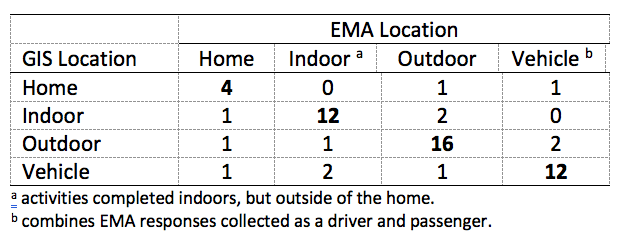
Location comparison matrices. A direct comparison matrix of subjectively logged EMA location (n = 57) and GIS informed location is illustrated in Table 4. Overall, agreement between EMA and GIS locations was high, with some deviation across all location categories. This is in part due to scenarios where the GPS experienced a signal outage, making it difficult to categorize indoor versus outdoor locations. The addition of GIS information related to speed, enhanced categorization of vehicle-based data. Drivers were instructed via EMA to wait until they were finished operating the vehicle before logging driver-based responses.
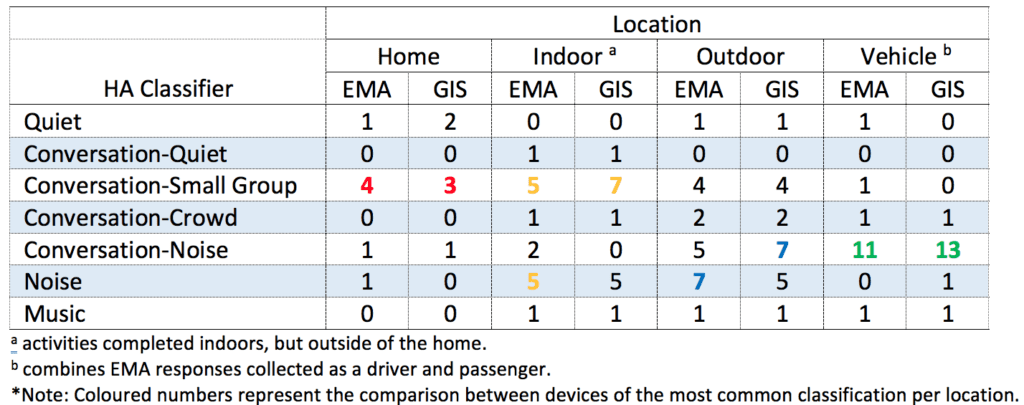
EMA and GIS logged locations were broken down according to HA environmental classification in Table 5. This was accomplished by averaging left and right device data and assigning a HA classification category based on the maximum logged value. Table 5 shows a direct comparison of EMA versus GIS location categorization according to the 7 HA classifications. Although not fully representative of current proprietary classification schemes, this matrix illustrates the cases in which the addition of either EMA or GIS informed data has the potential to assist in the refinement of HA classification contexts. This dataset illustrates how location-based data (EMA/GIS) could enhance classification ability for activities completed in a vehicle that may have otherwise been classified as conversation in noise.
Combining location-based data with signal level. Overall sound level captured by the LENA (dB SPL) and the hearing aid (dBA) were compared according to EMA (Q3) logged locations. Figure 2 illustrates trends within devices and the effect of the data logging characteristics of each device on the findings. To explore the data further, left and right HA data were separated (across all EMA locations) and vehicle-based data were separated into two categories (passenger and driver). For the right data series, 6 fewer entries were logged due to connectivity issues. Median values for the HA sound levels across location categories were lower (quieter) when compared to the LENA sound levels, mostly due to the weighting applied during the measurement. Large level differences are noted for the vehicle-based data comparisons, with higher HA sound level measurements reported for passengers, when compared to drivers, and for the right device when compared to the left device worn by a driver. Passenger-based data included those collected in a car or on a bus; higher sound levels were likely associated with the latter. Higher sound levels measured on the right side driver side may have related to the presence of passenger and/or car stereo noise. EMA responses confirmed the presence of speech during many of the driver entries; however, given the small sample of driver-based data that incorporated multiple noise sources from within the vehicle this finding may be unique to this study’s dataset.
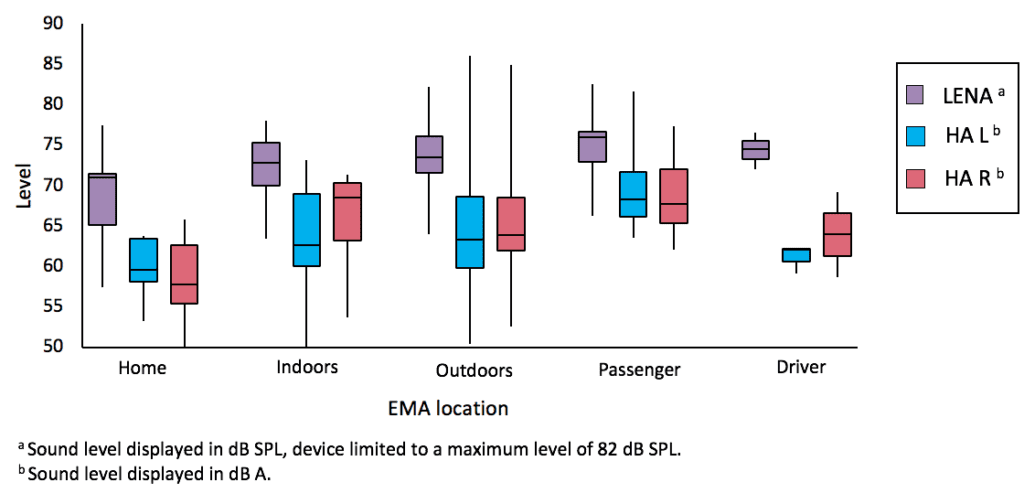
The largest spread in the data can be observed with HA sound levels for the outdoor location category. This indicates variability in the outdoor auditory ecology and the frequency content on the sound being measured, and in the ability of the hearing aid to capture this trend. Data logging characteristics for big-data integration projects are extremely important and will differ according to device limitations. Furthermore, sound level was not a good indicator of location, due to the variability noted within location categories. HA classification schemes unique to vehicle-based data may be warranted.
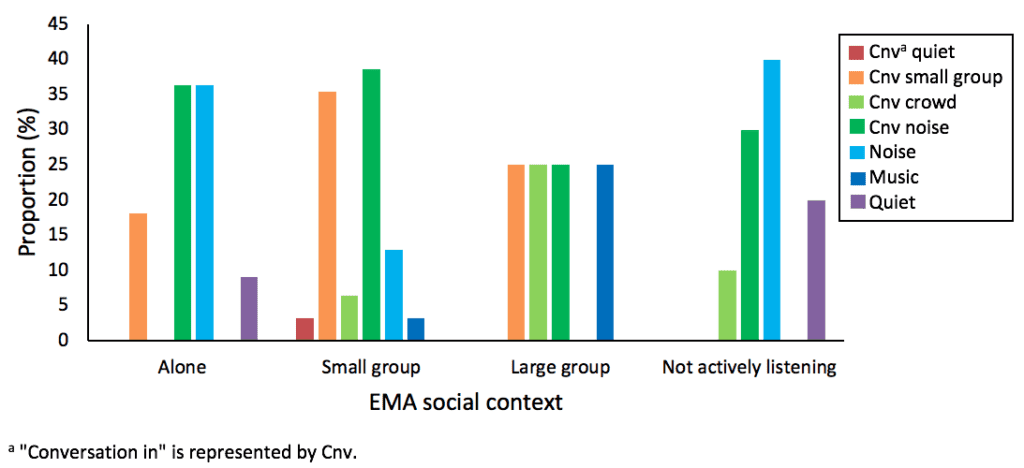
Combining location-based data with social context. The type of listening activity was first explored according to active versus passive (ie, not actively listening) listening for the EMA and listening companion(s) for both the EMA and the HA classifier (Figure 3). Overall, EMA social context data aligned with that classified by the hearing aid, except for when alone. When participants indicated they were in a small group, the hearing aid was more likely to log conversation in a small group and conversation in noise. A large-group context was never classified as conversation in quiet, noise, or quiet. When participants were not actively listening, the hearing aid most often classified the environment as noise. For the “alone” entries, a higher proportion of the sound was classified as conversation in noise and noise. This may be due to the presence of background noise or babble being picked up, even though the participants indicated they were not engaged in conversation.
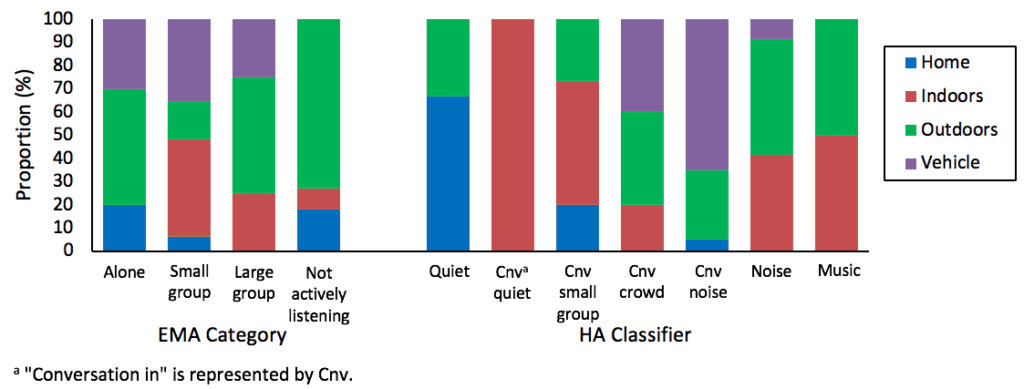
Social context data were then sorted to display proportion of locations as logged by the GIS, for context and device (Figure 4). As participants experienced a wide range of sound environment types across all four GIS-classified locations, this information alone could not fully classify the sound environment. For example, the presence and variation in noise level by location cannot be determined through GIS classifications. Some trends included the presence of GIS logged home data aligning with smaller group settings for both HAs and EMA, in addition to active and noisier environments aligning with vehicle-based data.
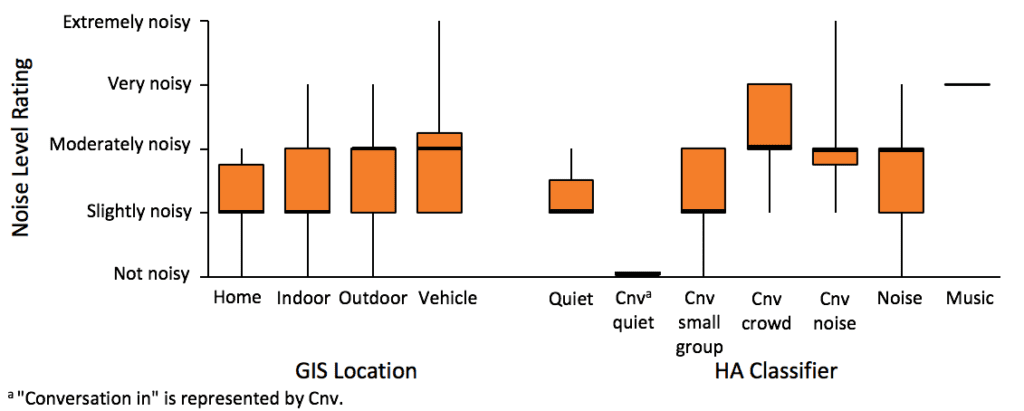
The addition of subjective ratings. Subjecting ratings of noise level were explored according to GIS logged location and HA classification (Figure 5).17 A large spread of noise ratings can be observed across GIS locations. Overall, lower noise ratings in home and indoor locations are noted, along with greater noise ratings in outdoor and vehicle locations. For the HA classifier, few data entries were classified as conversation in quiet or music. For the remaining entries, we see similar trends: lower subjective noise ratings in environments where the hearing aid classified the situation as quiet or conversation in a small group, and higher noise ratings aligning with several hearing aid classifications of noisier environments.
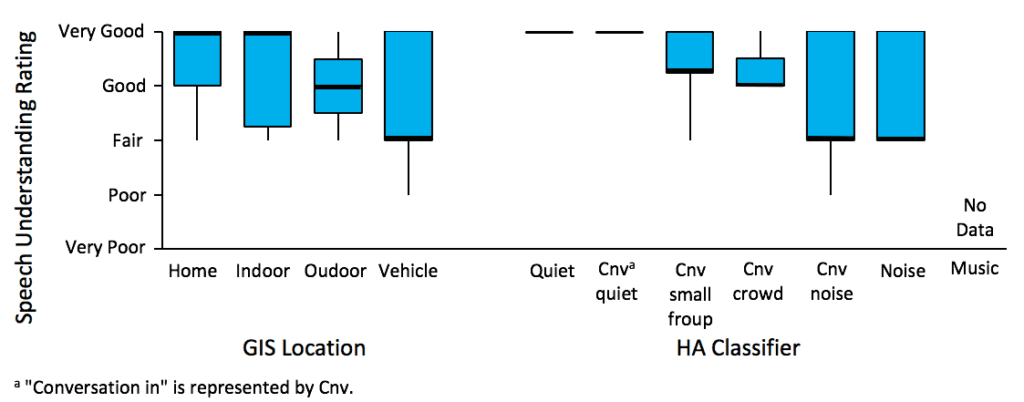
Subjecting ratings of speech understanding were explored according to GIS logged location and HA classification (Figure 6). Ratings ranged between “fair” and “very good.” When comparing median values, the participants reported speech understanding as “fair” when in vehicles (GIS), conversation in noise, and noise only environments (HA); “good” when in outdoor locations (GIS), conversations in a small group, or a crowd (HA); and “very good” at home, indoors, and in quiet environments.
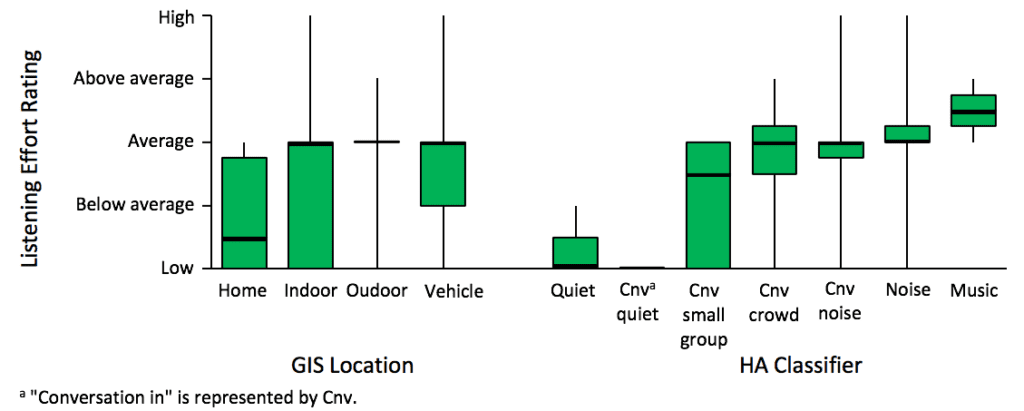
Ratings of listening effort were explored according to GIS location and HA classification (Figure 7). A large spread in ratings can be observed for locations and listening environments generally associated with a higher noise level. Median listening effort rating values were between “low” and “average” levels for both devices, with listening effort generally increasing with the complexity of the situation; however, for both devices, participants perceived most locations and environments with an “average” listening effort. The HA-classified music environment received the highest listening effort ratings (the median value fell between “average” and “above average” ratings)
Discussion
General feasibility. This exploratory study revealed several limiting factors in the feasibility of using multiple tracking devices, related to equipment set-up demands and portability requirements. Participants were provided with a backpack to store all devices over the course of data collection (Figure 1). The requirement to carry around a laptop was reported as cumbersome by some participants. The wired set-up of the HA logging system presented challenges in continuous data collection, due to the hearing aids disconnecting for a variety of reasons which often resulted in lost data from one or both aids. This was a known issue prior to beginning the study and as a result the participants were asked to routinely check the connection of the devices over the course of data collection. Future studies of this nature should strive for wireless set-ups with the ability to connect to a smartphone application, for example. In addition, despite the small sample size and exploratory nature of this study, large amounts of data were logged (Table 3), which required significant data alignment and reduction prior to analyses. The primary analyses—comparing logged data—provides insight into the strengths and limitations of each system.
Included participants. This pilot study was limited to a small sample of adult participants with normal hearing. Further research is needed to explore the feasibility of wireless data collection techniques incorporating multiple devices via real-world trials for individuals with hearing impairment. Although this study highlights the potential of real-world data to inform HA classification and some initial trends, interpretation of the results are limited based on the small sample size and participant population. For example, listeners who have hearing loss may expend increased listening efforts in difficult listening situations, compared to normal-hearing listeners.10 In general, daily life research methods may highlight the increased listening demands imposed on hearing aid users and provide insight into the efficacy and effectiveness of hearing aid classification schemes.
Towards a Better Understanding of Auditory Ecology
Despite these limitations, each of the devices included in this study provided a unique snapshot of experienced auditory ecologies. When combining data across devices, we begin to provide a more comprehensive view of listeners’ ecological demands. Contextual information explored in this study included physical and social context, signal level, and subjective rating of the performance associated with different listening experiences; each device provided different levels of contextual information (Table 1).
EMA research methods allowed us to capture a description of the contextual information of interest, according to each participant’s real-world experiences. These data could then be used as the baseline for comparison across devices.
In general, this study highlights the potential benefit of including more than the traditional acoustic analyses in hearing aid classification. There are specific listening activities that may be better captured through the addition of location-based information, for example, knowledge of when a listener is in a vehicle could inform unique classification schemes that may be different for passengers versus drivers. GIS mapping can easily detect type of location/activity based on patterns of acceleration, and the addition of EMA methods clarifies the location and role of the listener in the vehicle. Social context related to the presence of listening companion(s) and type of activity (for example, active versus passive listening) has the potential to greatly improve the ecological validity of HA classification. As such, it is largely recognized that GPS or any other tracking technologies will never provide the ability to completely replicate activity-travel patterns or capture all the typical elements included in activity-trip diaries.12
The addition of location-based information may be of value when supplemented with other contextual information. As technology advances (eg, using wireless local area network routers12), GIS data may provide a more accurate, detailed, and objective accounting of real-world activity and mobility, especially for indoor locations.18 In the future, it may be possible to use available municipal land use data to determine more specific location-based information with GIS. For example, when outdoors in a forest versus outdoors on a busy commercial street, or indoors in a public recreation center versus indoors in a private dwelling.
This study was designed to use both passive and interactive techniques in the collection of ecological data. The HA classifier, LENA device, and GPS data were all examples of devices that passively logged data, resulting in low burden to the participants at the time of data collection. EMA required subjective input to categorize the environment, activity, and outcomes, which increased the participant burden but provided rich information.
Several strategies could be employed to reduce participant burden. For example, if given permission by the user, a smartphone can determine its location with built-in hardware.12 Such location services could be used in future EMA research, thereby minimizing the need for EMA or GIS classification of location. Further research in the area of EMA methodology and questionnaire development may help reduce participant burden, while still providing an accurate, detailed and subjective description of each listener’s auditory ecology.
Acknowledgement
This study was supported by the Ontario Research Fund (RE08-072) and the Mitacs Accelerate Grant (IT10350).
References
- Gatehouse S, Naylor G, Elberling C. Linear and nonlinear hearing aid fittings–1. Patterns of benefit: Adaptación de auxiliares auditivos lineales y no lineales–1. Patrones de beneficio. Int J Audiol. 2006;45(3):130-152. doi:10.1080/14992020500429518
- Wu Y-H, Stangl E, Chipara O, Hasan SS, Welhaven A, Oleson J. Characteristics of real-world signal to noise ratios and speech listening situations of older adults with mild to moderate hearing loss. Ear Hear. 2018;39(2):293-304. doi:10.1097/AUD.0000000000000486
- Hektner JM, Schmidt JA, Csikszentmihalyi M. Experience Sampling Method: Measuring the Quality of Everyday Life. Thousand Oaks, Calif: Sage Publications; 2007.
- LENA Foundation. The LENA advanced data extractor (ADEX) user guide version 1.1.2. 2011. Available at: https://cdn.shopify.com/s/files/1/0596/9601/files/The_LENA_ADEX_User_Guide.pdf.
- Jankowska MM, Schipperijn J, Kerr J. A framework for using GPS data in physical activity and sedentary behavior studies. Exerc Sport Sci Rev. 2015;43(1):48-56. doi:10.1249/JES.0000000000000035
- Anselin L. Part 2 the link between GIS and spatial analysis: GIS, spatial econometrics and social science research. J Geogr Syst. 2000;2(1):11-15. doi:10.1007/s101090050023
- Doherty ST, Noël N, Gosselin M-L, Sirois C, Ueno M. Moving beyond observed outcomes: integrating global positioning systems and interactive computer-based travel behavior surveys. In: Personal Travel: The Long and Short of It. Transportation Research Circular. Washington, DC: Transportation Research Board; 2001:449-466.
- Doherty ST. Exploring blood glucose variation over geographical space. Diabetes Technol Ther. 2012;14(3):276-284. doi:10.1089/dia.2011.0159
- Shiffman S, Stone AA, Hufford MR. Ecological momentary assessment. Ann Rev Clin Psychol. 2008;4(1):1-32. doi:10.1146/annurev.clinpsy.3.022806.091415
- Alhanbali S, Dawes, Lloyd S, Munro KJ. Self-reported listening-related effort and fatigue in hearing-impaired adults. Ear Hear. 2017;38(1):39-48. doi:10.1097/AUD.0000000000000361
- Timmer BHB, Hickson L, Launer S. Ecological momentary assessment: feasibility, construct validity, and future applications. Am J Audiol. 2017;26(3S):436-442. doi:10.1044/2017_AJA-16-0126
- Aldaz G, Puria S, Leifer LJ. Smartphone-based system for learning and inferring hearing aid settings. J Am Acad Audiol. 2016;27(9):732-749. doi:10.3766/jaaa.15099
- Wu Y-H, Stangl E, Chipara O, Hasan SS, DeVries S, Oleson J. Efficacy and effectiveness of advanced hearing aid directional and noise reduction technologies for older adults with mild to moderate hearing loss. Ear Hear. 2019;40(4):805-822. doi:10.1097/AUD.0000000000000672
- Howard T. Log It All. Unitron; 2014:1-8. Available at: https://www.unitron.com/content/dam/unitron-2014/documents/english/moxi-north/whitepaper/027-5896-02_Log_It_All_Whitepaper_ENG.pdf.
- MetricWire Inc. Real-World Intelligence. https://metricwire.com
- Kiepek N, Beagan B, Harris J. A pilot study to explore the effects of substances on cognition, mood, performance, and experience of daily activities. Perform Enhanc Health. 2018;6(1):3-11. doi:10.1016/j.peh.2018.02.003
- Goldstein J. Descriptors of auditory magnitude and methods of rating community noise. In: Peppin R, Rodman C, eds. Community Noise. West Conshohocken, Pa: ASTM International;1979:38-72. doi:10.1520/STP35961S
- Doherty ST, Lemieux CJ, Canally C. Tracking human activity and well-being in natural environments using wearable sensors and experience sampling. Soc Sci Med. 2014;106:83-92. doi:10.1016/j.socscimed.2014.01.048
About the Authors

Danielle Glista, PhD, is an Assistant Professor at the School of Communication Sciences and Disorders and an Associate Member of the National Centre for Audiology at the University of Western Ontario (UWO). Robin O’Hagan, BA, CDA, is a Research Assistant, National Centre for Audiology at UWO. Leonard Cornelisse, MSc, is Senior Hearing Scientist and Manager of Hearing System Engineering at Unitron in Kitchener, Ontario. Tayyab Shah, PhD, is a freelance researcher based in Saskatchewan, Canada. Donald Hayes, PhD, is Director of Clinical Research at Unitron, Kitchener, Ontario. Sean Doherty, PhD, is Professor in the Department of Geography & Environmental Studies at Wilfred Laurier University, Waterloo, Ontario. Jason Gilliland, PhD, is Professor and Director of the Human Environments Analysis Laboratory, Department of Geography, Department of Pediatrics, Department of Epidemiology & Biostatistics, Children’s Health Research Institute and Lawson Health Research Institute at UWO. Susan Scollie, PhD, is a Professor at the School of Communication Sciences and Disorders and Director of the National Centre for Audiology at UWO.
CORRESPONDENCE can be addressed to Dr Glista at: [email protected]
Citation for this article: Glista D, O’Hagan R, Cornelisse L, Shah T, Hayes D, Doherty S, Gilliland J, Scollie S. Combining passive and interactive techniques in tracking auditory ecology in hearing aid use. Hearing Review. 2020. In press. Published online May 4, 2020.